
EXPOSURE
The Moody's insurance solutions magazine with a unique perspective and clear mission “... to provide insight and analysis to help insurance and risk professionals innovate, adapt, and deliver.”

Insurance: The next 10 years
Mohsen Rahnama, Cihan Biyikoglu and Moe Khosravy of RMS look to 2029, consider the…
Times Square, New York City
Reset Filters
Articles
- 2022
- 2021
- 2020
- 2019
- 2018
- 2017
- 2016
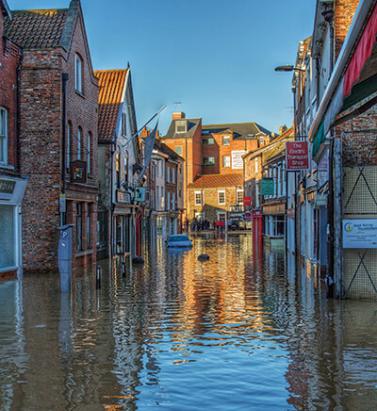
Pushing Back the Water
Flood Re has been tasked with creating a risk-reflective, affordable U.K. flood insurance market by 2039. Moving forward, data resolution that supports critical investment decisions will be key Millions of properties in the U.K. are exposed to some form of flood risk. While exposure levels vary massively across the country, coastal, fluvial and pluvial floods have the potential to impact most locations across the U.K. Recent flood events have dramatically demonstrated this with properties in perceived low-risk areas being nevertheless severely affected. Before the launch of Flood Re, securing affordable household cover in high-risk areas had become more challenging — and for those impacted by flooding, almost impossible. To address this problem, Flood Re — a joint U.K. Government and insurance-industry initiative — was set up in April 2016 to help ensure available, affordable cover for exposed properties. The reinsurance scheme’s immediate aim was to establish a system whereby insurers could offer competitive premiums and lower excesses to highly exposed households. To date it has achieved considerable success on this front. Of the 350,000 properties deemed at high risk, over 150,000 policies have been ceded to Flood Re. Over 60 insurance brands representing 90 percent of the U.K. home insurance market are able to cede to the scheme. Premiums for households with prior flood claims fell by more than 50 percent in most instances, and a per-claim excess of £250 per claim (as opposed to thousands of pounds) was set. While there is still work to be done, Flood Re is now an effective, albeit temporary, barrier to flood risk becoming uninsurable in high-risk parts of the U.K. However, in some respects, this success could be considered low-hanging fruit. A Temporary Solution Flood Re is intended as a temporary solution, granted with a considerable lifespan. By 2039, when the initiative terminates, it must leave behind a flood insurance market based on risk-reflective pricing that is affordable to most households. To achieve this market nirvana, it is also tasked with working to manage flood risks. According to Gary McInally, chief actuary at Flood Re, the scheme must act as a catalyst for this process. “Flood Re has a very clear remit for the longer term,” he explains. “That is to reduce the risk of flooding over time, by helping reduce the frequency with which properties flood and the impact of flooding when it does occur. Properties ought to be presenting a level of risk that is insurable in the future. It is not about removing the risk, but rather promoting the transformation of previously uninsurable properties into insurable properties for the future.” To facilitate this transition to improved property-level resilience, Flood Re will need to adopt a multifaceted approach promoting research and development, consumer education and changes to market practices to recognize the benefit. Firstly, it must assess the potential to reduce exposure levels through implementing a range of resistance (the ability to prevent flooding) and resilience (the ability to recover from flooding) measures at the property level. Second, it must promote options for how the resulting risk reduction can be reflected in reduced flood cover prices and availability requiring less support from Flood Re. According to Andy Bord, CEO of Flood Re: “There is currently almost no link between the action of individuals in protecting their properties against floods and the insurance premium which they are charged by insurers. In principle, establishing such a positive link is an attractive approach, as it would provide a direct incentive for households to invest in property-level protection. “Flood Re is building a sound evidence base by working with academics and others to quantify the benefits of such mitigation measures. We are also investigating ways the scheme can recognize the adoption of resilience measures by householders and ways we can practically support a ‘build-back-better’ approach by insurers.” Modeling Flood Resilience Multiple studies and reports have been conducted in recent years into how to reduce flood exposure levels in the U.K. However, an extensive review commissioned by Flood Re spanning over 2,000 studies and reports found that while helping to clarify potential appropriate measures, there is a clear lack of data on the suitability of any of these measures to support the needs of the insurance market. A 2014 report produced for the U.K. Environment Agency identified a series of possible packages of resistance and resilience measures. The study was based on the agency’s Long-Term Investment Scenario (LTIS) model and assessed the potential benefit of the various packages to U.K. properties at risk of flooding. The 2014 study is currently being updated by the Environment Agency, with the new study examining specific subsets based on the levels of benefit delivered. “It is not about removing the risk, but rather promoting the transformation of previously uninsurable properties into insurable properties” Gary McInally Flood Re Packages considered will encompass resistance and resilience measures spanning both active and passive components. These include: waterproof external walls, flood-resistant doors, sump pumps and concrete flooring. The effectiveness of each is being assessed at various levels of flood severity to generate depth damage curves. While the data generated will have a foundational role in helping support outcomes around flood-related investments, it is imperative that the findings of the study undergo rigorous testing, as McInally explains. “We want to promote the use of the best-available data when making decisions,” he says. “That’s why it was important to independently verify the findings of the Environment Agency study. If the findings differ from studies conducted by the insurance industry, then we should work together to understand why.” To assess the results of key elements of the study, Flood Re called upon the flood modeling capabilities of RMS, and its Europe Inland Flood High-Definition (HD) Models, which provide the most comprehensive and granular view of flood risk currently available in Europe, covering 15 countries including the U.K. The models enable the assessment of flood risk and the uncertainties associated with that risk right down to the individual property and coverage level. In addition, it provides a much longer simulation timeline, capitalizing on advances in computational power through Cloud-based computing to span 50,000 years of possible flood events across Europe, generating over 200,000 possible flood scenarios for the U.K. alone. The model also enables a much more accurate and transparent means of assessing the impact of permanent and temporary flood defenses and their role to protect against both fluvial and pluvial flood events. Putting Data to the Test “The recent advances in HD modeling have provided greater transparency and so allow us to better understand the behavior of the model in more detail than was possible previously,” McInally believes. “That is enabling us to pose much more refined questions that previously we could not address.” While the Environment Agency study provided significant data insights, the LTIS model does not incorporate the capability to model pluvial and fluvial flooding at the individual property level, he explains. RMS used its U.K. Flood HD model to conduct the same analysis recently carried out by the Environment Agency, benefiting from its comprehensive set of flood events together with the vulnerability, uncertainty and loss modeling framework. This meant that RMS could model the vulnerability of each resistance/resilience package for a particular building at a much more granular level. RMS took the same vulnerability data used by the Environment Agency, which is relatively similar to the one used within the model, and ran this through the flood model, to assess the impact of each of the resistance and resilience packages against a vulnerability baseline to establish their overall effectiveness. The results revealed a significant difference between the model numbers generated by the LTIS model and those produced by the RMS Europe Inland Flood HD Models. Since hazard data used by the Environment Agency did not include pluvial flood risk, combined with general lower resolution layers than used in the RMS model, the LTIS study presented an overconcentration and hence overestimation of flood depths at the property level. As a result, the perceived benefits of the various resilience and resistance measures were underestimated — the potential benefits attributed to each package in some instances were almost double those of the original study. The findings can show how using a particular package across a subset of about 500,000 households in certain specific locations, could achieve a potential reduction in annual average losses from flood events of up to 40 percent at a country level. This could help Flood Re understand how to allocate resources to generate the greatest potential and achieve the most significant benefit. A Return on Investment? There is still much work to be done to establish an evidence base for the specific value of property-level resilience and resistance measures of sufficient granularity to better inform flood-related investment decisions. “The initial indications from the ongoing Flood Re cost-benefit analysis work are that resistance measures, because they are cheaper to implement, will prove a more cost-effective approach across a wider group of properties in flood-exposed areas,” McInally indicates. “However, in a post-repair scenario, the cost-benefit results for resilience measures are also favorable.” However, he is wary about making any definitive statements at this early stage based on the research to date. “Flood by its very nature includes significant potential ‘hit-and-miss factors’,” he points out. “You could, for example, make cities such as Hull or Carlisle highly flood resistant and resilient, and yet neither location might experience a major flood event in the next 30 years while the Lake District and West Midlands might experience multiple floods. So the actual impact on reducing the cost of flooding from any program of investment will, in practice, be very different from a simple modeled long-term average benefit. Insurance industry modeling approaches used by Flood Re, which includes the use of the RMS Europe Inland Flood HD Models, could help improve understanding of the range of investment benefit that might actually be achieved in practice.”


Are We Moving Off The Baseline?
How is climate change influencing natural perils and weather extremes, and what should reinsurance companies do to respond? Reinsurance companies may feel they are relatively insulated from the immediate effects of climate change on their business, given that most property catastrophe policies are renewed on an annual basis. However, with signs that we are already moving off the historical baseline when it comes to natural perils, there is evidence to suggest that underwriters should already be selectively factoring the influence of climate change into their day-to-day decision-making. Most climate scientists agree that some of the extreme weather anticipated by the United Nations Intergovernmental Panel on Climate Change (IPCC) in 2013 is already here and can be linked to climate change in real time via the burgeoning field of extreme weather attribution. “It’s a new area of science that has grown up in the last 10 to 15 years,” explains Dr. Robert Muir-Wood, chief research officer at RMS. “Scientists run two climate models for the whole globe, both of them starting in 1950. One keeps the atmospheric chemistry static since then, while the other reflects the actual increase in greenhouse gases. By simulating thousands of years of these alternative worlds, we can find the difference in the probability of a particular weather extreme.” “Underwriters should be factoring the influence of climate change into their day-to-day decision-making” For instance, climate scientists have run their models in an effort to determine how much the intensity of the precipitation that caused such devastating flooding during last year’s Hurricane Harvey can be attributed to anthropogenic climate change. Research conducted by scientists at the World Weather Attribution (WWA) project has found that the record rainfall produced by Harvey was at least three times more likely to be due to the influence of global warming. This suggests, for certain perils and geographies, reinsurers need to be considering the implications of an increased potential for certain climate extremes in their underwriting. “If we can’t rely on the long-term baseline, how and where do we modify our perspective?” asks Muir-Wood. “We need to attempt to answer this question peril by peril, region by region and by return period. You cannot generalize and say that all perils are getting worse everywhere, because they’re not. In some countries and perils there is evidence that the changes are already material, and then in many other areas the jury is out and it’s not clear.” Keeping Pace With the Change While the last IPCC Assessment Report (AR5) was published in 2014 (the next is due in 2021), there is some consensus on how climate change is beginning to influence natural perils and climate extremes. Many regional climates naturally have large variations at interannual and even interdecadal timescales, which makes observation of climate change, and validation of predictions, more difficult. “There is always going to be uncertainty when it comes to climate change,” emphasizes Swenja Surminski, head of adaptation research at the Grantham Research Institute on Climate Change and the Environment, part of the London School of Economics and Political Science (LSE). “But when you look at the scientific evidence, it’s very clear what’s happening to temperature, how the average temperature is increasing, and the impact that this can have on fundamental things, including extreme events.” According to the World Economic Forum’s Global Risks Report in 2018, “Too little has been done to mitigate climate change and … our own analysis shows that the likelihood of missing the Paris Agreement target of limiting global warming to two degrees Celsius or below is greater than the likelihood of achieving it.” The report cites extreme weather events and natural disasters as the top two “most likely” risks to happen in the next 10 years and the second- and third-highest risks (in the same order) to have the “biggest impact” over the next decade, after weapons of mass destruction. The failure of climate change mitigation and adaptation is also ranked in the top five for both likelihood and impact. It notes that 2017 was among the three hottest years on record and the hottest ever without an El Niño. It is clear that climate change is already exacerbating climate extremes, says Surminski, causing dry regions to become drier and hot regions to become hotter. “By now, based on our scientific understanding and also thanks to modeling, we get a much better picture of what our current exposure is and how that might be changing over the next 10, 20, even 50 to 100 years,” she says. “There is also an expectation we will have more freak events, when suddenly the weather produces really unexpected, very unusual phenomena,” she continues. “That’s not just climate change. It’s also tied into El Niño and other weather phenomena occurring, so it’s a complex mix. But right now, we’re in a much better position to understand what’s going on and to appreciate that climate change is having an impact.” Pricing for Climate Change For insurance and reinsurance underwriters, the challenge is to understand the extent to which we have already deviated from the historical record and to manage and price for that appropriately. It is not an easy task given the inherent variability in existing weather patterns, according to Andy Bord, CEO of Flood Re, the U.K.’s flood risk pool, which has a panel of international reinsurers. “The existing models are calibrated against data that already includes at least some of the impact of climate change,” he says. “Some model vendors have also recently produced models that aim to assess the impact of climate change on the future level of flood risk in the U.K. We know at least one larger reinsurer has undertaken their own climate change impact analyses. “We view improving the understanding of the potential variability of weather given today’s climate as being the immediate challenge for the insurance industry, given the relatively short-term view of markets,” he adds. The need for underwriters to appreciate the extent to which we may have already moved off the historical baseline is compounded by the conflicting evidence on how climate change is influencing different perils. And by the counterinfluence or confluence, in many cases, of naturally occurring climate patterns, such as El Niño and the Atlantic Multidecadal Oscillation (AMO). The past two decades have seen below-normal European windstorm activity, for instance, and evidence builds that the unprecedented reduction in Arctic sea ice during the autumn months is the main cause, according to Dr. Stephen Cusack, director of model development at RMS. “In turn, the sea ice declines have been driven both by the ‘polar amplification’ aspect of anthropogenic climate change and the positive phase of the AMO over the past two decades, though their relative roles are uncertain. “We view improving the understanding of the potential variability of weather given today’s climate as being the immediate challenge for the insurance industry, given the relatively short-term view of markets” Andy Bord Flood Re “The (re)insurance market right now is saying, ‘Your model has higher losses than our recent experience.’ And what we are saying is that the recent lull is not well understood, and we are unsure how long it will last. Though for pricing future risk, the question is when, and not if, the rebound in European windstorm activity happens. Regarding anthropogenic climate change, other mechanisms will strengthen and counter the currently dominant ‘polar amplification’ process. Also, the AMO goes into positive and negative phases,” he continues. “It’s been positive for the last 20 to 25 years and that’s likely to change within the next decade or so.” And while European windstorm activity has been somewhat muted by the AMO, the same cannot be said for North Atlantic hurricane activity. Hurricanes Harvey, Irma and Maria (HIM) caused an estimated US$92 billion in insured losses, making 2017 the second costliest North Atlantic hurricane season, according to Swiss Re Sigma. “The North Atlantic seems to remain in an active phase of hurricane activity, irrespective of climate change influences that may come on top of it,” the study states. While individual storms are never caused by one factor alone, stressed the Sigma study, “Some of the characteristics observed in HIM are those predicted to occur more frequently in a warmer world.” In particular, it notes the high level of rainfall over Houston and hurricane intensification. While storm surge was only a marginal contributor to the losses from Hurricane Harvey, Swiss Re anticipates the probability of extreme storm surge damage in the northeastern U.S. due to higher seas will almost double in the next 40 years. “From a hurricane perspective, we can talk about the frequency of hurricanes in a given year related to the long-term average, but what’s important from the climate change point of view is that the frequency and the intensity on both sides of the distribution are increasing,” says Dr. Pete Dailey, vice president at RMS. “This means there’s more likelihood of quiet years and more likelihood of very active years, so you’re moving away from the mean, which is another way of thinking about moving away from the baseline. “So, we need to make sure that we are modeling the tail of the distribution really well, and that we’re capturing the really wet years — the years where there’s a higher frequency of torrential rain in association with events that we model.” The Edge of Insurability Over the long term, the industry likely will be increasingly insuring the impact of anthropogenic climate change. One question is whether we will see “no-go” areas in the future, where the risk is simply too high for insurance and reinsurance companies to take on. As Robert Muir-Wood of RMS explains, there is often a tension between the need for (re)insurers to charge an accurate price for the risk and the political pressure to ensure cover remains available and affordable. He cites the community at Queen’s Cove in Grand Bahama, where homes were unable to secure insurance given the repeated storm surge flood losses they have sustained over the years from a number of hurricanes. Unable to maintain a mortgage without insurance, properties were left to fall into disrepair. “Natural selection came up with a solution,” says Muir-Wood, whereby some homeowners elevated buildings on concrete stilts thereby making them once again insurable. “In high-income, flood-prone countries, such as Holland, there has been sustained investment in excellent flood defenses,” he says. “The challenge in developing countries is there may not be the money or the political will to build adequate flood walls. In a coastal city like Jakarta, Indonesia, where the land is sinking as a result of pumping out the groundwater, it’s a huge challenge. “It’s not black and white as to when it becomes untenable to live somewhere. People will find a way of responding to increased incidence of flooding. They may simply move their life up a level, as already happens in Venice, but insurability will be a key factor and accommodating the changes in flood hazard is going to be a shared challenge in coastal areas everywhere.” Political pressure to maintain affordable catastrophe insurance was a major driver of the U.S. residual market, with state-backed Fair Access to Insurance Requirements (FAIR) plans providing basic property insurance for homes that are highly exposed to natural catastrophes. Examples include the California Earthquake Association, Texas Windstorm Insurance Association and Florida Citizens Property Insurance Corporation (and state reinsurer, the FHCF). However, the financial woes experienced by FEMA’s National Flood Insurance Program (NFIP), currently the principal provider of residential flood insurance in the U.S., demonstrates the difficulties such programs face in terms of being sustainable over the long term. With the U.K.’s Flood Re scheme, investment in disaster mitigation is a big part of the solution, explains CEO Andy Bord. However, even then he acknowledges that “for some homes at the very greatest risk of flooding, the necessary investment needed to reduce risks and costs would simply be uneconomic.”
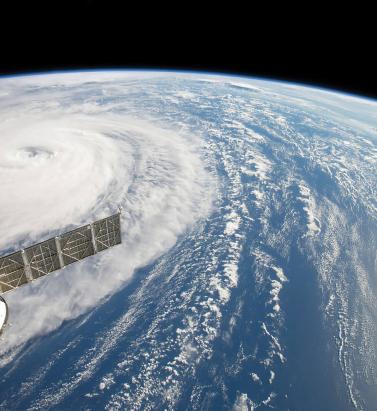

Making it Clear
Pete Dailey of RMS explains why model transparency is critical to client confidence View of Hurricane Harvey from space In the aftermath of Hurricances Harvey, Irma and Maria (HIM), there was much comment on the disparity among the loss estimates produced by model vendors. Concerns have been raised about significant outlier results released by some modelers. “It’s no surprise,” explains Dr. Pete Dailey, vice president at RMS, “that vendors who approach the modeling differently will generate different estimates. But rather than pushing back against this, we feel it’s critical to acknowledge and understand these differences. “At RMS, we develop probabilistic models that operate across the full model space and deliver that insight to our clients. Uncertainty is inherent within the modeling process for any natural hazard, so we can’t rely solely on past events, but rather simulate the full range of plausible future events.” There are multiple components that contribute to differences in loss estimates, including the scientific approaches and technologies used and the granularity of the exposure data. “Increased demand for more immediate data is encouraging modelers to push the envelope” “As modelers, we must be fully transparent in our loss-estimation approach,” he states. “All apply scientific and engineering knowledge to detailed exposure data sets to generate the best possible estimates given the skill of the model. Yet the models always provide a range of opinion when events happen, and sometimes that is wider than expected. Clients must know exactly what steps we take, what data we rely upon, and how we apply the models to produce our estimates as events unfold. Only then can stakeholders conduct the due diligence to effectively understand the reasons for the differences and make important financial decisions accordingly.” Outlier estimates must also be scrutinized in greater detail. “There were some outlier results during HIM, and particularly for Hurricane Maria. The onus is on the individual modeler to acknowledge the disparity and be fully transparent about the factors that contributed to it. And most importantly, how such disparity is being addressed going forward,” says Dailey. “A ‘big miss’ in a modeled loss estimate generates market disruption, and without clear explanation this impacts the credibility of all catastrophe models. RMS models performed quite well for Maria. One reason for this was our detailed local knowledge of the building stock and engineering practices in Puerto Rico. We’ve built strong relationships over the years and made multiple visits to the island, and the payoff for us and our client comes when events like Maria happen.” As client demand for real-time and pre-event estimates grows, the data challenge placed on modelers is increasing. “Demand for more immediate data is encouraging modelers like RMS to push the scientific envelope,” explains Dailey, “as it should. However, we need to ensure all modelers acknowledge, and to the degree possible quantify, the difficulties inherent in real-time loss estimation — especially since it’s often not possible to get eyes on the ground for days or weeks after a major catastrophe.” Much has been said about the need for modelers to revise initial estimates months after an event occurs. Dailey acknowledges that while RMS sometimes updates its estimates, during HIM the strength of early estimates was clear. “In the months following HIM, we didn’t need to significantly revise our initial loss figures even though they were produced when uncertainty levels were at their peak as the storms unfolded in real time,” he states. “The estimates for all three storms were sufficiently robust in the immediate aftermath to stand the test of time. While no one knows what the next event will bring, we’re confident our models and, more importantly, our transparent approach to explaining our estimates will continue to build client confidence.”
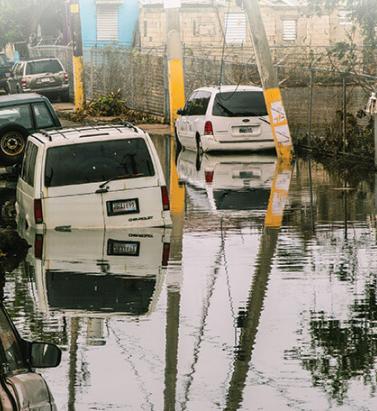
When the Lights Went Out
How poor infrastructure, grid blackouts and runaway business interruption has hampered Puerto Rico’s recovery in the aftermath of Hurricane Maria As the 2018 North Atlantic hurricane season continues, Puerto Rico has yet to recover from destructive events of the previous year. In September 2017, Category 4 Hurricane Maria devastated several Caribbean islands, including Puerto Rico, and left a trail of destruction in its path. For many, Maria was one of the worst natural catastrophes to hit a U.S. territory, causing an estimated US$65 billion to US$115 billion in damage and claiming as many as 4,500 to 5,000 lives. The damage wrought has further strained the island’s sluggish economy. Puerto Rico had over US$70 billion in public debt when Maria hit. Economic forecasts for 2018 to 2020, considering the impact of Hurricane Maria, suggest Puerto Rico’s GDP will decline by 7 to 8 percent in 2018 and likely remain in a negative range of 5 to 7 percent for the next few years. “Resilience is also about the financial capacity to come back and do the reconstruction work” Pooya Sarabandi RMS Power outages, business interruption (BI) and contingent BI (CBI) — including supply chain disruption — have hampered the economy’s recovery. “Resilience is also about the financial capacity to come back and do the reconstruction work,” explains Pooya Sarabandi, global head of data analy- tics at RMS. “You’re now into this chicken- and-egg situation where the Puerto Rican government already has a lot of public debt and doesn’t have reserves, and meanwhile the federal U.S. government is only willing to provide a certain level of funding.” Maria’s devastating impact on Puerto Rico demonstrates the lasting effect a major catastrophe can have when it affects a small, isolated region with a concentrated industry and lack of resilience in infrastructure and lifelines. Whereas manufacturers based on the U.S. mainland have contingencies to tap into — the workforce, raw materials and components, and infrastructure in other parts of the country during times of need — there is not the same opportunity to do this on an island, explains Sarabandi. Rolling Blackouts Following Maria’s landfall, residences and businesses experienced power outages throughout the island. Severe physical damage to electric power generation plants, transmission and distribution systems — including solar and wind power generation plants — plunged the island into a prolonged period of rolling blackouts. Around 80 percent of utility poles were damaged in the event, leaving most of the island without electricity. Two weeks after the storm, 90 percent of the island was still without power. A month on, roughly 85 percent of customers were not connected to the power grid. Three months later, this figure was reported to be about half of Puerto Ricans. And finally, after six months, about 15 percent of residents did not have electricity. “There’s no real damage on the grid itself,” says Victor Roldan, head of Caribbean and Latin America at RMS. “Most of the damage is on the distribution lines around the island. Where they had the better infrastructure in the capital, San Juan, they were able to get it back up and running in about two weeks. But there are still parts of the island without power due to bad distribution infrastructure. And that’s where the business interruption is mostly coming from. “There are reports that 50 percent of all Maria claims for Puerto Rico will be CBI related,” adds Roldan. “Insurers were very competitive, and CBI was included in commercial policies without much thought to the consequences. Policyholders probably paid a fifth of the premiums they should have, way out of kilter with the risk. The majority of CBI claims will be power related, the businesses didn’t experience physical damage, but the loss of power has hit them financially.” Damage to transportation infrastructure, including railways and roads, only delayed the pace of recovery. The Tren Urbano, the island’s only rail line that serves the San Juan metropolitan area (where roughly 60 percent of Puerto Ricans live), started limited service for the first time almost three months after Hurricane Maria struck. There were over 1,500 reported instances of damage to roads and bridges across the island. San Juan’s main airport, the busiest in the Caribbean, was closed for several weeks. A Concentration of Risk Roughly half of Puerto Rico’s economy is based on manufacturing activities, with around US$50 billion in GDP coming from industries such as pharmaceutical, medical devices, chemical, food, beverages and tobacco. Hurricane Maria had a significant impact on manufacturing output in Puerto Rico, particularly on the pharmaceutical and medical devices industries, which is responsible for 30 percent of the island’s GDP. According to Anthony Phillips, chairman of Willis Re Latin America and Caribbean, the final outcome of the BI loss remains unknown but has exceeded expectations due to the length of time in getting power reinstalled. “It’s hard to model the BI loss when you depend on the efficiency of the power companies,” he says. “We used the models and whilst personal lines appeared to come in within expectations, commercial lines has exceeded them. This is mainly due to BI and the inability of the Puerto Rico Electric Power Authority (PREPA) to get things up and running.” Home to more than 80 pharmaceutical manufacturing facilities, many of which are operated by large multinational companies, Puerto Rico’s pharmaceutical hub was a significant aggregation of risk from a supply chain and insurance perspective. Although only a few of the larger pharmaceutical plants were directly damaged by the storm, operations across the sector were suspended or reduced, in some cases for weeks or even months, due to power outages, lack of access and logistics. “The perception of the Business Interruption insurers anticipated, versus the reality, was a complete mismatch” Mohsen Rahnama RMS “The perception of the BI insurers anticipated, versus the reality, was a complete mismatch,” says Mohsen Rahnama, chief risk modeling officer at RMS. “All the big names in pharmaceuticals have operations in Puerto Rico because it’s more cost- effective for production. And they’re all global companies and have backup processes in place and cover for business interruption. However, if there is no diesel on the island for their generators, and if materials cannot get to the island, then there are implications across the entire chain of supply.” While most of the plants were equipped with backup power generation units, manu- facturers struggled due to long-term lack of connection to the island’s only power grid. The continuous functioning of on-site generators was not only key to resuming production lines, power was also essential for refrigeration and storage of the pharmaceuticals. Five months on, 85 medicines in the U.S. were classified by the Food and Drug Administration (FDA) as “in shortage.” There are several reasons why Puerto Rico’s recovery stalled. Its isolation from the U.S. mainland and poor infrastructure were both key factors, highlighted by comparing the island’s recovery to recovery operations following U.S. mainland storms, such as Hurricane Harvey in Texas last year and 2012’s Superstorm Sandy. Not only did Sandy impact a larger area when it hit New York and New Jersey, it also caused severe damage to all transmission and distribution systems in its path. However, recovery and restoration took weeks, not months. It is essential to incorporate the vulnerabilities created by an aggregation of risk, inadequate infrastructure and lack of contingency options into catastrophe and pricing models, thinks Roldan. “There is only one power company and the power company is facing bankruptcy,” he says. “It hasn’t invested in infrastructure in years. Maria wasn’t even the worst-case scenario because it was not a direct hit to San Juan. So, insurers need to be prepared and underwriting business interruption risks in a more sophisticated manner and not succumbing to market pressures.” CBI Impact on Hospitality and Tourism Large-magnitude, high-consequence events have a lasting impact on local populations. Businesses can face increased levels of disruption and loss of revenue due to unavailability of customers, employees or both. These resourcing issues need to be properly considered in the scenario-planning stage, particularly for sectors such as hospitality and tourism. Puerto Rico’s hospitality and tourism sectors are a significant source of its GDP. While 69 percent of hotels and 61 percent of casinos were operational six weeks after Maria struck, according to the Puerto Rico Tourism Company, other factors continued to deter visitors. It was not until the end of February 2018, five months after the event, that roughly 80 percent of Puerto Rico’s hotels and restaurants were back in business with tourists returning to the island. This suggests a considerable loss of income due to indirect business interruption in the hospitality and tourism industry.
The Future for Flood Protection
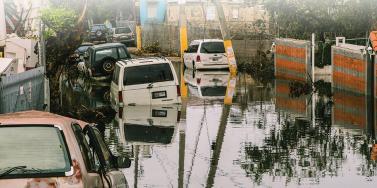
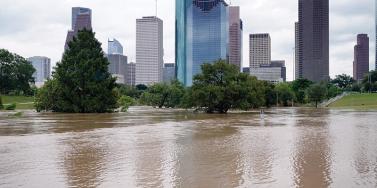
With innovation in the flood market increasing, EXPOSURE explores whether high-definition (HD) flood models are one of the keys to closing the protection gap In August 2017, Hurricane Harvey brought the highest level of rainfall associated with a tropical cyclone in the U.S. since records began, causing catastrophic flooding in some of the most populated areas of the Texas coast, including Houston. The percentage of losses attributed to inland flood versus wind damage was significant, altering the historical view that precipitation resulting from a tropical storm or hurricane is an attritional loss and highlighting the need for stochastic modeling. Total economic losses resulting from Harvey were around US$85 billion and insured losses were US$30 billion, revealing a significant protection gap, particularly where inland flood damage was concerned. Around 200,000 homes were inundated by the floods, and yet 80 percent of homes in the Houston area were uninsured. Hurricane Harvey Impacts – Aftermath An innovative catastrophe bond has suggested one way this protection gap could be reduced in the future, particularly as a private flood insurance market develops in the U.S. FloodSmart Re, which was announced at the end of July 2018, secured US$500 million of reinsurance protection on behalf of FEMA’s National Flood Insurance Program (NFIP). Reinsurer Hannover Re was acting as the ceding reinsurer for the transaction, sitting between the NFIP and its Bermuda-based special purpose insurer. “It’s a landmark transaction — the first time in history that the U.S. federal government is sponsoring a catastrophe bond,” says John Seo, co-founder and managing principal at Fermat Capital. “It’s just tremendous and I couldn’t be more excited. Events like Harvey are going to accelerate the development of the flood market in terms of risk transfer to the insurance-linked securities (ILS) market. “You have to have more efficient risk pooling and risk sharing mechanisms,” he adds. “There’s over US$200 trillion dollars of capital in the world, so there’s obviously enough to efficiently absorb event risk. So, it’s about, how do you get it out into that larger capital base in an efficient way?” While the bond only provides cover for flooding arising from named storms, either due to storm surge or rainfall, it is a “good test case for the ILS market’s appetite for flood risks,” according to ILS blog Artemis. While “it is not a broad flood coverage, it will likely help to make it more palatable to cat bond investors given their comfort with modeling the probability of named storms, tropical storms and hurricanes.” According to Cory Anger, global head of ILS origination and structuring at GC Securities, the ILS market is certainly showing an appetite for flood risk — including inland flood risk — with several catastrophe bonds completed during 2017 for European flood risk (Generali’s Lion II), Japanese flood risk (MSI and ADI’s Akibare Series 2018-1 Notes) and U.S. flood risk. “Both public and private sector entities see value from utilizing capital markets’ capacity to manage flood risk,” she says. “We think there are other geographic regions that would be interested in ILS capacity that haven’t yet tapped the ILS markets. Given the recent success of FEMA/NFIP’s FloodSmart Re Series 2018-1 Notes, we expect FEMA/NFIP to continue to utilize ILS capacity (along with traditional reinsurance capital) to support future U.S. flood risk transfer opportunities.” The ILS sector has grown significantly over the past 15 years, with deals becoming more complex and innovative over time. Many market commentators feel the market was put to the test following the major natural catastrophe losses in 2017. Not only did bonds pay out where they were triggered, fresh capital re-entered, demonstrating investors’ confidence in the sector and its products. “I’m hearing people starting to coin the phrase that 2018 is the ‘great reload,’” says Seo. “This is something I have been saying for quite some years: That the traditional hard-soft, soft-hard market cycle is over. It’s not that you can’t have an event so large that it doesn’t impact the market, but when it comes to capital markets, high yields are actually a siren call for capital. “I don’t think anyone doubts that had 2017 occurred in the absence of the ILS market it would have been a completely different story, and we would have had a traditional hard market scenario in 2018,” he adds. FloodSmart Re has clearly demonstrated the strong investor interest in such transactions. According to Anger, GC Securities acted as the structuring agent for the transaction and was one of two book runners. More than 35 capital markets investors provided fully collateralized protection to FEMA/NFIP on the landmark catastrophe bond. “The appetite for new perils is generally strong, so there’s always strong interest when new risks are brought to market,” says Ben Brookes, managing director of capital and resilience solutions at RMS. He thinks improvements in the underlying data quality along with high-definition flood models make it more likely that inland flood could be included as a peril in future catastrophe bond issuances on behalf of private insurers, on an indemnity basis. “In the early days of the cat bond market, new perils would typically be issued with parametric triggers, because investors were skeptical that sufficient data quality was achieved or that the indemnity risks were adequately captured by cat models. But that changed as investor comfort grew, and a lot of capital entered the market and you saw all these deals becoming indemnity. Increased comfort with risk modeling was a big part of that.” The innovative Blue Wings catastrophe bond, which covered insurer Allianz for severe U.K. flood risk (and some U.S. and Canadian quake) and was completed in 2007, is a good example. The parametric bond used an index to calculate flood depths at over 50 locations across the U.K., was ahead of its time and is the only U.K. flood catastrophe bond that has come to market. According to Anger, as models have become more robust for flood risk — whether due to tropical cyclone (storm surge and excess precipitation) or inland flooding (other than from tropical cyclone) — the investor base has been open to trigger selection (e.g., indemnity or parametric). “In general, insurers are preferring indemnity-triggered solutions,” she adds, “which the ILS market has concurrently been open to. Additionally, for this peril, the ILS community has been open to per occurrence and annual aggregate structures, which gives flexibility to sponsors to incorporate ILS capital in their risk transfer programs.” As the private market develops, cat bond sponsors from the insurance market would be more likely to bundle inland flood risk in with other perils, thinks Charlotte Acton, director of capital and resilience solutions at RMS. “A degree of hurricane-induced inland flood risk is already present on a non-modeled basis within some transactions in the market,” she says. “And Harvey illustrates the value in comprehensive modeling of flooding associated with named storms. “So, for a broader portfolio, in most cases, inland flood would be one piece of the picture as it will be exposed to multiple perils. However, a stand-alone inland flood bond is possible for a public sector or corporate sponsor that has specific exposure to flood risk.” With inland flood, as with all other perils, sophisticated models help to make markets. “A fund would look at the risk in and of itself in the deal, but of course they’d also want to understand the price and returns perspective as well,” says Brookes. “Models play into that quite heavily. You can’t price a bond well, and understand the returns of a bond, unless you understand the risk of it.” As the ILS market makes increasing use of indemnity protection through ultimate net loss (UNL) triggers, sophisticated HD flood modeling will be essential in order to transfer the peril to the capital markets. This allows clear parameters to be set around different hours clauses and deductible structures, for instance, in addition to modeling all causes of flood and the influence of local defenses. “It’s a landmark transaction — the first time in history that the U.S. Federal Government is sponsoring a catastrophe bond” John SEO Fermat capital Jillian Williams, chief underwriting officer at Leadenhall Capital Partners, notes that ILS is increasingly bundling together multiple perils in an effort to gain diversification. “Diversification is important for any investment strategy, as you are always trying to minimize the risk of losing large amounts in one go,” she says. “Cat bonds (144A’s) currently have defined perils, but collateralized reinsurance and private cat bonds can cover all perils. Complexities and flow of information to all parties will be a challenge for cat bonds to move from defined perils to UNL all perils. “Any new peril or structure in a cat bond will generate many questions, even if they don’t have a major impact on the potential losses,” she continues. “Investors will want to know why the issuers want to include these new perils and structures and how the associated risk is calculated. For UNL, all flood (not just sea surge) would be included in the cat bond, so the definition of the peril, its complexities, variables and its correlation to other perils will need to be evaluated and represented in the flood models used.” She thinks the potential to transfer more flood to the capital markets is there, but that the complexity of the peril are challenges that need to be overcome, particularly in the U.S. “Flood coverage is already starting to move into the capital markets, but there are many issues that need to be worked through before it can be moved to a 144A transaction in a UNL format for many territories,” says Williams. “Just one of the complexities is that flood risk may be covered by government pools. “To move flood perils from government pools to private insurers is like any evolution, it can take time, particularly if existing coverage is subsidized,” she adds. “For private insurers, the complexity is not just about flood modeling but also about ensuring risk-adequate pricing and navigating through government legislation.”


A Risk-Driven Business
Following Tower Insurance’s switch to risk-based pricing in New Zealand, EXPOSURE examines how recent market developments may herald a more fundamental industry shift The ramifications of the Christchurch earthquakes of 2010-11 continue to reverberate through the New Zealand insurance market. The country’s Earthquake Commission (EQC), which provides government-backed natural disaster insurance, is forecast to have paid around NZ$11 billion (US$7.3 billion) by the time it settles its final claim. The devastating losses exposed significant shortfalls in the country’s insurance market. These included major deficiencies in insurer data, gaps in portfolio management and expansive policy wordings that left carriers exposed to numerous unexpected losses. Since then, much has changed. Policy terms have been tightened, restrictions have been introduced on coverage and concerted efforts have been made to bolster databases. On July 1, 2019, the EQC increased the cap limit on the government-mandated residential cover it provides to all householders from NZ$100,000 (US$66,000) (a figure set in 1993) to NZ$150,000. A significant increase, but well below the average house price in New Zealand as of December 2017, which stood at NZ$669,565, and an average rebuild cost of NZ$350,000. It has also removed contents coverage. More recently, however, one development has taken place that has the potential to have a much more profound impact on the market. Risk-Based Pricing In March 2018, New Zealand insurer Tower Insurance announced a move to risk-based pricing for home insurance. It aims to ensure premium levels are commensurate with individual property risk profiles, with those in highly exposed areas experiencing a price rise on the earthquake component of their coverage. Describing the shift as a “fairer and more equitable way of pricing risk,” Tower CEO Richard Harding says this was the “right thing to do” both for the “long-term benefit of New Zealand” and for customers, with risk-based pricing “the fairest way to distribute the costs we face as an insurer.” The move has generated much media coverage, with stories highlighting instances of triple-digit percentage hikes in earthquake-prone regions such as Wellington. Yet, what has generated significantly fewer column inches has been the marginal declines available to the vast majority of households in the less seismically active regions, as the high-risk earthquake burden on their premium is reduced. A key factor in Tower’s decision was the increasing quality and granularity of the underwriting data at its disposal. “Tower has always focused on the quality of its data and has invested heavily in ensuring it has the highest-resolution information available,” says Michael Drayton, senior risk modeler for RMS, based in New Zealand. “The earthquakes generated the most extensive liquefaction in a built-up area seen in a developed country” Michael Drayton RMS In fact, in the aftermath of the Christchurch earthquakes, RMS worked with Tower as RMS rebuilt its New Zealand High-Definition (HD) Earthquake Model due to the caliber of their data. Prior to the earthquake, claims data was in very short supply given that there had been few previous events with large-scale impacts on highly built-up areas. “On the vulnerability side,” Drayton explains, “we had virtually no local claims data to build our damage functions. Our previous model had used comparisons of building performance in other earthquake-exposed regions. After Christchurch, we suddenly had access to billions of dollars of claims information.” RMS sourced data from numerous parties, including EQC and Tower, as well as geoscience research firm GNS Science, as it reconstructed the model from this swell of data. “RMS had a model that had served the market well for many years,” he explains. “On the hazard side, the fundamentals remained the same — the highest hazard is along the plate boundary, which runs offshore along the east coast of North Island traversing over to the western edge of South Island. But we had now gathered new information on fault lines, activity rates, magnitudes and subduction zones. We also updated our ground motion prediction equations.” One of the most high-profile model developments was the advanced liquefaction module. “The 2010-11 earthquakes generated probably the most extensive liquefaction in a built-up area seen in a developed country. With the new information, we were now able to capture the risk at much higher gradients and in much greater resolution,” says Drayton. This data surge enabled RMS to construct its New Zealand Earthquake HD Model on a variable resolution grid set at a far more localized level. In turn, this has helped give Tower sufficient confidence in the granularity and accuracy of its data at the property level to adopt risk-based pricing. The Ripple Effects As homeowners received their renewal notices, the reality of risk-based pricing started to sink in. Tower is the third-largest insurer for domestic household, contents and private motor cover in New Zealand and faces stiff competition. Over 70 percent of the market is in the hands of two players, with IAG holding around 47 percent and Suncorp approximately 25 percent. News reports also suggested movement from the larger players. AMI and State, both owned by IAG, announced that three-quarters of its policyholders — those at heightened risk of earthquake, landslide or flood — will see an average annual premium increase of NZ$91 (US$60); the remaining quarter at lower risk will see decreases averaging NZ$54 per year. A handful of households could see increases or decreases of up to NZ$1,000. According to the news website Stuff, IAG has not changed premiums for its NZI policyholders, with NZI selling house insurance policies through brokers. “One interesting dynamic is that a small number of start-ups are now entering the market with the same risk-based pricing stance taken by Tower,” Drayton points out. “These are companies with new purpose-built IT systems that are small and nimble and able to target niche sectors.” “It’s certainly a development to watch closely,” he continues, “as it raises the potential for larger players, if they are not able to respond effectively, being selected against. It will be interesting to see if the rate of these new entrants increases.” The move from IAG suggests risk-based pricing will extend beyond the earthquake component of cover to flood-related elements. “Flood is not a reinsurance peril for New Zealand, but it is an attritional one,” Drayton points out. “Then there is the issue of rising sea levels and the potential for coastal flooding, which is a major cause for concern. So, the risk-based pricing shift is feeding into climate change discussions too.” A Fundamental Shift Policyholders in risk-exposed areas such as Wellington were almost totally unaware of how much higher their insurance should be based on their property exposure, largely shielded away from the risk reality of earthquakes in recent years. The move to risk-based pricing will change that. “The market shifts we are seeing today pose a multitude of questions and few clear answers” Michael Drayton RMS Drayton agrees that recent developments are opening the eyes of homeowners. “There is a growing realization that New Zealand’s insurance market has operated very differently from other insurance markets and that that is now changing.” One major marketwide development in recent years has been the move from full replacement cover to fixed sums insured in household policies. “This has a lot of people worried they might not be covered,” he explains. “Whereas before, people simply assumed that in the event of a big loss the insurer would cover it all, now they’re slowly realizing it no longer works like that. This will require a lot of policyholder education and will take time.” At a more foundational level, current market dynamics also address the fundamental role of insurance, exposing the conflicted role of the insurer as both a facilitator of risk pooling and a profit-making enterprise. When investment returns outweighed underwriting profit, it appeared as if cross-subsidization wasn’t a big issue. However, current dynamics has meant the operating model is squarely focused on underwriting returns — to favor risk-based pricing. Cross-subsidization is the basis upon which EQC is built, but is it fair? Twenty cents in every NZ$100 (US$66) of home or contents fire insurance premium, up to a maximum of NZ$100,000 insured, is passed on to the EQC. While to date there has been limited government response to risk-based pricing, it is monitoring the situation closely given the broader implications. Looking globally, in an RMS blog, chief research officer Robert Muir-Wood also raises the question whether “flat-rated” schemes, like the French cat nat scheme, will survive now that it has become clear how to use risk models to calculate the wide differentials in the underlying cost of the risk. He asks whether “such schemes are established in the name of ‘solidarity’ or ignorance?” While there is no evidence yet, current developments raise the potential for certain risks to become uninsurable. Increasingly granular data combined with the drive for greater profitability may cause a downward spiral in a market built on a shared burden. Drayton adds: “Potential uninsurability has more to do with land-use planning and building consent regimes, and insurers shouldn’t be paying the price for poor planning decisions. Ironically, earthquake loading codes are very sophisticated and have evolved to recognize the fine gradations in earthquake risk provided by localized data. In fact, they are so refined that structural engineers remark that they are too nuanced and need to be simpler. But if you are building in a high-risk area, it’s not just designing for the hazard, it is also managing the potential financial risk.” He concludes: “The market shifts we are seeing today pose a multitude of questions and few clear answers. However, the only constant running through all these discussions is that they are all data driven.” Making the Move Key to understanding the rationale behind the shift to risk-based pricing is understanding the broader economic context of New Zealand, says Tower CEO Richard Harding. “The New Zealand economy is comparatively small,” he explains, “and we face a range of unique climatic and geological risks. If we don’t plan for and mitigate these risks, there is a chance that reinsurers will charge insurers more or restrict cover. “Before this happens, we need to educate the community, government, councils and regulators, and by moving toward risk-based pricing, we’re putting a signal into the market to drive social change through these organizations. “These signals will help demonstrate to councils and government that more needs to be done to plan for and mitigate natural disasters and climate change.” Harding feels that this risk-based pricing shift is a natural market evolution. “When you look at global trends, this is happening around the world. So, given that we face a number of large risks here in New Zealand, in some respects, it’s surprising it hasn’t happened sooner,” he says. While some parties have raised concerns that there may be a fall in insurance uptake in highly exposed regions, Harding does not believe this will be the case. “For the average home, insurance may be more expensive than it currently is, but it won’t be unattainable,” he states. Moving forward, he says that Tower is working to extend its risk-based pricing approach beyond the earthquake component of its cover, stating that the firm “is actively pursuing risk-based pricing for flood and other natural perils, and over the long term we would expect other insurers to follow in our footsteps.” In terms of the potential wider implications if this occurs, Harding says that such a development would compel government, councils and other organizations to change how they view risk in their planning processes. “I think it will start to drive customers to consider risk more holistically and take this into account when they build and buy homes,” he concludes.
Assigning a Return Period to 2017
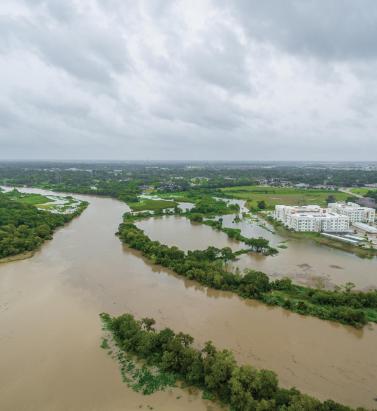
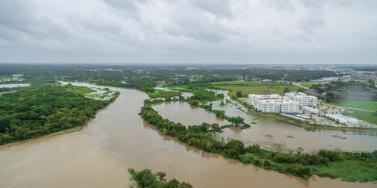
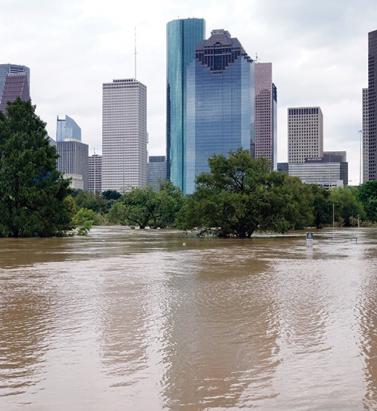
Hurricanes Harvey, Irma and Maria (HIM) tore through the Caribbean and U.S. in 2017, resulting in insured losses over US$80 billion. Twelve years after Hurricanes Katrina, Rita and Wilma (KRW), EXPOSURE asks if the (re)insurance industry was better prepared for its next ‘terrible trio’ and what lessons can be learned In one sense, 2017 was a typical loss year for the insurance industry in that the majority of losses stemmed from the “peak zone” of U.S. hurricanes. However, not since the 2004-05 season had the U.S. witnessed so many landfalling hurricanes. It was the second most costly hurricane season on record for the (re)insurance industry, when losses in 2005 are adjusted for inflation. According to Aon Benfield, HIM caused total losses over US$220 billion and insured losses over US$80 billion — huge sums in the context of global catastrophe losses for the year of US$344 billion and insured losses of US$134 billion. Overall, weather-related catastrophe losses exceeded 0.4 percent of global GDP in 2017 (based on data from Aon Benfield, Munich Re and the World Bank), the second highest figure since 1990. In that period, only 2005 saw a higher relative catastrophe loss at around 0.5 percent of GDP. But, it seems, (re)insurers were much better prepared to absorb major losses this time around. Much has changed in the 12 years since Hurricane Katrina breached the levees in New Orleans. Catastrophe modeling as a profession has evolved into exposure management, models and underlying data have improved and there is a much greater appreciation of model uncertainty and assumptions, explains Alan Godfrey, head of exposure management at Asta. “Even post-2005 people would still see an event occurring, go to the models and pull out a single event ID … then tell all and sundry this is what we’re going to lose. And that’s an enormous misinterpretation of how the models are supposed to be used. In 2017, people demonstrated a much greater maturity and used the models to advise their own loss estimates, and not the other way around.” It also helped that the industry was extremely well-capitalized moving into 2017. After a decade of operating through a low interest rate and increasingly competitive environment, (re)insurers had taken a highly disciplined approach to capital management. Gone are the days where a major event sparked a series of run-offs. While some (re)insurers have reported higher losses than others, all have emerged intact. “In 2017 the industry has performed incredibly well from an operational point of view,” says Godfrey. “There have obviously been challenges from large losses and recovering capital, but those are almost outside of exposure management.” According to Aon Benfield, global reinsurance capacity grew by 80 percent between 1990 and 2017 (to US$605 billion), against global GDP growth of around 24 percent. The influx of capacity from the capital markets into U.S. property catastrophe reinsurance has also brought about change and innovation, offering new instruments such as catastrophe bonds for transferring extreme risks. Harvey broke all U.S. records for tropical cyclone-driven rainfall with observed cumulative rainfall of 51 inches Much of this growth in non-traditional capacity has been facilitated by better data and more sophisticated analytics, along with a healthy appetite for insurance risk from pension funds and other institutional investors. For insurance-linked securities (ILS), the 2017 North Atlantic hurricane season, Mexico’s earthquakes and California’s wildfires were their first big test. “Some thought that once we had a significant year that capital would leave the market,” says John Huff, president and chief executive of the Association of Bermuda Insurers and Reinsurance (ABIR). “And we didn’t see that. “In January 2018 we saw that capital being reloaded,” he continues. “There is abundant capital in all parts of the reinsurance market. Deploying that capital with a reasonable rate of return is, of course, the objective.” Huff thinks the industry performed extremely well in 2017 in spite of the severity of the losses and a few surprises. “I’ve even heard of reinsurers that were ready with claim payments on lower layers before the storm even hit. The modeling and ability to track the weather is getting more sophisticated. We saw some shifting of the storms — Irma was the best example — but reinsurers were tracking that in real time in order to be able to respond.” The Buffalo Bayou River floods a park in Houston after the arrival of Hurricane Harvey How Harvey Inundated Houston One lesson the industry has learned over three decades of modeling is that models are approximations of reality. Each event has its own unique characteristics, some of which fall outside of what is anticipated by the models. The widespread inland flooding that occurred after Hurricane Harvey made landfall on the Texas coastline is an important illustration of this, explains Huff. Even so, he adds, it continued a theme, with flood losses being a major driver of U.S. catastrophe claims for several years now. “What we’re seeing is flood events becoming the No. 1 natural disaster in the U.S. for people who never thought they were at risk of flood.” Harvey broke all U.S. records for tropical cyclone-driven rainfall with observed cumulative rainfall of 51 inches (129 centimeters). The extreme rainfall generated by Harvey and the unprecedented inland flooding across southeastern Texas and parts of southern Louisiana was unusual. However, nobody was overly surprised by the fact that losses from Harvey were largely driven by water versus wind. Prior events with significant storm surge-induced flooding, including Hurricane Katrina and 2012’s Superstorm Sandy, had helped to prepare (re)insurers, exposure managers and modelers for this eventuality. “The events themselves were very large but they were well within uncertainty ranges and not disproportionate to expectations,” says Godfrey. “Harvey is a new data point — and we don’t have that many — so the scientists will look at it and know that any new data point will lead to tweaks,” he continues. “If anything, it will make people spend a bit more time on their calibration for the non-modeled elements of hurricane losses, and some may conclude that big changes are needed to their own adjustments.” But, he adds: “Nobody is surprised by the fact that flooding post-hurricane causes loss. We know that now. It’s more a case of tweaking and calibrating, which we will be doing for the rest of our lives.” Flood Modeling Hurricane Harvey also underscored the importance of the investment in sophisticated, probabilistic flood models. RMS ran its U.S. Inland Flood HD Model in real time to estimate expected flood losses. “When Hurricane Harvey happened, we had already simulated losses of that magnitude in our flood model, even before the event occurred,” says Dr. Pete Dailey, vice president of product management and responsible for U.S. flood modeling at RMS. “The value of the model is to be able to anticipate extreme tail events well before they occur, so that insurance companies can be prepared in advance for the kind of risk they’re taking on and what potential claims volume they may have after a major event,” he adds. Does this mean that a US$100 billion-plus loss year like 2017 is now a 1-in-6-year event? Harvey has already offered a wealth of new data that will be fed into the flood model. The emergency shutdown of the Houston metropolitan area prevented RMS meteorologists and engineers from accessing the scene in the immediate aftermath, explains Dailey. However, once on the ground they gathered as much information as they could, observing and recording what had actually happened to affected properties. “We go to individual properties to assess the damage visually, record the latitude and longitude of the property, the street address, the construction, occupancy and the number of stories,” he says. “We will also make an estimate of the age of the property. Those basic parameters allow us to go back and take a look at what the model would have predicted in terms of damage and loss, as compared to what we observed.” The fact that insured losses emanating from the flooding were only a fraction of the total economic losses is an inevitable discussion point. The majority of claims paid were for commercial properties, with residential properties falling under the remit of the National Flood Insurance Program (NFIP). Many residential homes were uninsured, however, explains ABIR’s Huff. “The NFIP covers just the smallest amount of people — there are only five million policies — and yet you see a substantial event like Harvey which is largely uninsured because (re)insurance companies only cover commercial flood in the U.S.,” he says. “After Harvey you’ll see a realization that the private market is very well-equipped to get back into the private flood business, and there’s a national dialogue going on now.” Is 2017 the New Normal? One question being asked in the aftermath of the 2017 hurricane season is: What is the return period for a loss year like 2017? RMS estimates that, in terms of U.S. and Caribbean industry insured wind, storm surge and flood losses, the 2017 hurricane season corresponds to a return period between 15 and 30 years. However, losses on the scale of 2017 occur more frequently when considering global perils. Adjusted for inflation, it is seven years since the industry paid out a similar level of catastrophe claims — US$110 billion on the Tohoku earthquake and tsunami, Thai floods and New Zealand earthquake in 2011. Six years prior to that, KRW cost the industry in excess of US$75 billion (well over US$100 billion in today’s money). So, does this mean that a US$100 billion-plus (or equivalent in inflation-adjusted terms) loss year like 2017 is now a one-in-six-year event? As wealth and insurance penetration grows in developing parts of the world, will we begin to see more loss years like 2011, where catastrophe claims are not necessarily driven by the U.S. or Japan peak zones? “Increased insurance penetration does mean that on the whole losses will increase, but hopefully this is proportional to the premiums and capital that we are getting in,” says Asta’s Godfray. “The important thing is understanding correlations and how diversification actually works and making sure that is applied within business models. “In the past, people were able to get away with focusing on the world in a relatively binary fashion,” he continues. “The more people move toward diversified books of business, which is excellent for efficient use of capital, the more important it becomes to understand the correlations between different regions.” “You could imagine in the future, a (re)insurer making a mistake with a very sophisticated set of catastrophe and actuarial models,” he adds. “They may perfectly take into account all of the non-modeled elements but get the correlations between them all wrong, ending up with another year like 2011 where the losses across the globe are evenly split, affecting them far more than their models had predicted.” As macro trends including population growth, increasing wealth, climate change and urbanization influence likely losses from natural catastrophes, could this mean a shorter return period for years like last year, where industry losses exceeded US$134 billion? “When we look at the average value of properties along the U.S. coastline — the Gulf Coast and East Coast — there’s a noticeable trend of increasing value at risk,” says Dailey. “That is because people are building in places that are at risk of wind damage from hurricanes and coastal flooding. And these properties are of a higher value because they are more complex, have a larger square footage and have more stories. Which all leads to a higher total insured value. “The second trend that we see would be from climate change whereby the storms that produce damage along the coastline may be increasing in frequency and intensity,” he continues. “That’s a more difficult question to get a handle on but there’s a building consensus that while the frequency of hurricane landfalls may not necessarily be increasing, those that do make landfall are increasing in intensity.” Lloyd’s chief executive Inga Beale has stated her concerns about the impact of climate change, following the market’s £4.5 billion catastrophe claims bill for 2017. “That’s a significant number, more than double 2016; we’re seeing the impact of climate change to a certain extent, particularly on these weather losses, with the rising sea level that impacts and increases the amount of loss,” she said in an interview with Bloomberg. While a warming climate is expected to have significant implications for the level of losses arising from storms and other severe weather events, it is not yet clear exactly how this will manifest, according to Tom Sabbatelli, senior product manager at RMS. “We know the waters have risen several centimeters in the last couple of decades and we can use catastrophe models to quantify what sort of impact that has on coastal flooding, but it’s also unclear what that necessarily means for tropical cyclone strength. “The oceans may be warming, but there’s still an ongoing debate about how that translates into cyclone intensity, and that’s been going on for a long time,” he continues. “The reason for that is we just don’t know until we have the benefit of hindsight. We haven’t had a number of major hurricanes in the last few years, so does that mean that the current climate is quiet in the Atlantic? Is 2017 an anomaly or are we going back to more regular severe activity? It’s not until you’re ten or 20 years down the line and you look back that you know for sure.”
