


EXPOSURE
The RMS Magazine with a unique perspective and clear mission “... to provide insight and analysis to help insurance and risk professionals innovate, adapt, and deliver.”

Insurance: The next 10 years
Mohsen Rahnama, Cihan Biyikoglu and Moe Khosravy of RMS look to 2029, consider the…
Times Square, New York City
Reset Filters
Innovation
- 2022
- 2021
- 2020
- 2019
- 2018
- 2017
- 2016

RMS HWind Hurricane Forecasting and Response and ExposureIQ: Exposure Management Without the Grind
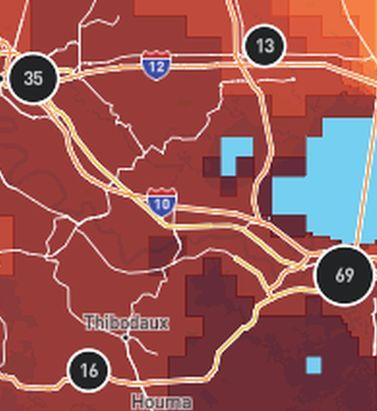
Accessing data in real-time to assess and manage an insurance carrier’s potential liabilities from a loss event remains the holy grail for exposure management teams and is high on a business’ overall wish list A 2021 PwC Pulse Survey of U.S. risk management leaders found that risk executives are increasingly taking advantage of “tech solutions for real-time and automated processes, including dynamic risk monitoring (30 percent), new risk management tech solutions (25 percent), data analytics (24 percent) [and] integrated risk management tools on a single platform (19 percent)”. PwC suggested that as part of an organization’s wider digital and business transformation process, risk management teams should therefore: “use technologies that work together, draw on common data sources, build enterprise-wide analytics and define common sets of metrics.” Separately, Deloitte’s 2021 third-party risk management (TPRM) survey found that 53 percent of respondents across a range of industry sectors wanted to improve real-time information, risk metrics, and reporting in their organizations. With the pandemic providing the unlikely backdrop for driving innovation across the business world, the Deloitte survey explained the statistic with the suggestion that one impact of COVID-19 “has been a greater need for real-time continuous assessment and alerts, rather than traditional point-in-time third-party assessment.” Event Forecasting and Response with HWind and ExposureIQ Natural catastrophe events are a risk analytics flash point. And while growing board-level awareness of the importance of real-time reporting might seem like a positive, without marrying the data with the right tools to gather and process that data, together with a more integrated approach to risk management and modeling functions, the pain points for exposure managers on the event frontline, are unlikely to be relieved. RMS® ExposureIQ™ is an exposure management application available on the cloud-native RMS Intelligent Risk Platform™, which enables clients to centralize exposure data, process it, write direct reports and then run deterministic scenarios to quickly and accurately assess their exposure. When an event is threatening or impacts risks, an exposure management team needs to rapidly process the available data to work out their overall exposure and the likely effect on insured assets. The integration of event response data such as HWind into the ExposureIQ application is where the acquisition of this hazard data really starts to make a difference. The 2022 North Atlantic hurricane season, for example, is upon us, and access to regular, real-time data is relied upon as a crucial part of event response to tropical cyclones. With reliable event response analytics, updated in real-time, businesses can get fully prepared and ensure solvency through additional reinsurance cover, more accurately reserve funds, and confidently communicate risk to all stakeholders. The National Oceanic and Atmospheric Administration’s (NOAA) National Hurricane Center (NHC) has long been viewed as a valuable resource for forecasts on the expected track and severity of hurricanes. However, according to Callum Higgins, product manager, global climate, at RMS, “There are some limitations with what you get [from the NHC]. Forecasts lack detailed insights into the spatial variability of hazard severity and while uncertainty is accounted for, this is based on historical data rather than the forecast uncertainty specific to the storm. Hurricane Henri in 2021 was a good example of this. While the ultimate landfall location fell outside the NHC ‘cone of uncertainty’ four days in advance of landfall, given the large model uncertainty in the track for Henri, HWind forecasts were able to account for this possibility.” Introducing HWind RMS HWind provides observation-based tropical cyclone data for both real-time and historical events and was originally developed as a data service for the NHC by renowned meteorologist Dr. Mark Powell. It combines the widest set of observations for a particular storm in order to create the most accurate representation of its wind field. Since RMS acquired HWind in 2015, it has continually evolved as a solution that can be leveraged more easily by insurers to benefit individual use cases. HWind provides snapshots (instantaneous views of the storm’s wind field) and cumulative footprints (past swaths of the maximum wind speeds) every six hours. In addition, RMS delivers hurricane forecast data that includes a series of forecast scenarios of both the wind and surge hazard, enabling users to understand the potential severity of the event up to five days in advance of landfall. “Because HWind real-time products are released up to every six hours, you can adapt your response as forecasts shift. After an event has struck you very quickly get a good view of which areas have been impacted and to what level of severity,” explains Higgins. The level of detail is another key differentiator. In contrast to the NHC forecasts, which do not include a detailed wind field, HWind provides much more data granularity, with forecast wind and surge scenarios developed by leveraging the RMS North Atlantic Hurricane Models. Snapshots and cumulative footprints, meanwhile, represent the wind field on a 1x1 kilometer grid. And while the NHC does provide uncertainty metrics in its forecasts, such as the “cone of uncertainty” around where the center of the storm will track, these are typically based on historical statistics. “HWind accounts for the actual level of model convergence for a particular storm. That provides you with the insights you need to make decisions around how much confidence to place in each forecast, including whether a more conservative approach is required in cases of heightened uncertainty,” Higgins explains. HWind’s observational approach and access to more than 30 data sources, some of which are exclusive to RMS, means users are better able to capture a particular wind field and apply that data across a wide variety of use cases. Some HWind clients – most notably, Swiss Re – also use it as a trigger for parametric insurance policies. “That’s a critical component for some of our clients,” says Higgins. “For a parametric trigger, you want to make sure you have as accurate as possible a view of the wind speed experienced at underwritten locations when a hurricane strikes.” Real-time data is only one part of the picture. The HWind Enhanced Archive is a catalog of data – including high-resolution images, snapshots, and footprints from historical hurricanes extending back almost 30 years that can be used to validate historical claims and loss experience. “When we're creating forecasts in real-time, we only have the information of what has come before [in that particular storm],” says Higgins. “With the archive, we can take advantage of the data that comes in after we produce the snapshots and use all of that to produce an enhanced archive to improve what we do in real-time.” Taking the Stress out of Event Response “Event response is quite a stressful time for the insurance industry, because they've got to make business decisions based around what their losses could be,” Higgins adds. “At the time of these live events, there's always increased scrutiny around their exposure and reporting.” HWind has plugged the gap in the market for a tool that can provide earlier, more frequent, and more detailed insights into the potential impact of a hurricane before, during, and following landfall. “The key reason for having HWind available with ExposureIQ is to have it all in one place,” explains Higgins. “There are many different sources of information out there, and during a live event the last thing you want to do is be scrambling across websites trying to see who's released what and then pull it across to your environment, so you can overlay it on your live portfolio of risks. As soon as we release the accumulation footprints, they are uploaded directly into the application, making it faster and more convenient for users to generate an understanding of potential loss for their specific portfolios." RMS applications such as ExposureIQ, and the modeling application Risk Modeler™, all use the same cloud-native Intelligent Risk Platform. This allows for a continuous workflow, allowing users to generate both accumulation analytics as well as modeled losses from the same set of exposure data. During an event, for example, with the seven hurricane scenarios that form part of the HWind data flow, the detailed wind fields and tracks (see Figure below) and the storm surge footprints for each scenario can be viewed on the ExposureIQ application for clients to run accumulations against. The application has a robust integrated mapping service that allows users to view their losses and hot spots on a map, and it also includes the functionality to switch to see the same data distributed in loss tables if that is preferred. “Now that we have both those on view in the cloud, you can overlay the footprint files on top of your exposures, and quickly see it before you even run [the accumulations],” says Higgins. Figure 1: RMS HWind forecast probability of peak gusts greater than 80 miles per hour from Hurricane Ida at 1200UTC August 29, 2021, overlaid on exposure data within the RMS ExposureIQ applicationOne-Stop-Shop This close interaction between HWind and the ExposureIQ application indicates another advantage of the RMS product suite – the use of consistent event response data across the platform so exposure mapping and modeling are all in one place. “The idea is that by having it on the cloud, it is much more performant; you can analyze online portfolios a lot more quickly, and you can get those reports to your board a lot faster than previously,” says Higgins. In contrast to other solutions in the market, which typically use third-party hazard tools and modeling platforms, the RMS suite has a consistent model methodology flowing through the entire product chain. “That's really where the sweet spot of ExposureIQ is – this is all one connected ecosystem,” commented Higgins. “I get my data into ExposureIQ and it is in the same format as Risk Modeler, so I don't need to convert anything. Both products use a consistent financial model too – so you are confident the underlying policy and reinsurance terms are being applied in the same way.” The modular nature of the RMS application ecosystem means that, in addition to hurricane risks, data on perils such as floods, earthquakes, and wildfires are also available – and then processed by the relevant risk modeling tool to give clients insights on their potential losses. “With that indication of where you might expect to experience claims, and how severe those claims might be, you can start to reach out to policyholders to understand if they've been affected.” At this point, clients are then in a good position to start building their claims deployment strategy, preparing claims adjusters to visit impacted sites and briefing reserving and other teams on when to start processing payments. But even before a hurricane has made landfall, clients can make use of forecast wind fields to identify locations that might be affected in advance of the storm and warn policyholders to prepare accordingly. “That can not only help policyholders to protect their property but also mitigate insurance losses as well,” says Higgins. “Similarly, you can use it to apply an underwriting moratorium in advance of a storm. Identify areas that are likely to be impacted, and then feed that into underwriting processes to ensure that no one can write a policy in the region when a storm is approaching.” The First Unified Risk Modeling Platform Previously, before moving to an integrated, cloud-based platform, these tools would likely have been hosted using on-premises servers with all the significant infrastructure costs that implies. Now, in addition to accessing a full suite of products via a single cloud-native platform, RMS clients can also leverage the company’s three decades of modeling expertise, benefiting from a strong foundation of trusted exposure data to help manage their exposures. “A key goal for a lot of people responding to events is initially to understand what locations are affected, how severely they're affected, and what their total exposed limit is, and to inform things like deploying claims adjusters,” says Higgins. And beyond the exposure management function, argues Higgins, it’s about gearing up for the potential pain of those claims, the processes that go around that, and the communication to the board. “These catastrophic events can have a significant impact on a company’s revenue, and the full implications – and any potential mitigation – needs to be well understood.” Find out more about the award-winning ExposureIQ.


The Data Driving Wildfire Exposure Reduction
Recent research by RMS® in collaboration with the CIPR and IBHS is helping move the dial on wildfire risk assessment, providing a benefit-cost analysis of science-based mitigation strategies The significant increase in the impact of wildfire activity in North America in the last four years has sparked an evolving insurance problem. Across California, for example, 235,250 homeowners’ insurance policies faced non-renewal in 2019, an increase of 31 percent over the previous year. In addition, areas of moderate to very-high risk saw a 61 percent increase – narrow that to the top 10 counties and the non-renewal rate exceeded 200 percent. A consequence of this insurance availability and affordability emergency is that many residents have sought refuge in the California FAIR (Fair Access to Insurance Requirements) Plan, a statewide insurance pool that provides wildfire cover for dwellings and commercial properties. In recent years, the surge in wildfire events has driven a huge rise in people purchasing cover via the plan, with numbers more than doubling in highly exposed areas. In November 2020, in an effort to temporarily help the private insurance market and alleviate pressure on the FAIR Plan, California Insurance Commissioner Ricardo Lara took the extraordinary step of introducing a mandatory one-year moratorium on insurance companies non-renewing or canceling residential property insurance policies. The move was designed to help the 18 percent of California’s residential insurance market affected by the record 2020 wildfire season. The Challenge of Finding an Exit “The FAIR Plan was only ever designed as a temporary landing spot for those struggling to find fire-related insurance cover, with homeowners ultimately expected to shift back into the private market after a period of time,” explains Jeff Czajkowski, director of the Center for Insurance Policy and Research (CIPR) at the National Association of Insurance Commissioners. “The challenge that they have now, however, is that the lack of affordable cover means for many of those who enter the plan there is potentially no real exit strategy.” The FAIR Plan was only ever designed as a temporary landing spot for those struggling to find fire-related insurance cover, with homeowners ultimately expected to shift back into the private market after a period of time. The challenge that they have now, however, is that the lack of affordable cover means for many of those who enter the plan there is potentially no real exit strategy. Jeff Czajkowski, director of the Center for Insurance Policy and Research (CIPR) at the National Association of Insurance Commissioners These concerns are echoed by Matt Nielsen, senior director of global governmental and regulatory affairs at RMS. “Eventually you run into similar problems to those experienced in Florida when they sought to address the issue of hurricane cover. You simply end up with so many policies within the plan that you have to reassess the risk transfer mechanism itself and look at who is actually paying for it.” The most expedient way to develop an exit strategy is to reduce wildfire exposure levels, which in turn will stimulate activity in the private insurance market and lead to the improved availability and affordability of cover in exposed regions. Yet therein lies the challenge. There is a fundamental stumbling block to this endeavor unique to California’s insurance market and enshrined in regulation. California Code of Regulations, Article 4 – Determination of Reasonable Rates, §2644.5 – Catastrophe Adjustment: “In those insurance lines and coverages where catastrophes occur, the catastrophic losses of any one accident year in the recorded period are replaced by a loading based on a multi-year, long-term average of catastrophe claims. The number of years over which the average shall be calculated shall be at least 20 years for homeowners’ multiple peril fire. …” In effect, this regulation prevents the use of predictive modeling, the mainstay of exposure assessment and accurate insurance pricing, and limits the scope of applicable data to the last 20 years. That might be acceptable if wildfire constituted a relatively stable exposure and if all aspects of the risk could be effectively captured in a period of two decades – but as the last few years have demonstrated, that is clearly not the case. As Roy Wright, president and CEO of the Insurance Institute for Business & Home Safety (IBHS), states: “Simply looking back might be interesting, but is it relevant? I don’t mean that the data gathered over the last 20 years is irrelevant, but on its own it is insufficient to understand and get ahead of wildfire risk, particularly when you apply the last four years to the 20-year retrospective, which have significantly skewed the market. That is when catastrophe models provide the analytical means to rationalize such deviations and to anticipate how this threat might evolve.” Simply looking back might be interesting, but is it relevant? I don’t mean that the data gathered over the last 20 years is irrelevant, but on its own it is insufficient to understand and get ahead of wildfire risk, particularly when you apply the last four years to the 20-year retrospective, which have significantly skewed the market. Roy Wright, president and CEO, Insurance Institute for Business & Home Safety (IBHS) The insurance industry has long viewed wildfire as an attritional risk, but such a perspective is no longer valid, believes Michael Young, senior director of product management at RMS. “It is only in the last five years that we are starting to see wildfire damaging thousands of buildings in a single event,” he says. “We are reaching the level where the technology associated with cat modeling has become critical because without that analysis you can’t predict future trends. The significant increase in related losses means that it has the potential to be a solvency-impacting peril as well as a rate-impacting one.” Addressing the Insurance Equation “Wildfire by its nature is a hyper-localized peril, which makes accurate assessment very data dependent,” Young continues. “Yet historically, insurers have relied upon wildfire risk scores to guide renewal decisions or to write new business in the wildland-urban interface (WUI). Such approaches often rely on zip-code-level data, which does not factor in environmental, community or structure-level mitigation measures. That lack of ground-level data to inform underwriting decisions means, often, non-renewal is the only feasible approach in highly exposed areas for insurers.” California is unique as it is the only U.S. state to stipulate that predictive modeling cannot be applied to insurance rate adjustments. However, this limitation is currently coming under significant scrutiny from all angles. In recent months, the California Department of Insurance has convened two separate investigatory hearings to address areas including: Insurance availability and affordability Need for consistent home-hardening standards and insurance incentives for mitigation Lack of transparency from insurers on wildfire risk scores and rate justification In support of efforts to demonstrate the need for a more data-driven, model-based approach to stimulating a healthy private insurance market, the CIPR, in conjunction with IBHS and RMS, has worked to facilitate greater collaboration between regulators, the scientific community and risk modelers in an effort to raise awareness of the value that catastrophe models can bring. “The Department of Insurance and all other stakeholders recognize that until we can create a well-functioning insurance market for wildfire risk, there will be no winners,” says Czajkowski. “That is why we are working as a conduit to bring all parties to the table to facilitate productive dialogue. A key part of this process is raising awareness on the part of the regulator both around the methodology and depth of science and data that underpins the cat model outputs.” In November 2020, as part of this process, CIPR, RMS and IBHS co-produced a report entitled “Application of Wildfire Mitigation to Insured Property Exposure.” “The aim of the report is to demonstrate the ability of cat models to reflect structure-specific and community-level mitigation measures,” Czajkowski continues, “based on the mitigation recommendations of IBHS and the National Fire Protection Association’s Firewise USA recognition program. It details the model outputs showing the benefits of these mitigation activities for multiple locations across California, Oregon and Colorado. Based on that data, we also produced a basic benefit-cost analysis of these measures to illustrate the potential economic viability of home-hardening measures.” Applying the Hard Science The study aims to demonstrate that learnings from building science research can be reflected in a catastrophe model framework and proactively inform decision-making around the reduction of wildfire risk for residential homeowners in wildfire zones. As Wright explains, the hard science that IBHS has developed around wildfire is critical to any model-based mitigation drive. “For any model to be successful, it needs to be based on the physical science. In the case of wildfire, for example, our research has shown that flame-driven ignitions account for approximately only a small portion of losses, while the vast majority are ember-driven. “Our facilities at IBHS enable us to conduct full-scale testing using single- and multi-story buildings, assessing components that influence exposure such as roofing materials, vents, decks and fences, so we can generate hard data on the various impacts of flame, ember, smoke and radiant heat. We can provide the physical science that is needed to analyze secondary and tertiary modifiers—factors that drive so much of the output generated by the models.” Our facilities at IBHS enable us to conduct full-scale testing using single- and multi-story buildings, assessing components that influence exposure such as roofing materials, vents, decks and fences, so we can generate hard data on the various impacts of flame, ember, smoke and radiant heat. Roy Wright, president and CEO, Insurance Institute for Business & Home Safety (IBHS) To quantify the benefits of various mitigation features, the report used the RMS® U.S. Wildfire HD Model to quantify hypothetical loss reduction benefits in nine communities across California, Colorado and Oregon. The simulated reductions in losses were compared to the costs associated with the mitigation measures, while a benefit-cost methodology was applied to assess the economic effectiveness of the two overall mitigation strategies modeled: structural mitigation and vegetation management. The multitude of factors that influence the survivability of a structure exposed to wildfire, including the site hazard parameters and structural characteristics of the property, were assessed in the model for 1,161 locations across the communities, three in each state. Each structure was assigned a set of primary characteristics based on a series of assumptions. For each property, RMS performed five separate mitigation case runs of the model, adjusting the vulnerability curves based on specific site hazard and secondary modifier model selections. This produced a neutral setting with all secondary modifiers set to zero—no penalty or credit applied—plus two structural mitigation scenarios and two vegetation management scenarios combined with the structural mitigation. The Direct Value of Mitigation Given the scale of the report, although relatively small in terms of the overall scope of wildfire losses, it is only possible to provide a snapshot of some of the key findings. The full report is available to download. Focusing on the three communities in California—Upper Deerwood (high risk), Berry Creek (high risk) and Oroville (medium risk)—the neutral setting produced an average annual loss (AAL) per structure of $3,169, $637 and $35, respectively. Figure 1: Financial impact of adjusting the secondary modifiers to produce both a structural (STR) credit and penaltyFigure 1 shows the impact of adjusting the secondary modifiers to produce a structural (STR) maximum credit (i.e., a well-built, wildfire-resistant structure) and a structural maximum penalty (i.e., a poorly built structure with limited resistance). In the case of Upper Deerwood, the applied credit saw an average reduction of $899 (i.e., wildfire-avoided losses) compared to the neutral setting, while conversely the penalty increased the AAL on average $2,409. For Berry Creek, the figures were a reduction of $222 and an increase of $633. And for Oroville, which had a relatively low neutral setting, the average reduction was $26. Figure 2: Financial analysis of the mean AAL difference for structural (STR) and vegetation (VEG) credit and penalty scenariosIn Figure 2 above, analyzing the mean AAL difference for structural and vegetation (VEG) credit and penalty scenarios revealed a reduction of $2,018 in Upper Deerwood and an increase of $2,511. The data, therefore, showed that moving from a poorly built to well-built structure on average reduced wildfire expected losses by $4,529. For Berry Creek, this shift resulted in an average savings of $1,092, while for Oroville there was no meaningful difference. The authors then applied three cost scenarios based on a range of wildfire mitigation costs: low ($20,000 structural, $25,000 structural and vegetation); medium ($40,000 structural, $50,000 structural and vegetation); and high ($60,000 structural, $75,000 structural and vegetation). Focusing again on the findings for California, the model outputs showed that in the low-cost scenario (and 1 percent discount rate) for 10-, 25- and 50-year time horizons, both structural only as well as structural and vegetation wildfire mitigation were economically efficient on average in the Upper Deerwood, California, community. For Berry Creek, California, economic efficiency for structural mitigation was achieved on average in the 50-year time horizon and in the 25- and 50-year time horizons for structural and vegetation mitigation. Moving the Needle Forward As Young recognizes, the scope of the report is insufficient to provide the depth of data necessary to drive a market shift, but it is valuable in the context of ongoing dialogue. “This report is essentially a teaser to show that based on modeled data, the potential exists to reduce wildfire risk by adopting mitigation strategies in a way that is economically viable for all parties,” he says. “The key aspect about introducing mitigation appropriately in the context of insurance is to allow the right differential of rate. It is to give the right signals without allowing that differential to restrict the availability of insurance by pricing people out of the market.” That ability to differentiate at the localized level will be critical to ending what he describes as the “peanut butter” approach—spreading the risk—and reducing the need to adopt a non-renewal strategy for highly exposed areas. “You have to be able to operate at a much more granular level,” he explains, “both spatially and in terms of the attributes of the structure, given the hyperlocalized nature of the wildfire peril. Risk-based pricing at the individual location level will see a shift away from the peanut-butter approach and reduce the need for widespread non-renewals. You need to be able to factor in not only the physical attributes, but also the actions by the homeowner to reduce their risk. Risk-based pricing at the individual location level will see a shift away from the peanut-butter approach and reduce the need for widespread non-renewals. You need to be able to factor in not only the physical attributes, but also the actions by the homeowner to reduce their risk. Michael Young, senior director of product management at RMS “It is imperative we create an environment in which mitigation measures are acknowledged, that the right incentives are applied and that credit is given for steps taken by the property owner and the community. But to reach that point, you must start with the modeled output. Without that analysis based on detailed, scientific data to guide the decision-making process, it will be incredibly difficult for the market to move forward.” As Czajkowski concludes: “There is no doubt that more research is absolutely needed at a more granular level across a wider playing field to fully demonstrate the value of these risk mitigation measures. However, what this report does is provide a solid foundation upon which to stimulate further dialogue and provide the momentum for the continuation of the critical data-driven work that is required to help reduce exposure to wildfire.”
Data From the Ashes
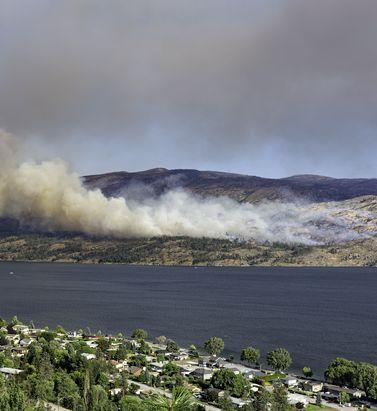
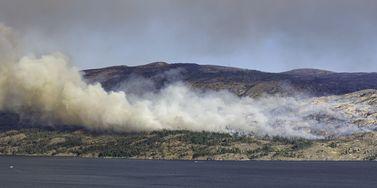
Five years on from the wildfire that devastated Fort McMurray, the event has proved critical to developing a much deeper understanding of wildfire losses in Canada In May 2016, Fort McMurray, Alberta, became the location of Canada’s costliest wildfire event to date. In total, some 2,400 structures were destroyed by the fire, with a similar number designated as uninhabitable. Fortunately, the evacuation of the 90,000-strong population meant that no lives were lost as a direct result of the fires. From an insurance perspective, the estimated CA$4 billion loss elevated wildfire risk to a whole new level. This was a figure now comparable to the extreme fire losses experienced in wildfire-exposed regions such as California, and established wildfire as a peak natural peril second only to flood in Canada. However, the event also exposed gaps in the market’s understanding of wildfire events and highlighted the lack of actionable exposure data. In the U.S., significant investment had been made in enhancing the scale and granularity of publicly available wildfire data through bodies such as the United States Geological Survey, but the resolution of data available through equivalent parties in Canada was not at the same standard. A Question of Scale Making direct wildfire comparisons between the U.S. and Canada is difficult for multiple reasons. Take, for example, population density. Canada’s total population is approximately 37.6 million, spread over a landmass of 9,985 million square kilometers (3,855 million square miles), while California has a population of around 39.5 million, inhabiting an area of 423,970 square kilometers (163,668 square miles). The potential for wildfire events impacting populated areas is therefore significantly less in Canada. In fact, in the event of a wildfire in Canada—due to the reduced potential exposure—fires are typically allowed to burn for longer and over a wider area, whereas in the U.S. there is a significant focus on fire suppression. This willingness to let fires burn has the benefit of reducing levels of vegetation and fuel buildup. Also, more fires in the country are a result of natural rather than human-caused ignitions and occur in hard-to-access areas with low population exposure. Sixty percent of fires in Canada are attributed to human causes. The challenge for the insurance industry in Canada is therefore more about measuring the potential impact of wildfire on smaller pockets of exposure Michael Young, senior director, product management, at RMS But as Fort McMurray showed, the potential for disaster clearly exists. In fact, the event was one of a series of large-scale fires in recent years that have impacted populated areas in Canada, including the Okanagan Mountain Fire, the McLure Fire, the Slave Lake Fire, and the Williams Lake and Elephant Hills Fire. “The challenge for the insurance industry in Canada,” explains Michael Young, senior director, product management, at RMS, “is therefore more about measuring the potential impact of wildfire on smaller pockets of exposure, rather than the same issues of frequency and severity of event that are prevalent in the U.S.” Regions at Risk What is interesting to note is just how much of the populated territories are potentially exposed to wildfire events in Canada, despite a relatively low population density overall. A 2017 report entitled Mapping Canadian Wildland Fire Interface Areas, published by the Canadian Forest Service, stated that the threat of wildfire impacting populated areas will inevitably increase as a result of the combined impacts of climate change and the development of more interface area “due to changes in human land use.” This includes urban and rural growth, the establishment of new industrial facilities and the building of more second homes. According to the study, the wildland-human interface in Canada spans 116.5 million hectares (288 million acres), which is 13.8 percent of the country’s total land area or 20.7 percent of its total wildland fuel area. In terms of the wildland-urban interface (WUI), this covers 32.3 million hectares (79.8 million acres), which is 3.8 percent of land area or 5.8 percent of fuel area. The WUI for industrial areas (known as WUI-Ind) covers 10.5 million hectares (25.9 million acres), which is 1.3 percent of land area or 1.9 percent of fuel area. In terms of the provinces and territories with the largest interface areas, the report highlighted Quebec, Alberta, Ontario and British Columbia as being most exposed. At a more granular level, it stated that in populated areas such as cities, towns and settlements, 96 percent of locations had “at least some WUI within a five-kilometer buffer,” while 60 percent also had over 500 hectares (1,200 acres) of WUI within a five-kilometer buffer (327 of the total 544 areas). Data: A Closer Look Fort McMurray has, in some ways, become an epicenter for the generation of wildfire-related data in Canada. According to a study by the Institute for Catastrophic Loss Reduction, which looked at why certain homes survived, the Fort McMurray Wildfire “followed a well-recognized pattern known as the wildland/urban interface disaster sequence.” The detailed study, which was conducted in the aftermath of the disaster, showed that 90 percent of properties in the areas affected by the wildfire survived the event. Further, “surviving homes were generally rated with ‘Low’ to ‘Moderate’ hazard levels and exhibited many of the attributes promoted by recommended FireSmart Canada guidelines.” FireSmart Canada is an organization designed to promote greater wildfire resilience across the country. Similar to FireWise in the U.S., it has created a series of hazard factors spanning aspects such as building structure, vegetation/fuel, topography and ignition sites. It also offers a hazard assessment system that considers hazard layers and adoption rates of resilience measures. According to the study: “Tabulation by hazard level shows that 94 percent of paired comparisons of all urban and country residential situations rated as having either ‘Low’ or ‘Moderate’ hazard levels survived the wildfire. Collectively, vegetation/fuel conditions accounted for 49 percent of the total hazard rating at homes that survived and 62 percent of total hazard at homes that failed to survive.” Accessing the Data In many ways, the findings of the Fort McMurray study are reassuring, as they clearly demonstrate the positive impact of structural and topographical risk mitigation measures in enhancing wildfire resilience—essentially proving the underlying scientific data. Further, the data shows that “a strong, positive correlation exists between home destruction during wildfire events and untreated vegetation within 30 meters of homes.” “What the level of survivability in Fort McMurray showed was just how important structural hardening is,” Young explains. “It is not simply about defensible space, managing vegetation and ensuring sufficient distance from the WUI. These are clearly critical components of wildfire resilience, but by factoring in structural mitigation measures you greatly increase levels of survivability, even during urban conflagration events as extreme as Fort McMurray.” What the level of survivability in Fort McMurray showed was just how important structural hardening is Michael Young, senior director, product management, RMS From an insurance perspective, access to these combined datasets is vital to effective exposure analysis and portfolio management. There is a concerted drive on the part of the Canadian insurance industry to adopt a more data-intensive approach to managing wildfire exposure. Enhancing data availability across the region has been a key focus at RMS® in recent years, and efforts have culminated in the launch of the RMS® Canada Wildfire HD Model. It offers the most complete view of the country’s wildfire risk currently available and is the only probabilistic model available to the market that covers all 10 provinces. “The hazard framework that the model is built on spans all of the critical wildfire components, including landscape and fire behavior patterns, fire weather simulations, fire and smoke spread, urban conflagration and ember intensity,” says Young. “In each instance, the hazard component has been precisely calibrated to reflect the dynamics, assumptions and practices that are specific to Canada. “For example, the model’s fire spread component has been adjusted to reflect the fact that fires tend to burn for longer and over a wider area in the country, which reflects the watching brief that is often applied to managing wildfire events, as opposed to the more suppression-focused approach in the U.S.,” he continues. “Also, the urban conflagration component helps insurers address the issue of extreme tail-risk events such as Fort McMurray.” Another key model differentiator is the wildfire vulnerability function, which automatically determines key risk parameters based on high-resolution data. In fact, RMS has put considerable efforts into building out the underlying datasets by blending multiple different information sources to generate fire, smoke and ember footprints at 50-meter resolution, as opposed to the standard 250-meter resolution of the publicly available data. Critical site hazard data such as slope, distance to vegetation, and fuel types can be set against primary building modifiers such as construction, number of stories and year built. A further secondary modifier layer enables insurers to apply building-specific mitigation measures such as roof characteristics, ember accumulators and whether the property has cladding or a deck. Given the influence of such components on building survivability during the Fort McMurray Fire, such data is vital to exposure analysis at the local level. A Changing Market “The market has long recognized that greater data resolution is vital to adopting a more sophisticated approach to wildfire risk,” Young says. “As we worked to develop this new model, it was clear from our discussions with clients that there was an unmet need to have access to hard data that they could ‘hang numbers from.’ There was simply too little data to enable insurers to address issues such as potential return periods, accumulation risk and countrywide portfolio management.” The ability to access more granular data might also be well timed in response to a growing shift in the information required during the insurance process. There is a concerted effort taking place across the Canadian insurance market to reduce the information burden on policyholders during the submission process. At the same time, there is a shift toward risk-based pricing. “As we see this dynamic evolve,” Young says, “the reduced amount of risk information sourced from the insured will place greater importance on the need to apply modeled data to how insurance companies manage and price risk accurately. Companies are also increasingly looking at the potential to adopt risk-based pricing, a process that is dependent on the ability to apply exposure analysis at the individual location level. So, it is clear from the coming together of these multiple market shifts that access to granular data is more important to the Canadian wildfire market than ever.”


Location, Location, Location: A New Era in Data Resolution
The insurance industry has reached a transformational point in its ability to accurately understand the details of exposure at risk. It is the point at which three fundamental components of exposure management are coming together to enable (re)insurers to systematically quantify risk at the location level: the availability of high-resolution location data, access to the technology to capture that data and advances in modeling capabilities to use that data. Data resolution at the individual building level has increased considerably in recent years, including the use of detailed satellite imagery, while advances in data sourcing technology have provided companies with easier access to this more granular information. In parallel, the evolution of new innovations, such as RMS® High Definition Models™ and the transition to cloud-based technologies, has facilitated a massive leap forward in the ability of companies to absorb, analyze and apply this new data within their actuarial and underwriting ecosystems. Quantifying Risk Uncertainty “Risk has an inherent level of uncertainty,” explains Mohsen Rahnama, chief modeling officer at RMS. “The key is how you quantify that uncertainty. No matter what hazard you are modeling, whether it is earthquake, flood, wildfire or hurricane, there are assumptions being made. These catastrophic perils are low-probability, high-consequence events as evidenced, for example, by the 2017 and 2018 California wildfires or Hurricane Katrina in 2005 and Hurricane Harvey in 2017. For earthquake, examples include Tohoku in 2011, the New Zealand earthquakes in 2010 and 2011, and Northridge in 1994. For this reason, risk estimation based on an actuarial approach cannot be carried out for these severe perils; physical models based upon scientific research and event characteristic data for estimating risk are needed.” A critical element in reducing uncertainty is a clear understanding of the sources of uncertainty from the hazard, vulnerability and exposure at risk. “Physical models, such as those using a high-definition approach, systematically address and quantify the uncertainties associated with the hazard and vulnerability components of the model,” adds Rahnama. “There are significant epistemic (also known as systematic) uncertainties in the loss results, which users should consider in their decision-making process. This epistemic uncertainty is associated with a lack of knowledge. It can be subjective and is reducible with additional information.” What are the sources of this uncertainty? For earthquake, there is uncertainty about the ground motion attenuation functions, soil and geotechnical data, the size of the events, or unknown faults. Rahnama explains: “Addressing the modeling uncertainty is one side of the equation. Computational power enables millions of events and more than 50,000 years of simulation to be used, to accurately capture the hazard and reduce the epistemic uncertainty. Our findings show that in the case of earthquakes the main source of uncertainty for portfolio analysis is ground motion; however, vulnerability is the main driver of uncertainty for a single location.” The quality of the exposure data as the input to any mathematical models is essential to assess the risk accurately and reduce the loss uncertainty. However, exposure could represent the main source of loss uncertainty, especially when exposure data is provided in aggregate form. Assumptions can be made to disaggregate exposure using other sources of information, which helps to some degree reduce the associated uncertainty. Rahnama concludes, “Therefore, it is essential in order to minimize the uncertainty related to exposure to try to get location-level information about the exposure, in particular for the region with the potential of liquification for earthquake or for high-gradient hazard such as flood and wildfire.” A critical element in reducing that uncertainty, removing those assumptions and enhancing risk understanding is combining location-level data and hazard information. That combination provides the data basis for quantifying risk in a systematic way. Understanding the direct correlation between risk or hazard and exposure requires location-level data. The potential damage caused to a location by flood, earthquake or wind will be significantly influenced by factors such as first-floor elevation of a building, distance to fault lines or underlying soil conditions through to the quality of local building codes and structural resilience. And much of that granular data is now available and relatively easy to access. “The amount of location data that is available today is truly phenomenal,” believes Michael Young, vice president of product management at RMS, “and so much can be accessed through capabilities as widely available as Google Earth. Straightforward access to this highly detailed satellite imagery means that you can conduct desktop analysis of individual properties and get a pretty good understanding of many of the building and location characteristics that can influence exposure potential to perils such as wildfire.” Satellite imagery is already a core component of RMS model capabilities, and by applying machine learning and artificial intelligence (AI) technologies to such images, damage quantification and differentiation at the building level is becoming a much more efficient and faster undertaking — as demonstrated in the aftermath of Hurricanes Laura and Delta. “Within two days of Hurricane Laura striking Louisiana at the end of August 2020,” says Rahnama, “we had been able to assess roof damage to over 180,000 properties by applying our machine-learning capabilities to satellite images of the affected areas. We have ‘trained’ our algorithms to understand damage degree variations and can then superimpose wind speed and event footprint specifics to group the damage degrees into different wind speed ranges. What that also meant was that when Hurricane Delta struck the same region weeks later, we were able to see where damage from these two events overlapped.” The Data Intensity of Wildfire Wildfire by its very nature is a data-intensive peril, and the risk has a steep gradient where houses in the same neighborhood can have drastically different risk profiles. The range of factors that can make the difference between total loss, partial loss and zero loss is considerable, and to fully grasp their influence on exposure potential requires location-level data. The demand for high-resolution data has increased exponentially in the aftermath of recent record-breaking wildfire events, such as the series of devastating seasons in California in 2017-18, and unparalleled bushfire losses in Australia in 2019-20. Such events have also highlighted myriad deficiencies in wildfire risk assessment including the failure to account for structural vulnerabilities, the inability to assess exposure to urban conflagrations, insufficient high-resolution data and the lack of a robust modeling solution to provide insight about fire potential given the many years of drought. Wildfires in 2017 devastated the town of Paradise, California In 2019, RMS released its U.S. Wildfire HD Model, built to capture the full impact of wildfire at high resolution, including the complex behaviors that characterize fire spread, ember accumulation and smoke dispersion. Able to simulate over 72 million wildfires across the contiguous U.S., the model creates ultrarealistic fire footprints that encompass surface fuels, topography, weather conditions, moisture and fire suppression measures. “To understand the loss potential of this incredibly nuanced and multifactorial exposure,” explains Michael Young, “you not only need to understand the probability of a fire starting but also the probability of an individual building surviving. “If you look at many wildfire footprints,” he continues, “you will see that sometimes up to 60 percent of buildings within that footprint survived, and the focus is then on what increases survivability — defensible space, building materials, vegetation management, etc. We were one of the first modelers to build mitigation factors into our model, such as those building and location attributes that can enhance building resilience.” Moving the Differentiation Needle In a recent study by RMS and the Center for Insurance Policy Research, the Insurance Institute for Business and Home Safety and the National Fire Protection Association, RMS applied its wildfire model to quantifying the benefits of two mitigation strategies — structural mitigation and vegetation management — assessing hypothetical loss reduction benefits in nine communities across California, Colorado and Oregon. Young says: “By knowing what the building characteristics and protection measures are within the first 5 feet and 30 feet at a given property, we were able to demonstrate that structural modifications can reduce wildfire risk up to 35 percent, while structural and vegetation modifications combined can reduce it by up to 75 percent. This level of resolution can move the needle on the availability of wildfire insurance as it enables development of robust rating algorithms to differentiate specific locations — and means that entire neighborhoods don’t have to be non-renewed.” “By knowing what the building characteristics and protection measures are within the first 5 feet and 30 feet at a given property, we were able to demonstrate that structural modifications can reduce wildfire risk up to 35 percent, while structural and vegetation modifications combined can reduce it by up to 75 percent” Michael Young, RMS While acknowledging that modeling mitigation measures at a 5-foot resolution requires an immense granularity of data, RMS has demonstrated that its wildfire model is responsive to data at that level. “The native resolution of our model is 50-meter cells, which is a considerable enhancement on the zip-code level underwriting grids employed by some insurers. That cell size in a typical suburban neighborhood encompasses approximately three-to-five buildings. By providing the model environment that can utilize information within the 5-to-30-foot range, we are enabling our clients to achieve the level of data fidelity to differentiate risks at that property level. That really is a potential market game changer.” Evolving Insurance Pricing It is not hyperbolic to suggest that being able to combine high-definition modeling with high-resolution data can be market changing. The evolution of risk-based pricing in New Zealand is a case in point. The series of catastrophic earthquakes in the Christchurch region of New Zealand in 2010 and 2011 provided a stark demonstration of how insufficient data meant that the insurance market was blindsided by the scale of liquefaction-related losses from those events. “The earthquakes showed that the market needed to get a lot smarter in how it approached earthquake risk,” says Michael Drayton, consultant at RMS, “and invest much more in understanding how individual building characteristics and location data influenced exposure performance, particularly in relation to liquefaction. “To get to grips with this component of the earthquake peril, you need location-level data,” he continues. “To understand what triggers liquefaction, you must analyze the soil profile, which is far from homogenous. Christchurch, for example, sits on an alluvial plain, which means there are multiple complex layers of silt, gravel and sand that can vary significantly from one location to the next. In fact, across a large commercial or industrial complex, the soil structure can change significantly from one side of the building footprint to the other.” Extensive building damage in downtown Christchurch, New Zealand after 2011 earthquakeThe aftermath of the earthquake series saw a surge in soil data as teams of geotech engineers conducted painstaking analysis of layer composition. With multiple event sets to use, it was possible to assess which areas suffered soil liquefaction and from which specific ground-shaking intensity. “Updating our model with this detailed location information brought about a step-change in assessing liquefaction exposures. Previously, insurers could only assess average liquefaction exposure levels, which was of little use where you have highly concentrated risks in specific areas. Through our RMS® New Zealand Earthquake HD Model, which incorporates 100-meter grid resolution and the application of detailed ground data, it is now possible to assess liquefaction exposure potential at a much more localized level.” “Through our RMS® New Zealand Earthquake HD model, which incorporates 100-meter grid resolution and the application of detailed ground data, it is now possible to assess liquefaction exposure potential at a much more localized level” — Michael Drayton, RMS This development represents a notable market shift from community to risk-based pricing in New Zealand. With insurers able to differentiate risks at the location level, this has enabled companies such as Tower Insurance to more accurately adjust premium levels to reflect risk to the individual property or area. In its annual report in November 2019, Tower stated: “Tower led the way 18 months ago with risk-based pricing and removing cross-subsidization between low- and high-risk customers. Risk-based pricing has resulted in the growth of Tower’s portfolio in Auckland while also reducing exposure to high-risk areas by 16 percent. Tower’s fairer approach to pricing has also allowed the company to grow exposure by 4 percent in the larger, low-risk areas like Auckland, Hamilton, and Taranaki.” Creating the Right Ecosystem The RMS commitment to enable companies to put high-resolution data to both underwriting and portfolio management use goes beyond the development of HD Models™ and the integration of multiple layers of location-level data. Through the launch of RMS Risk Intelligence™, its modular, unified risk analytics platform, and the Risk Modeler™ application, which enables users to access, evaluate, compare and deploy all RMS models, the company has created an ecosystem built to support these next-generation data capabilities. Deployed within the Cloud, the ecosystem thrives on the computational power that this provides, enabling proprietary and tertiary data analytics to rapidly produce high-resolution risk insights. A network of applications — including the ExposureIQ™ and SiteIQ™ applications and Location Intelligence API — support enhanced access to data and provide a more modular framework to deliver that data in a much more customized way. “Because we are maintaining this ecosystem in the Cloud,” explains Michael Young, “when a model update is released, we can instantly stand that model side-by-side with the previous version. As more data becomes available each season, we can upload that new information much faster into our model environment, which means our clients can capitalize on and apply that new insight straightaway.” Michael Drayton adds: “We’re also offering access to our capabilities in a much more modular fashion, which means that individual teams can access the specific applications they need, while all operating in a data-consistent environment. And the fact that this can all be driven through APIs means that we are opening up many new lines of thought around how clients can use location data.” Exploring What Is Possible There is no doubt that the market is on the cusp of a new era of data resolution — capturing detailed hazard and exposure and using the power of analytics to quantify the risk and risk differentiation. Mohsen Rahnama believes the potential is huge. “I foresee a point in the future where virtually every building will essentially have its own social-security-like number,” he believes, “that enables you to access key data points for that particular property and the surrounding location. It will effectively be a risk score, including data on building characteristics, proximity to fault lines, level of elevation, previous loss history, etc. Armed with that information — and superimposing other data sources such as hazard data, geological data and vegetation data — a company will be able to systematically price risk and assess exposure levels for every asset up to the portfolio level.” “The only way we can truly assess this rapidly changing risk is by being able to systematically evaluate exposure based on high-resolution data and advanced modeling techniques that incorporate building resilience and mitigation measures” — Mohsen Rahnama, RMS Bringing the focus back to the here and now, he adds, the expanding impacts of climate change are making the need for this data transformation a market imperative. “If you look at how many properties around the globe are located just one meter above sea level, we are talking about trillions of dollars of exposure. The only way we can truly assess this rapidly changing risk is by being able to systematically evaluate exposure based on high-resolution data and advanced modeling techniques that incorporate building resilience and mitigation measures. How will our exposure landscape look in 2050? The only way we will know is by applying that data resolution underpinned by the latest model science to quantify this evolving risk.”


TreatyIQ: Striking a Difficult Balance
As treaty underwriters prepare to navigate another challenging renewal season, compounded by an uncertain economic outlook, many are looking to new technological solutions to help them capitalize on nascent optimism around rates and build sustainable profitability. EXPOSURE explores the importance of reliable marginal impact analytics to bias underwriting decisions in favor of diversification The fall of investment profits for insurance and reinsurance companies as a result of the impact of COVID-19 on financial markets is likely to encourage an upswing in reinsurance pricing. One of the factors that facilitates a hardening market is low investment returns, making an underwriting profit even more of an imperative. As the midyear renewals approach, reinsurance companies are cautiously optimistic that the reinsurance rate on line will continue on an upward trend. According to Willis Towers Watson, pricing was up significantly on loss-affected accounts as of April 1, but elsewhere there were more modest rate rises. It suggests that at this point in the cycle reinsurers cannot count on rate increases, presenting market pricing uncertainty that will need to be navigated in real time during the renewals. In the years of weaker market returns, investment in tools to deliver analytical rigor and agile pricing to underwriters can be difficult to justify, but in many cases, existing analytical processes during busy periods can expose blind spots in the assessment of a cedant portfolio and latency in the analysis of current portfolio risk positions. These inefficiencies will be more pronounced in the current work-from-home era and will leave many underwriters wondering how they can quickly identify and grab the best deals for their portfolios. Reducing Volatility Through the Cycle Both parts of the underwriting cycle can put pressure on reinsurers on underwriting decisions. Whether prices are hardening or softening, market forces can lead reinsurers toward higher volatility. “Part of the interplay in the treaty underwriting guidelines has to do with diversification,” explains Jesse Nickerson, senior director, pricing actuary at RMS. “Underwriters generally want to write risks that are diversifying in nature. However, when rates are low and competition is fierce, this desire is sometimes overwhelmed by pressure to put capital to use. Underwriting guidelines then have a somewhat natural tendency to slip as risks are written at inadequate prices. Underwriters generally want to write risks that are diversifying in nature. However, when rates are low and competition is fierce, this desire is sometimes overwhelmed by pressure to put capital to use Jesse Nickerson RMS “The reduced competition in the market during the period of low profitability triggers increases in rates, and the bounce upward begins,” he continues. “As rates rise and profitability increases, another loosening of underwriting guidelines can occur because all business begins to look like good business. This cycle is a challenge for all of these reinsurance companies to try and manage as it can add significant volatility to their book.” Tools such as RMS TreatyIQ™ help underwriters better carry out marginal impact analytics, which considers the view of risk if new books of business are included in a treaty portfolio. Treaty underwriters are typically tasked with balancing the profitability of individual treaties alongside their impact to aggregate portfolio positions. “One of the things that underwriters take into account as part of the underwriting process is, ‘What is the impact of this potential piece of business on my current portfolio,’” explains Oli Morran, director of product at RMS. “It’s just like an investment decision except that they’re investing risk capital rather than investment capital. In order to get insight into marginal impact, treaty underwriters need to have a view of their portfolio in the application, and not just their current portfolio as it looks last week, month or quarter, but how it looks today “In order to get insight into marginal impact, treaty underwriters need to have a view of their portfolio in the application, and not just their current portfolio as it looks last week, month or quarter, but how it looks today,” he continues. “So, it collects all the treaty contracts you’ve underwritten and rolls it up together to get to your current portfolio position.” Based on this understanding of a reinsurer’s aggregate risk position, underwriters are able to see in real time what impact any given piece of business would have, helping to inform how much capacity they are willing to bring to bear – and at what price. As reinsurers navigate the current, asymmetric market renewals, with the added challenge that increased home-working presents, such insight will allow them to make the right judgments based on a dynamic situation. “Treaty underwriters can import that loss data into TreatyIQ, do some quick analysis and ‘math magic’ to make it work for their view of risk and then get a report in the app that tells them profitability metrics on each of the treaties in the structure, so they can configure the right balance of participation in each treaty when quoting to the broker or cedant,” says Morran. An Art and Science Relationships have always been a central part of treaty underwriting whereby reinsurers select cedants to partner with based on many years of experience and association. Regardless of where the industry is at in the market cycle, these important bonds help to shape the renewal process at key discussion points in the calendar. New tools, such as the TreatyIQ application, are enhancing both the “art” and ”science” parts of the underwriting equation. They are reducing the potential for volatility as underwriters steer portfolios through the reinsurance cycle while harnessing experience and pricing artistry in an auditable way. While much of insurtech has until now been focused on the underlying insurance market, reinsurers are beginning to benefit from applications that offer them real-time insights. An informed approach can help identify the most profitable accounts and steer underwriters toward business that best complements their company’s existing portfolio, overall strategy and risk appetite. Reinsurance underwriters can now make decisions on whether to renew and what pricing to set based on a true understanding of what one risk sitting on their desk has the ability to do to the risks they already hold. With hundreds of treaty programs to assess during a busy renewal season, such insights support underwriters as they decide which deals to underwrite and what portion of each treaty to take on. A constant challenge for treaty underwriters is how to strike the right balance between managing complex and often longstanding relationships with cedants and brokers, while at the same time ensuring that underwritten business complements an existing portfolio. Maintaining underwriting discipline while nurturing all-important client relationships is a more straightforward task when there is data and insight readily available, says Nickerson. “Much of the strength of TreatyIQ is in the efficiency of workflows in augmenting the insight underwriters have at their fingertips. The faster they can get back to a cedant or broker, the better it is for the relationship. The more completely they understand the impact to their portfolio, the better it is for their bottom line.” RMS model data has long been a foundation in reinsurance treaty transactions, providing the common market view of risk for assessing probable catastrophe losses to a cedant’s portfolio. But using modeled data in treaty pricing analytics has traditionally been a multisystem undertaking, involving a supporting cast of actuaries and cat modelers. TreatyIQ allows you to pass losses through potential treaties and quickly see which are the most profitable based on a user’s unique pricing algorithms and risk tolerance RMS Risk Intelligence™ – a modular risk analytics platform – has enabled RMS to develop TreatyIQ as a solution to the analytics needs of treaty underwriters, covering pricing and portfolio roll-up, and to close the analytical gaps that muddy pricing insights. “TreatyIQ allows you to pass losses through potential treaties and quickly see which are the most profitable based on a user’s unique pricing algorithms and risk tolerance,” continues Nickerson. “You can see which have the most positive impact on your portfolio, allowing you to go back to the broker or cedant and make a more informed pitch. Ultimately, it allows underwriters to optimize internally against the constraints that exist in their world at a time of great uncertainty and change.”


The Data Difference
The value of data as a driver of business decisions has grown exponentially as the importance of generating sustainable underwriting profit becomes the primary focus for companies in response to recent diminished investment yields. Increased risk selection scrutiny is more important than ever to maintain underwriting margins. High-caliber, insightful risk data is critical for the data analytics that support each risk decision The insurance industry is in a transformational phase where profit margins continue to be stretched in a highly competitive marketplace. Changing customer dynamics and new technologies are driving demand for more personalized solutions delivered in real time, while companies are working to boost performance, increase operational efficiency and drive greater automation. In some instances, this involves projects to overhaul legacy systems that are central to daily operation. In such a state of market flux, access to quality data has become a primary differentiator. But there’s the rub. Companies now have access to vast amounts of data from an expanding array of sources — but how can organizations effectively distinguish good data from poor data? What differentiates the data that delivers stellar underwriting performance from that which sends a combined operating performance above 100 percent? A Complete Picture “Companies are often data rich, but insight poor,” believes Jordan Byk, senior director, product management at RMS. “The amount of data available to the (re)insurance industry is staggering, but creating the appropriate insights that will give them a competitive advantage is the real challenge. To do that, data consumers need to be able to separate ‘good’ from ‘bad’ and identify what constitutes ‘great’ data.” For Byk, a characteristic of “great data” is the speed with which it drives confident decision-making that, in turn, guides the business in the desired direction. “What I mean by speed here is not just performance, but that the data is reliable and insightful enough that decisions can be made immediately, and all are confident that the decisions fit within the risk parameters set by the company for profitable growth. “While resolution is clearly a core component of our modeling capabilities at RMS, the ultimate goal is to provide a complete data picture and ensure quality and reliability of underlying data” Oliver Smith RMS “We’ve solved the speed and reliability aspect by generating pre-compiled, model-derived data at resolutions intelligent for each peril,” he adds. There has been much focus on increasing data-resolution levels, but does higher resolution automatically elevate the value of data in risk decision-making? The drive to deliver data at 10-, five- or even one-meter resolution may not necessarily be the main ingredient in what makes truly great data. “Often higher resolution is perceived as better,” explains Oliver Smith, senior product manager at RMS, “but that is not always the case. While resolution is clearly a core component of our modeling capabilities at RMS, the ultimate goal is to provide a complete data picture and ensure quality and reliability of underlying data. “Resolution of the model-derived data is certainly an important factor in assessing a particular exposure,” adds Smith, “but just as important is understanding the nature of the underlying hazard and vulnerability components that drive resolution. Otherwise, you are at risk of the ‘garbage-in-garbage-out’ scenario that can foster a false sense of reliability based solely around the ‘level’ of resolution.” The Data Core The ability to assess the impact of known exposure data is particularly relevant to the extensive practice of risk scoring. Such scoring provides a means of expressing a particular risk as a score from 1 to 10, 1 to 20 or another means that indicates “low risk to high risk” based on an underlying definition for each value. This enables underwriters to make quick submission assessments and supports critical decisions relating to quoting, referrals and pricing. “Such capabilities are increasingly common and offer a fantastic mechanism for establishing underwriting guidelines, and enabling prioritization and triage of locations based on a consistent view of perceived riskiness,” says Chris Sams, senior product manager at RMS. “What is less common, however, is ‘reliable’ and superior quality risk scoring, as many risk scores do not factor in readily available vulnerability data.” “Such capabilities are increasingly common and offer a fantastic mechanism for establishing underwriting guidelines, and enabling prioritization and triage of locations based on a consistent view of perceived riskiness” Chris Sams RMS Exposure insight is created by adjusting multiple data lenses until the risk image comes into focus. If particular lenses are missing or there is an overreliance on one particular lens, the image can be distorted. For instance, an overreliance on hazard-related information can significantly alter the perceived exposure levels for a specific asset or location. “Take two locations adjacent to one another that are exposed to the same wind or flood hazard,” Byk says. “One is a high-rise hotel built in 2020 and subject to the latest design standards, while another is a wood-frame, small commercial property built in the 1980s; or one location is built at ground level with a basement, while another is elevated on piers and does not have a basement. “These vulnerability factors will result in a completely different loss experience in the occurrence of a wind- or flood-related event. If you were to run the locations through our models, the annual average loss figures will vary considerably. But if the underwriting decision is based on hazard-only scores, they will look the same until they hit the portfolio assessment — and that’s when the underwriter could face some difficult questions.” To assist clients to understand the differences in vulnerability factors, RMS provides ExposureSource, a U.S. property database comprised of property characteristics for 82 million residential buildings and 21 million commercial buildings. By providing this high-quality exposure data set, clients can make the most of the RMS risk scoring products for the U.S. Seeing Through the Results Another common shortfall with risk scores is the lack of transparency around the definitions attributed to each value. Looking at a scale of 1 to 10, for example, companies don’t have insight into the exposure characteristics being used to categorize a particular asset or location as, say, a 4 rather than a 5 or 6. To combat data-scoring deficiencies, RMS RiskScore values are generated by catastrophe models incorporating the trusted science and quality you expect from an RMS model, calibrated on billions of dollars of real-world claims. With consistent and reliable risk scores covering 30 countries and up to seven perils, the apparent simplicity of the RMS RiskScore hides the complexity of the big data catastrophe simulations that create them. The scores combine hazard and vulnerability to understand not only the hazard experienced at a site, but also the susceptibility of a particular building stock when exposed to a given level of hazard. The RMS RiskScore allows for user definition of exposure characteristics such as occupancy, construction material, building height and year built. Users can also define secondary modifiers such as basement presence and first-floor height, which are critical for the assessment of flood risk, and roof shape or roof cover, which is critical for wind risk. “It also provides clearly structured definitions for each value on the scale,” explains Smith, “providing instant insight on a risk’s damage potential at key return periods, offering a level of transparency not seen in other scoring mechanisms. For example, a score of 6 out of 10 for a 100-year earthquake event equates to an expected damage level of 15 to 20 percent. This information can then be used to support a more informed decision on whether to decline, quote or refer the submission. Equally important is that the transparency allows companies to easily translate the RMS RiskScore into custom scales, per peril, to support their business needs and risk tolerances.” Model Insights at Point of Underwriting While RMS model-derived data should not be considered a replacement for the sophistication offered by catastrophe modeling, it can enable underwriters to access relevant information instantaneously at the point of underwriting. “Model usage is common practice across multiple points in the (re)insurance chain for assessing risk to individual locations, accounts, portfolios, quantifying available capacity, reinsurance placement and fulfilling regulatory requirements — to name but a few,” highlights Sams. “However, running the model takes time, and, often, underwriting decisions — particularly those being made by smaller organizations — are being made ahead of any model runs. By the time the exposure results are generated, the exposure may already be at risk.” “Through this interface, companies gain access to the immense datasets that we maintain in the cloud and can simply call down risk decision information whenever they need it” Jordan Byk RMS In providing a range of data products into the process, RMS is helping clients select, triage and price risks before such critical decisions are made. The expanding suite of data assets is generated by its probabilistic models and represents the same science and expertise that underpins the model offering. “And by using APIs as the delivery vehicle,” adds Byk, “we not only provide that modeled insight instantaneously, but also integrate that data directly and seamlessly into the client’s on-premise systems at critical points in their workflow. Through this interface, companies gain access to the immense datasets that we maintain in the cloud and can simply call down risk decision information whenever they need it. While these are not designed to compete with a full model output, until a time that we have risk models that provide instant analysis, such model-derived datasets offer the speed of response that many risk decisions demand.” A Consistent and Broad Perspective on Risk A further factor that can instigate problems is data and analytics inconsistency across the (re)insurance workflow. Currently, with data extracted from multiple sources and, in many cases, filtered through different lenses at various stages in the workflow, having consistency from the point of underwriting to portfolio management has been the norm. “There is no doubt that the disparate nature of available data creates a disconnect between the way risks are assumed into the portfolio and how they are priced,” Smith points out. “This disconnect can cause ‘surprises’ when modeling the full portfolio, generating a different risk profile than expected or indicating inadequate pricing. By applying data generated via the same analytics and data science that is used for portfolio management, consistency can be achieved for underwriting risk selection and pricing, minimizing the potential for surprise.” Equally important, given the scope of modeled data required by (re)insurance companies, is the need to focus on providing users with the means to access the breadth of data from a central repository. “If you access such data at speed, including your own data coupled with external information, and apply sophisticated analytics — that is how you derive truly powerful insights,” he concludes. “Only with that scope of reliable, insightful information instantly accessible at any point in the chain can you ensure that you’re always making fully informed decisions — that’s what great data is really about. It’s as simple as that.” For further information on RMS’s market-leading data solutions, click here.


This Changes Everything
At Exceedance 2020, RMS explored the key forces currently disrupting the industry, from technology, data analytics and the cloud through to rising extremes of catastrophic events like the pandemic and climate change. This coupling of technological and environmental disruption represents a true inflection point for the industry. EXPOSURE asked six experts across RMS for their views on why they believe these forces will change everything Cloud Computing: Moe Khosravy, Executive Vice President, Software and Platforms How are you seeing businesses transition their workloads over to the cloud? I have to say it’s been remarkable. We’re way past basic conversations on the value proposition of the cloud to now having deep technical discussions that are truly transformative plays. Customers are looking for solutions that seamlessly scale with their business and platforms that lower their cost of ownership while delivering capabilities that can be consumed from anywhere in the world. Why is the cloud so important or relevant now? It is now hard for a business to beat the benefits that the cloud offers and getting harder to justify buying and supporting complex in-house IT infrastructure. There is also a mindset shift going on — why is an in-house IT team responsible for running and supporting another vendor’s software on their systems if the vendor itself can provide that solution? This burden can now be lifted using the cloud, letting the business concentrate on what it does best. Has the pandemic affected views of being in the cloud? I would say absolutely. We have always emphasized the importance of cloud and true SaaS architectures to enable business continuity — allowing you to do your work from anywhere, decoupled from your IT and physical footprint. Never has the importance of this been more clearly underlined than during the past few months. Risk Analytics: Cihan Biyikoglu, Executive Vice President, Product What are the specific industry challenges that risk analytics is solving or has the potential to solve? Risk analytics really is a wide field, but in the immediate short term one of the focus areas for us is improving productivity around data. So much time is spent by businesses trying to manually process data — cleansing, completing and correcting data — and on conversion between incompatible datasets. This alone is a huge barrier just to get a single set of results. If we can take this burden away, give decision-makers the power to get results in real time with automated and efficient data handling, then with that I believe we will liberate them to use the latest insights to drive business results. Another important innovation here are the HD Models™. The power of the new engine with its improved accuracy I believe is a game changer that will give our customers a competitive edge. How will risk analytics impact activities and capabilities within the market? As seen in other industries, the more data you can combine, the better the analytics become — that’s the universal law of analytics. Getting all of this data on a unified platform and combining different datasets unearths new insights, which could produce opportunities to serve customers better and drive profit or growth. What are the longer-term implications for risk analytics? In my view, it’s about generating more effective risk insights from analytics, results in better decision- making and the ability to explore new product areas with more confidence. It will spark a wave of innovation to profitably serve customers with exciting products and understand the risk and cost drivers more clearly. How is RMS capitalizing on risk analytics? At RMS, we have the pieces in place for clients to accelerate their risk analytics with the unified, open platform, Risk Intelligence™, which is built on a Risk Data Lake™ in the cloud and is ready to take all sources of data and unearth new insights. Applications such as Risk Modeler™ and ExposureIQ™ can quickly get decision-makers to the analytics they need to influence their business. Open Standards: Dr. Paul Reed, Technical Program Manager, RDOS Why are open standards so important and relevant now? I think the challenges of risk data interoperability and supporting new lines of business have been recognized for many years, as companies have been forced to rework existing data standards to try to accommodate emerging risks and to squeeze more data into proprietary standards that can trace their origins to the 1990s. Today, however, with the availability of big data technology, cloud platforms such as RMS Risk Intelligence and standards such as the Risk Data Open Standard™ (RDOS) allow support for high-resolution risk modeling, new classes of risk, complex contract structures and simplified data exchange. Are there specific industry challenges that open standards are solving or have the potential to solve? I would say that open standards such as the RDOS are helping to solve risk data interoperability challenges, which have been hindering the industry, and provide support for new lines of business. In the case of the RDOS, it’s specifically designed for extensibility, to create a risk data exchange standard that is future-proof and can be readily modified and adapted to meet both current and future requirements. Open standards in other industries, such as Kubernetes, Hadoop and HTML, have proven to be catalysts for collaborative innovation, enabling accelerated development of new capabilities. How is RMS responding to and capitalizing on this development? RMS contributed the RDOS to the industry, and we are using it as the data framework for our platform called Risk Intelligence. The RDOS is free for anyone to use, and anyone can contribute updates that can expand the value and utility of the standard — so its development and direction is not dependent on a single vendor. We’ve put in place an independent steering committee to guide the development of the standard, currently made up of 15 companies. It provides benefits to RMS clients not only by enhancing the new RMS platform and applications, but also by enabling other industry users who create new and innovative products and address new and emerging risk classes. Pandemic Risk: Dr. Gordon Woo, Catastrophist How does pandemic risk affect the market? There’s no doubt that the current pandemic represents a globally systemic risk across many market sectors, and insurers are working out both what the impact from claims will be and the impact on capital. For very good reasons, people are categorizing the COVID-19 disease as a game-changer. However, in my view, SARS [severe acute respiratory syndrome] in 2003, MERS [Middle East respiratory syndrome] in 2012 and Ebola in 2014 should also have been game-changers. Over the last decade alone, we have seen multiple near misses. It’s likely that suppression strategies to combat the coronavirus will probably continue in some form until a vaccine is developed, and governments must strike this uneasy balance between their economies and the opening of their populations to exposure from the virus. What are the longer-term implications of this current pandemic for the industry? It’s clear that the mitigation of pandemic risk will need to be prioritized and given far more urgency than before. There’s no doubt in my mind that events such as the 2014 Ebola crisis were a missed opportunity for new initiatives in pandemic risk mitigation. Away from the life and health sector, all insurers will need to have a better grasp on future pandemics, after seeing the impact of COVID-19 and its wide business impact. The market could look to bold initiatives with governments to examine how to cover future pandemics, similar to how terror attacks are covered as a pooled risk. How is RMS helping its clients in relation to COVID-19? Since early January when the first cases emerged from Wuhan, China, we’ve been supporting our clients and the wider market in gaining a better understanding of the diverse loss implications of COVID-19. Our LifeRisks® team has been actively assisting in pandemic risk management, with regular communications and briefings, and will incorporate new perspectives from COVID-19 into our infectious diseases modeling. Climate Change: Ryan Ogaard, Senior Vice President, Model Product Management Why is climate change so relevant to the market now? There are many reasons. Insurers and their stakeholders are looking at the constant flow of catastrophes, from the U.S. hurricane season of 2017, wildfires in California and bushfires in Australia, to recent major typhoons and wondering if climate change is driving extreme weather risk, and what it could do in the future. They’re asking whether the current extent of climate change risk is priced into their premiums. Regulators are also beginning to conduct stress tests on the potential impact of climate change in the future, and insurers must respond. How will climate change impact how the market operates? Similar to any risk, insurers need to understand and quantify how the physical risk of climate change will impact their portfolios and adjust their strategy accordingly. Also, over the coming years it appears likely that regulators will incorporate climate change reporting into their regimes. Once an insurer understands their exposure to climate change risk, they can then start to take action — which will impact how the market operates. These actions could be in the form of premium changes, mitigating actions such as supporting physical defenses, diversifying the risk or taking on more capital. How is RMS responding to market needs around climate change? RMS is listening to the needs of clients to understand their pain points around climate change risk, what actions they are taking and how we can add value. We’re working with a number of clients on bespoke studies that modify the current view of risk to project into the future and/or test the sensitivity of current modeling assumptions. We’re also working to help clients understand the extent to which climate change is already built into risk models, to educate clients on emerging climate change science and to explain whether there is or isn’t a clear climate change signal for a particular peril. Cyber: Dr. Christos Mitas, Vice President, Model Development How is this change currently manifesting itself? While cyber risk itself is not new, for anyone involved in protecting or insuring organizations against cyberattacks, they will know that the nature of cyber risk is forever evolving. This could involve changes in those perpetrating the attacks, from lone wolf criminals to state-backed actors or the type of target from an unpatched personal computer to a power-plant control system. If you take the current COVID-19 pandemic, this has seen cybercriminals look to take advantage of millions of employees working from home or vulnerable business IT infrastructure. Change to the threat landscape is a constant for cyber risk. Why is cyber risk so important and relevant right now? Simply because new cyber risks emerge, and insurers who are active in this area need to ensure they are ahead of the curve in terms of awareness and have the tools and knowledge to manage new risks. There have been systemic ransomware attacks over the last few years, and criminals continue to look for potential weaknesses in networked systems, third-party software, supply chains — all requiring constant vigilance. It’s this continual threat of a systemic attack that requires insurers to use effective tools based on cutting-edge science, to capture the latest threats and identify potential risk aggregation. How is RMS responding to market needs around cyber risk? With our latest RMS Cyber Solutions, which is version 4.0, we’ve worked closely with clients and the market to really understand the pain points within their businesses, with a wealth of new data assets and modeling approaches. One area is the ability to know the potential cyber risk of the type of business you are looking to insure. In version 4.0, we have a database of over 13 million businesses that can help enrich the information you have about your portfolio and prospective clients, which then leads to more prudent and effective risk modeling. A Time to Change Our industry is undergoing a period of significant disruption on multiple fronts. From the rapidly evolving exposure landscape and the extraordinary changes brought about by the pandemic to step-change advances in technology and seismic shifts in data analytics capabilities, the market is undergoing an unparalleled transition period. As Exceedance 2020 demonstrated, this is no longer a time for business as usual. This is what defines leaders and culls the rest. This changes everything.
