


EXPOSURE
The RMS Magazine with a unique perspective and clear mission “... to provide insight and analysis to help insurance and risk professionals innovate, adapt, and deliver.”

Insurance: The next 10 years
Mohsen Rahnama, Cihan Biyikoglu and Moe Khosravy of RMS look to 2029, consider the…
Times Square, New York City
Reset Filters
Articles
- 2022
- 2021
- 2020
- 2019
- 2018
- 2017
- 2016


The Power of a Crisis
As Christchurch City Council continues to build back better, will its resilience investment pay dividends when it comes to citywide insurance cover? The Canterbury Earthquake Sequence is the largest insured event in New Zealand’s history. Between September 2010 and December 2011, four major earthquakes caused damage to approximately 168,000 residential buildings. The earthquakes spawned more than 770,000 claims for the country’s Earthquake Commission (EQC) alone, resulting in a payout of around NZ$10 billion (US$6.4 billion). The private sector absorbed almost twice that, with the Insurance Council of New Zealand putting the figure at NZ$21.4 billion (as of March 31, 2019). Christchurch Art Gallery. The city’s art gallery, for example, has been retrofitted to resist even the most severe earthquake activity. Nine years on from the initial tremors, there remain over 1,200 open property claims in the private market, while the outstanding figure for the EQC stood at some 2,600 claims in February 2018. “Dealing with the property claims was extremely challenging,” explains Raf Manji, chair of the Christchurch City Council’s Finance Committee, “not just in terms of contractual issues, but because the insurance was based on building-by-building cover. And when you’re dealing with damage to so many buildings, it is going to take a very long time to agree what that damage is.” Building Back Better The need to rebuild Christchurch presented the city with an opportunity. “As American politician Rahm Emanuel once said, ‘Never let a crisis go to waste,’” says Lianne Dalziel, mayor of Christchurch. “The earthquakes provided a major opportunity to build back better and ensure we embed resilience into every aspect, from below ground up.” That commitment means that new construction, whether of above-ground assets or horizontal infrastructure, is being carried out to a level much higher than building codes dictate. “With the information, we want more informed conversations with both traditional and alternative markets about how we transfer risk more effectively” Raf Manji Christchurch City Council “We’re building to an exceptionally high standard,” states Mike Gillooly, chief resilience officer for the city. This is a relatively new public position created following Christchurch’s inclusion in the first wave of the Rockefeller Foundation’s 100 Resilient Cities program. “The city’s art gallery, for example, has been retrofitted to resist even the most severe earthquake activity,” Gillooly continues. But this dedication to resilience goes beyond the immediate rebuild. The council is also making resilience a core component of its long-term strategic planning. The city’s 2021-2051 infrastructure strategy, which covers the council’s investments in water supply, wastewater, stormwater, transport, parks, facilities, solid waste and communication technology for the next 30 years, will have resilience as its overarching theme. “This is the first time we are proactively building risk and resilience into our long-term planning framework,” states Dalziel. “We are developing a much deeper appreciation of risk and have spent considerable time understanding our infrastructure. We are also working toward a much more sophisticated engagement with risk at the community level.” “It’s not only about strengthening our physical infrastructure,” she continues. “It’s also about strengthening our social infrastructure.” “We are committed to promoting greater community well-being. We need to build up social capital by bringing people together to plan for an uncertain future. High levels of social capital accelerate recovery in the aftermath of a shock, while also creating greater inherent resilience to more slow-moving challenges, such as climate change and associated rising sea levels.” Dalziel is quick to stress the importance of insurance in all this. “There is a strong relationship between economic resilience and social resilience, and the role of insurance in facilitating both cannot be underestimated. The value of insurance does not simply equal the sum of claims paid — it’s as much about the financial and social well-being that it supports.” Making Resilience Pay Recently insurers across New Zealand have been shifting their appetite and premiums in high-hazard regions to be more reflective of the country’s risk profile. There has been a shift too in the council’s approach to insurance — a shift that is central to its resilience efforts, explains Manji. “Following the earthquakes, Lianne asked me to run for council. I was a former financial markets trader and she wanted someone onboard with a financial background. But when I joined, I was taken aback by the lack of risk understanding that I saw at the local government level.” One of his first steps was to set up an independently chaired audit and risk committee and introduce a new risk management framework — a model that has since been adopted by Auckland. “Through this new framework, we were able to establish a much more sophisticated view of risk,” he explains, “and we also launched a five-year program to document every single asset in place — both above and below ground. Having this granular level of exposure insight means we can assess our approach to mitigating, retaining and transferring risk from a much more data-informed position.” At present, Christchurch is conservatively insured. This is a very deliberate choice, however, and Manji is convinced of the benefits of this approach. “This excess capacity means we have headroom into which we can grow as we continue to construct new and reconstruct old assets. That’s a much stronger position to be in than having to return to the market seeking more limit when capacity may be limited. It also demonstrates a long-term commitment to the insurance market upon which you can have much more constructive, ongoing dialogue.” Data-Informed Dialogue Christchurch City Council has been making use of insurance capital for many years. It was the 2010-11 earthquakes, though, that spurred its focus on arming itself with increasingly higher-resolution data. “We’re now coming to the table each year with an ever more accurate picture of our exposure. Working with RMS, we’ve been able to significantly evolve our risk thinking based on a range of citywide loss scenarios, and to look at ways of creating a more effective balance between traditional and more innovative parametric-based solutions.” That desire for balance does not just apply to the source of Christchurch capital, but also what kinds of assets that capital covers. At present, while the council has secured coverage for 65 percent of the value of its above-ground structures, it has only managed to buy insurance to cover approximately 15 percent of its underground infrastructure. “The insurance market is not comfortable with providing cover for underground infrastructure because it tends not to be well understood or documented,” Manji continues. “Unlike most cities, however, we know exactly what is underground and just how resilient it is. With that information, we want to have more informed conversations — with both the traditional market and alternative providers of risk capital — about how we transfer this risk more effectively. Parametric-based solutions, for example, give us the opportunity to look beyond typical building replacement covers and take a bigger-picture view of what we want to achieve from our investment in risk transfer. “And whereas an indemnity-based policy is designed primarily to return you to where you were prior to the loss, parametric payouts can be deployed for what ever purpose you want. That flexibility — along with the speed and certainty of payout — is incredibly valuable.” For Gillooly, it is about becoming an increasingly sophisticated user of risk capital and engaging in ever more mature dialogue with the markets. “If we can demonstrate through the data and analytics that we understand the exposure, that we’ve quantified the risk and we’re investing in effective risk reduction, then the market needs to acknowledge these efforts in the form of increased capacity, reduced premiums or both. Data, analytics and risk insights will continue to be the key focus of our annual discussions with the London market — and will allow us to explore parametric insurance-linked securities with confidence too.”


The Art of Empowerment
A new app – SiteIQ™ from RMS intuitively synthesizes complex risk data for a single location, helping underwriters and coverholders to rate and select risks at the touch of a button The more holistic view of risk a property underwriter can get, the better decisions they are likely to make. In order to build up a detailed picture of risk at an individual location, underwriters or agents at coverholders have, until now, had to request exposure analytics on single risks from their portfolio managers and brokers. Also, they had to gather supplementary risk data from a range of external resources, whether it is from Catastrophe Risk Evaluation and Standardizing Target Accumulations (CRESTA) zones to look-ups on Google Maps. This takes valuable time, requires multiple user licenses and can generate information that is inconsistent with the underlying modeling data at the portfolio level. As the senior manager at one managing general agent (MGA) tells EXPOSURE, this misalignment of data means underwriting decisions are not always being made with confidence. This makes the buildup of unwanted risk aggregation in a particular area a very real possibility, invariably resulting in “senior management breathing down my neck.” With underwriters in desperate need of better multi-peril data at the point of underwriting, RMS has developed an app, SiteIQ, that leverages sophisticated modeling information, as well as a view of the portfolio of locations underwritten, to be easily understood and quickly actionable at the point of underwriting. But it also goes further as SiteIQ can integrate with a host of data providers so users can enter any address into the app and quickly see a detailed breakdown of the natural and human-made hazards that may put the property at risk. SiteIQ allows the underwriter to generate detailed risk scores for each location in a matter of seconds In addition to synthesized RMS data, users can also harness third-party risk data to overlay responsive map layers such as, arson, burglary and fire-protection insights, and other indicators that can help the underwriter better understand the characteristics of a building and assess whether it is well maintained or at greater risk. The app allows the underwriter to generate detailed risk scores for each location in a matter of seconds. It also assigns a simple color coding for each hazard, in line with the insurer’s appetite: whether that’s green for acceptable levels of risk all the way to red for risks that require more complex analysis. Crucially, users can view individual locations in the context of the wider portfolio, helping them avoid unwanted risk aggregation and write more consistently to the correct risk appetite. The app goes a level further by allowing clients to use a sophisticated rules engine that takes into account the client’s underwriting rules. This enables SiteIQ to recommend possible next steps for each location — whether that’s to accept the risk, refer it for further investigation or reject it based on breaching certain criteria. “We decided to build an app exclusively for underwriters to help them make quick decisions when assessing risks,” explains Shaheen Razzaq, senior director at RMS. “SiteIQ provides a systematic method to identify locations that don’t meet your risk strategy so you can focus on finding the risks that do. “People are moving toward simple digital tools that synthesize information quickly,” he adds. “Underwriters tell us they want access to science without having to rely on others and the ability to screen and understand risks within seconds.” And as the underlying data behind the application is based on the same RMS modeling information used at the portfolio level, this guarantees data consistency at all points in the chain. “Deep RMS science, including data from all of our high-definition models, is now being delivered to people upstream, building consistency and understanding,” says Razzaq. SiteIQ has made it simple to build in the customer’s risk appetite and their view of risk. “One of the major advantages of the app is that it is completely configurable by the customer. This could be assigning red-amber-green to perils with certain scores, setting rules for when it should recommend rejecting a location, or integrating a customer’s proprietary data that may have been developed using their underwriting and claims experience — which is unique to each company.” Reporting to internal and external stakeholders is also managed by the app. And above all, says Razzaq, it is simple to use, priced at an accessible level and requires no technical skill, allowing underwriters to make quick, informed decisions from their desktops and tablet devices — and soon their smartphones. In complex cases where deeper analysis is required or when models should be run, working together with cat modelers will still be a necessity. But for most risks, underwriters will be able to quickly screen and filter risk factors, reducing the need to consult their portfolio managers or cat modeling teams. “With underwriting assistants a thing of the past, and the expertise the cat modelers offer being a valuable but finite resource, it’s our responsibility to understand risk at the point of underwriting,” one underwriter explains. “As a risk decision-maker, when I need to make an assessment on a particular location, I need access to insights in a timely and efficient manner, so that I can make the best possible decision based on my business,” another underwriter adds. The app is not intended to replace the deep analysis that portfolio management teams do, but instead reduce the number of times they are asked for information by their underwriters, giving them more time to focus on the job at hand — helping underwriters assess the most complex of risks. Bringing Coverholders on Board Similar efficiencies can be gained on cover-holder/delegated-authority business. In the past, there have been issues with cover-holders providing coverage that takes a completely different view of risk to the syndicate or managing agent that is providing the capacity. RMS has ensured SiteIQ works for coverholders, to give them access to shared analytics, managing agent rules and an enhanced view of hazards. It is hoped this will both improve underwriting decision-making by the coverholders and strengthen delegated-authority relationships. Coverholder business continues to grow in the Lloyd’s and company markets, and delegating authorities often worry whether the risks underwritten on their behalf are done so with the best possible information available. A better scenario is when the coverholder contacts the delegating authority to ask for advice on a particular location, but receiving multiple referral calls each day from coverholders seeking decisions on individual risks can be a drain on these growing businesses’ resources. “Delegated authorities obviously want coverholders to write business doing the proper risk assessments, but on the other hand, if the coverholder is constantly pinging the managing agent for referrals, they aren’t a good partner,” says a senior manager at one MGA. “We can increase profitability if we improve our current workflow, and that can only be done with smart tools that make risk management simpler,” he notes, adding that better risk information tools would allow his company to redeploy staff. A recent Lloyd’s survey found that 55 percent of managing agents are struggling with resources in their delegated-authority teams. And with the Lloyd’s Corporation also seeking to cleanse the market of sub-par performers after swinging to a loss in 2018, any solution that drives efficiency and enables coverholders to make more informed decisions can only help drive up standards. “It was actually an idea that stemmed from our clients’ underwriting coverholder business. If we can equip coverholders with these tools, managing agents will receive fewer phone calls while being confident that the coverholder is writing good business in line with the agreed rules,” says Razzaq. “Most coverholders lack the infrastructure, budget and human resources to run complex models. With SiteIQ, RMS can now offer them deeper analytics, by leveraging expansive model science, in a more accessible way and at a more affordable price.”
Earthquake Risk: New Zealand Insurance Sector Experiences Growing Pains
Speed of change around homeowners insurance is gathering pace as insurers move to differential pricing models New Zealand’s insurance sector is undergoing fundamental change as the impact of the NZ$40 billion (US$27 billion) Canterbury Earthquake and more recent Kaikōura disaster spur efforts to create a more sustainable, risk-reflective marketplace. In 2018, EXPOSURE examined risk-based pricing in the region following Tower Insurance’s decision to adopt such an approach to achieve a “fairer and more equitable way of pricing risk.” Since then, IAG, the country’s largest general insurer, has followed suit, with properties in higher-risk areas forecast to see premium hikes, while it also adopts “a conservative approach” to providing insurance in peril-prone areas. “Insurance, unsurprisingly, is now a mainstream topic across virtually every media channel in New Zealand,” says Michael Drayton, a consultant at RMS. “There has been a huge shift in how homeowners insurance is viewed, and it will take time to adjust to the introduction of risk-based pricing.” Another market-changing development is the move by the country’s Earthquake Commission (EQC) to increase the first layer of buildings’ insurance cover it provides from NZ$100,000 to NZ$150,000 (US$68,000 to US$101,000), while lowering contents cover from NZ$20,000 (US$13,500) to zero. These changes come into force in July 2019. Modeling the average annual loss (AAL) impact of these changes based on the updated RMS New Zealand Earthquake Industry Exposure Database shows the private sector will see a marginal increase in the amount of risk it takes on as the AAL increase from the contents exit outweighs the decrease from the buildings cover hike. These findings have contributed greatly to the debate around the relationship between buildings and contents cover. One major issue the market has been addressing is its ability to accurately estimate sums insured. According to Drayton, recent events have seen three separate spikes around exposure estimates. “The first spike occurred in the aftermath of the Christchurch Earthquake,” he explains, “when there was much debate about commercial building values and limits, and confusion relating to sums insured and replacement values. “The second occurred with the move away from open-ended replacement policies in favor of sums insured for residential properties. “Now that the EQC has removed contents cover, we are seeing another spike as the private market broaches uncertainty around content-related replacement values. “There is very much an education process taking place across New Zealand’s insurance industry,” Drayton concludes. “There are multiple lessons being learned in a very short period of time. Evolution at this pace inevitably results in growing pains, but if it is to achieve a sustainable insurance market it must push on through.”
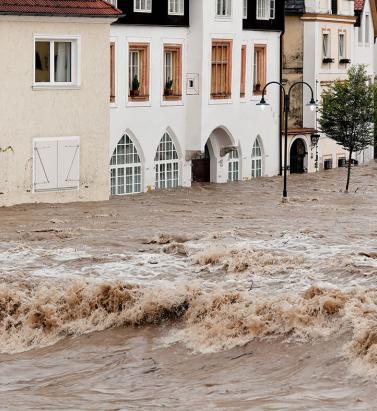
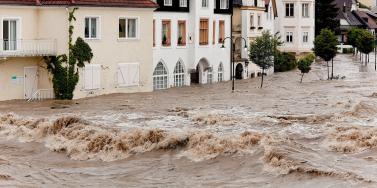
Clear Link Between Flood Losses and NAO
RMS research proves relationship between NAO and catastrophic flood events in Europe The correlation between the North Atlantic Oscillation (NAO) and European precipitation patterns is well known. However, a definitive link between phases of the NAO and catastrophic flood events and related losses had not previously been established — until now. A study by RMS published in Geophysical Research Letters has revealed a direct correlation between the NAO and the occurrence of catastrophic floods across Europe and associated economic losses. The analysis not only extrapolated a statistically significant relationship between the events, but critically showed that average flood losses during opposite NAO states can differ by up to 50 percent. A Change in Pressure The NAO’s impact on meteorological patterns is most pronounced in winter. Fluctuations in the atmospheric pressure between two semi-permanent centers of low and high pressure in the North Atlantic influence wind direction and strength as well as storm tracks. The two-pronged study combined extensive analysis of flood occurrence and peak water levels across Europe, coupled with extensive modeling of European flood events using the RMS Europe Inland Flood High-Definition (HD) Model. The data sets included HANZE-Events, a catalog of over 1,500 catastrophic European flood events between 1870 and 2016, and a recent database of the highest-recorded water levels based on data from over 4,200 weather stations. “The HD model generated a large set of potential catastrophic flood events and quantified the associated losses” “This analysis established a clear relationship between the occurrence of catastrophic flood events and the NAO phase,” explains Stefano Zanardo, principal modeler at RMS, “and confirmed that a positive NAO increased catastrophic flooding in Northern Europe, with a negative phase influencing flooding in Southern Europe. However, to ascertain the impact on actual flood losses we turned to the model.” Modeling the Loss The HD model generated a large set of potential catastrophic flood events and quantified the associated losses. It not only factored in precipitation, but also rainfall runoff, river routing and inundation processes. Critically, the precipitation incorporated the impact of a simulated monthly NAO index as a driver for monthly rainfall. “It showed that seasonal flood losses can increase or decrease by up to 50 percent between positive and negative NAOs, which is very significant,” states Zanardo. “What it also revealed were distinct regional patterns. For example, a positive state resulted in increased flood activity in the U.K. and Germany. These loss patterns provide a spatial correlation of flood risk not previously detected.” Currently, NAO seasonal forecasting is limited to a few months. However, as this window expands, the potential for carriers to factor oscillation phases into flood-related renewal and capital allocation strategies will grow. Further, greater insight into spatial correlation could support more effective portfolio management. “At this stage,” he concludes, “we have confirmed the link between the NAO and flood-related losses. How this evolves to influence carriers’ flood strategies is still to be seen, and a key factor will be advances in the NAO forecasting. What is clear is that oscillations such as the NAO must be included in model assumptions to truly understand flood risk.”


Vulnerability: In Equal Measure
As international efforts grow to minimize the disproportionate impact of disasters on specific parts of society, EXPOSURE looks at how close public/private collaboration will be critical to moving forward There is a widely held and understandable belief that large-scale disasters are indiscriminate events. They weigh out devastation in equal measure, irrespective of the gender, age, social standing or physical ability of those impacted. The reality, however, is very different. Catastrophic events expose the various inequalities within society in horrific fashion. Women, children, the elderly, people with disabilities and those living in economically deprived areas are at much greater risk than other parts of society both during the initial disaster phase and the recovery process. Cyclone Gorky, for example, which struck Bangladesh in 1991, caused in the region of 140,000 deaths — women made up 93 percent of that colossal death toll. Similarly, in the 2004 Indian Ocean Tsunami some 70 percent of the 250,000 fatalities were women. Looking at the disparity from an age-banded perspective, during the 2005 Kashmir Earthquake 10,000 schools collapsed resulting in the deaths of 19,000 children. Children also remain particularly vulnerable well after disasters have subsided. In 2014, a study by the University of San Francisco of death rates in the Philippines found that delayed deaths among female infants outnumbered reported typhoon deaths by 15-to-1 following an average typhoon season — a statistic widely attributed to parents prioritizing their male infants at a time of extreme financial difficulty. And this disaster disparity is not limited to developing nations as some may assume. Societal groups in developed nations can be just as exposed to a disproportionate level of risk. During the recent Camp Fire in California, figures revealed that residents in the town of Paradise aged 75 or over were 8 times more likely to die than the average for all other age bands. This age-related disparity was only marginally smaller for Hurricane Katrina in 2005. The Scale of the Problem These alarming statistics are now resonating at the highest levels. Growing recognition of the inequalities in disaster-related fatality ratios is now influencing global thinking on disaster response and management strategies. Most importantly, it is a central tenet of the Sendai Framework for Disaster Risk Reduction 2015–2030, which demands an “all-of-society engagement and partnership” to reduce risk that encompasses those “disproportionately affected by disasters.” Yet a fundamental problem is that disaggregated data for specific vulnerable groups is not being captured for the majority of disasters. “There is a growing acknowledgment across many nations that certain groupings within society are disproportionately impacted by disasters,” explains Alison Dobbin, principal catastrophe risk modeler at RMS. “Yet the data required to get a true sense of the scale of the problem simply isn’t being utilized and disaggregated in an effective manner post-disaster. And without exploiting and building on the data that is available, we cannot gain a working understanding of how best to tackle the multiple issues that contribute to it.” The criticality of capturing disaster datasets specific to particular groups and age bands is clearly flagged in the Sendai Framework. Under the “Guiding Principles,” the document states: “Disaster risk reduction requires a multi-hazard approach and inclusive risk-informed decision-making based on the open exchange and dissemination of disaggregated data, including by sex, age and disability, as well as on easily accessible, up-to-date, comprehensible, science-based, non-sensitive risk information, complemented by traditional knowledge.” Gathering the Data Effective data capture, however, requires a consistent approach to the collection of disaggregated information across all groups — first, to understand the specific impacts of particular perils on distinct groups, and second, to generate guidance, policies and standards for preparedness and resilience that reflect the unique sensitivities. While efforts to collect and analyze aggregated data are increasing, the complexities involved in ascertaining differentiated vulnerabilities to specific groups are becoming increasingly apparent, as Nicola Howe, lead catastrophe risk modeler at RMS, explains. “We can go beyond statistics collection, and model those factors which lead to discriminative outcomes” Nicola Howe RMS “You have to remember that social vulnerability varies from place to place and is often in a state of flux,” she says. “People move, levels of equality change, lifestyles evolve and the economic conditions in specific regions fluctuate. Take gender-based vulnerabilities for example. They tend not to be as evident in societies that demonstrate stronger levels of sexual equality. “Experiences during disasters are also highly localized and specific to the particular event or peril,” she continues. “There are multiple variables that can influence the impact on specific groups. Cultural, political and economic factors are strong influencers, but other aspects such as the time of day or the particular season can also have a significant effect on outcomes.” This creates challenges, not only for attributing specific vulnerabilities to particular groups and establishing policies designed to reduce those vulnerabilities, but also for assessing the extent to which the measures are having the desired outcomes. Establishing data consistency and overcoming the complexities posed by this universal problem will require the close collaboration of all key participants. “It is imperative that governments and NGOs recognize the important part that the private sector can play in working together and converting relevant data into the targeted insight required to support effective decision-making in this area,” says Dobbin. A Collective Response At time of writing, Dobbin and Howe were preparing to join a diverse panel of speakers at the UN’s 2019 Global Platform for Disaster Risk Reduction in Switzerland. This year’s convening marks the third consecutive conference at which RMS has participated. Previous events have seen Robert Muir-Wood, chief research officer, and Daniel Stander, global managing director, present on the resilience dividend andrisk finance. The title of this year’s discussion is “Using Gender, Age and Disability-Responsive Data to Empower Those Left Furthest Behind.” “One of our primary aims at the event,” says Howe, “will be to demonstrate the central role that the private sector, and in our case the risk modeling community, can play in helping to bridge the data gap that exists and help promote the meaningful way in which we can contribute.” The data does, in some cases, exist and is maintained primarily by governments and NGOs in the form of census data, death certificates, survey results and general studies. “Companies such as RMS provide the capabilities to convert this raw data into actionable insight,” Dobbin says. “We model from hazard, through vulnerability and exposure, all the way to the financial loss. That means we can take the data and turn it into outputs that governments and NGOs can use to better integrate disadvantaged groups into resilience planning.” But it’s not simply about getting access to the data. It is also about working closely with these bodies to establish the questions that they need answers to. “We need to understand the specific outputs required. To this end, we are regularly having conversations with many diverse stakeholders,” adds Dobbin. While to date the analytical capabilities of the risk modeling community have not been directed at the social vulnerability issue in any significant way, RMS has worked with organizations to model human exposure levels for perils. Collaborating with the Workers’ Compensation Insurance Rating Bureau of California (WCIRB), a private, nonprofit association, RMS conducted probabilistic earthquake analysis on exposure data for more than 11 million employees. This included information about the occupation of each employee to establish potential exposure levels for workers’ compensation cover in the state. “We were able to combine human exposure data to model the impact of an earthquake, ascertaining vulnerability based on where employees were likely to be, their locations, their specific jobs, the buildings they worked in and the time of day that the event occurred,” says Howe. “We have already established that we can incorporate age and gender data into the model, so we know that our technology is capable of supporting detailed analyses of this nature on a huge scale.” She continues: “We must show where the modeling community can make a tangible difference. We bring the ability to go beyond the collection of statistics post-disaster and to model those factors that lead to such strong differences in outcomes, so that we can identify where discrimination and selective outcomes are anticipated before they actually happen in disasters. This could be through identifying where people are situated in buildings at different times of day, by gender, age, disability, etc. It could be by modeling how different people by age, gender or disability will respond to a warning of a tsunami or a storm surge. It could be by modeling evacuation protocols to demonstrate how inclusive they are.” Strengthening the Synergies A critical aspect of reducing the vulnerability of specific groups is to ensure disadvantaged elements of society become more prominent components of mitigation and response planning efforts. A more people-centered approach to disaster management was a key aspect of the forerunner to the Sendai Framework, the Hyogo Framework for Action 2005–2015. The plan called for risk reduction practices to be more inclusive and engage a broader scope of stakeholders, including those viewed as being at higher risk. This approach is a core part of the “Guiding Principles” that underpin the Sendai Framework. It states: “Disaster risk reduction requires an all-of-society engagement and partnership. It also requires empowerment and inclusive, accessible and non-discriminatory participation, paying special attention to people disproportionately affected by disasters, especially the poorest. A gender, age, disability and cultural perspective should be integrated in all policies and practices, and women and youth leadership should be promoted.” The Framework also calls for the empowerment of women and people with disabilities, stating that enabling them “to publicly lead and promote gender equitable and universally accessible response, recovery, rehabilitation and reconstruction approaches.” This is a main area of focus for the U.N. event, explains Howe. “The conference will explore how we can promote greater involvement among members of these disadvantaged groups in resilience-related discussions, because at present we are simply not capitalizing on the insight that they can provide. “Take gender for instance. We need to get the views of those disproportionately impacted by disaster involved at every stage of the discussion process so that we can ensure that we are generating gender-sensitive risk reduction strategies, that we are factoring universal design components into how we build our shelters, so women feel welcome and supported. Only then can we say we are truly recognizing the principles of the Sendai Framework.”


The Future of Risk Management
(Re)insuring new and emerging risks requires data and, ideally, a historical loss record upon which to manage an exposure. But what does the future of risk management look like when so many of these exposures are intangible or unexpected? Sudden and dramatic breakdowns become more likely in a highly interconnected and increasingly polarized world, warns the “Global Risks Report 2019” from the World Economic Forum (WEF). “Firms should focus as much on risk response as on risk mitigation,” advises John Drzik, president of global risk and digital at Marsh, one of the report sponsors. “There’s an inevitability to having a certain number of shock events, and firms should focus on how to respond to fast-moving events with a high degree of uncertainty.” Macrotrends such as climate change, urbanization and digitization are all combining in a way that makes major claims more impactful when things go wrong. But are all low-probability/high-consequence events truly beyond our ability to identify and manage? Dr. Gordon Woo, catastrophist at RMS, believes that in an age of big data and advanced analytics, information is available that can help corporates, insurers and reinsurers to understand the plethora of new and emerging risks they face. “The sources of emerging risk insight are out there,” says Woo. “The challenge is understanding the significance of the information available and ensuring it is used to inform decision-makers.” However, it is not always possible to gain access to the insight needed. “Some of the near-miss data regarding new software and designs may be available online,” says Woo. “For example, with the Boeing 737 Max 8, there were postings by pilots where control problems were discussed prior to the Lion Air disaster of October 2018. Equally, intelligence information on terrorist plots may be available from online terrorist chatter. But typically, it is much harder for individuals to access this information, other than security agencies. “Peter Drucker [consultant and author] was right when he said: ‘If you can’t measure it, you can’t improve it,’” he adds. “And this is the issue for (re)insurers when it comes to emerging risks. There is currently not a lot of standardization between risk compliance systems and the way the information is gathered, and corporations are still very reluctant to give information away to insurers.” The Intangibles Protection Gap While traditional physical risks, such as fire and flood, are well understood, well modeled and widely insured, new and emerging risks facing businesses and communities are increasingly intangible and risk transfer solutions are less widely available. While there is an important upside to many technological innovations, for example, there are also downsides that are not yet fully understood or even recognized, thinks Robert Muir-Wood, chief research officer of science and technology at RMS. “Last year’s Typhoon Jebi caused coastal flooding in the Kansai region of Japan,” he says. “There were a lot of cars on the quayside close to where the storm made landfall and many of these just caught on fire. It burnt out a large number of cars that were heading for export. “The reason for the fires was the improved capability of batteries in cars,” he explains. “And when these batteries are immersed in water they burst into flames. So, with this technology you’ve created a whole new peril. There is currently not a lot of standardization between risk compliance systems and the way the information is gathered Gordon Woo RMS “As new technology emerges, new risks emerge,” he concludes. “And it’s not as though the old risks go away. They sort of morph and they always will. Clearly the more that software becomes a critical part of how things function, then there is more of an opportunity for things to go wrong.” From nonphysical-damage business interruption and reputational harm to the theft of intellectual property and a cyber data breach, the ability for underwriters to get a handle on these risks and potential losses is one of the industry’s biggest modern-day challenges. The dearth of products and services for esoteric commercial risks is known as the “intangibles protection gap,” explains Muir-Wood. “There is this question within the whole span of risk management of organizations — of which an increasing amount is intangible — whether they will be able to buy insurance for those elements of their risk that they feel they do not have control over.” While the (re)insurance industry is responding with new products and services geared toward emerging risks, such as cyber, there are some organizational perils, such as reputational risk, that are best addressed by instilling the right risk management culture and setting the tone from the top within organizations, thinks Wayne Ratcliffe, head of risk management at SCOR. “Enterprise risk management is about taking a holistic view of the company and having multidisciplinary teams brainstorming together,” he says. “It’s a tendency of human nature to work in silos in which everyone has their own domain to protect and to work on, but working across an organization is the only way to carry out proper risk management. “There are many causes and consequences of reputational risk, for instance,” he continues. “When I think of past examples where things have gone horribly wrong — and there are so many of them, from Deepwater Horizon to Enron — in certain cases there were questionable ethics and a failure in risk management culture. Companies have to set the tone at the top and then ensure it has spread across the whole organization. This requires constant checking and vigilance.” The best way of checking that risk management procedures are being adhered to is by being really close to the ground, thinks Ratcliffe. “We’re moving too far into a world of emails and communication by Skype. What people need to be doing is talking to each other in person and cross-checking facts. Human contact is essential to understanding the risk.” Spotting the Next “Black Swan” What of future black swans? As per Donald Rumsfeld’s “unknown unknowns,” so called black swan events are typically those that come from left field. They take everyone by surprise (although are often explained away in hindsight) and have an impact that cascades through economic, political and social systems in ways that were previously unimagined, with severe and widespread consequences. “As (re)insurers we can look at past data, but you have to be aware of the trends and forces at play,” thinks Ratcliffe. “You have to be aware of the source of the risk. In ‘The Big Short’ by Michael Lewis, the only person who really understood the impending subprime collapse was the one who went house-to-house asking people if they were having trouble paying their mortgages, which they were. New technologies are creating more opportunities but they’re also making society more vulnerable to sophisticated cyberattacks Wayne Ratcliffe SCOR “Sometimes you need to go out of the bounds of data analytics into a more intuition-based way of picking up signals where there is no data,” he continues. “You need imagination and to come up with scenarios that can happen based on a group of experts talking together and debating how exposures can connect and interconnect. “It’s a little dangerous to base everything on big data measurement and statistics, and at SCOR we talk about the ‘art and science of risk,’” he continues. “And science is more than statistics. We often need hard science behind what we are measuring. A single-point estimate of the measure is not sufficient. We also need confidence intervals corresponding to a range of probabilities.” In its “Global Risks Report 2019,” the WEF examines a series of “what-if” future shocks and asks if its scenarios, while not predictions, are at least “a reminder of the need to think creatively about risk and to expect the unexpected?” The WEF believes future shocks could come about as a result of advances in technology, the depletion of global resources and other major macrotrends clashing in new and extreme ways. “The world is becoming hyperconnected,” says Ratcliffe. “People are becoming more dependent on social media, which is even shaping political decisions, and organizations are increasingly connected via technology and the internet of things. New technologies are creating more opportunities but they’re also making society more vulnerable to sophisticated cyberattacks. We have to think about the systemic nature of it all.” As governments are pressured to manage the effects of climate change, for instance, will the use of weather manipulation tools — such as cloud seeding to induce or suppress rainfall — result in geopolitical conflict? Could biometrics and AI that recognize and respond to emotions be used to further polarize and/or control society? And will quantum computing render digital cryptography obsolete, leaving sensitive data exposed? The risk of cyberattack was the No. 1 risk identified by business leaders in virtually all advanced economies in the WEF’s “Global Risks Report 2019,” with concern about both data breach and direct attacks on company infrastructure causing business interruption. The report found that cyberattacks continue to pose a risk to critical infrastructure, noting the attack in July 2018 that compromised many U.S. power suppliers. In the attack, state-backed Russian hackers gained remote access to utility- company control rooms in order to carry out reconnaissance. However, in a more extreme scenario the attackers were in a position to trigger widespread blackouts across the U.S., according to the Department of Homeland Security. Woo points to a cyberattack that impacted Norsk Hydro, the company that was responsible for a massive bauxite spill at an aluminum plant in Brazil last year, with a targeted strain of ransomware known as “LockerGoga.” With an apparent motivation to wreak revenge for the environmental damage caused, hackers gained access to the company’s IT infrastructure, including the control systems at its aluminum smelting plants. He thinks a similar type of attack by state-sponsored actors could cause significantly greater disruption if the attackers’ motivation was simply to cause damage to industrial control systems. Woo thinks cyber risk has significant potential to cause a major global shock due to the interconnected nature of global IT systems. “WannaCry was probably the closest we’ve come to a cyber 911,” he explains. “If the malware had been released earlier, say January 2017 before the vulnerability was patched, losses would have been a magnitude higher as the malware would have spread like measles as there was no herd immunity. The release of a really dangerous cyber weapon with the right timing could be extremely powerful.”


Opening Pandora's Box
With each new stride in hazard research and science comes the ability to better calculate and differentiate risk Efforts by RMS scientists and engineers to better understand liquefaction vulnerability is shedding new light on the secondary earthquake hazard. However, this also makes it more likely that, unless they can charge for the risk, (re)insurance appetite will diminish for some locations while also increasing in other areas. A more differentiated approach to underwriting and pricing is an inevitable consequence of investment in academic research. Once something has been learned, it cannot be unlearned, explains Robert Muir-Wood, chief research officer at RMS. “In the old days, everybody paid the same for insurance because no one had the means to actually determine how risk varied from location to location, but once you learn how to differentiate risk well, there’s just no going back. It’s like Pandora’s box has been opened. “There are two general types of liquefaction that are just so severe that no one should build on them” Tim Ancheta RMS “At RMS we are neutral on risk,” he adds. “It’s our job to work for all parties and provide the best neutral science-based perspective on risk, whether that’s around climate change in California or earthquake risk in New Zealand. And we and our clients believe that by having the best science-based assessment of risk they can make effective decisions about their risk management.” Spotting a Gap in the Science On September 28, 2018, a large and shallow M7.5 earthquake struck Central Sulawesi, Indonesia, triggering a tsunami over 2 meters in height. The shaking and tsunami caused widespread devastation in and around the provincial capital Palu, but according to a report published by the GEER Association, it was liquefaction and landslides that caused thousands of buildings to collapse in a catastrophe that claimed over 4,000 lives. It was the latest example of a major earthquake that showed that liquefaction — where the ground moves and behaves as if it is a liquid — can be a much bigger driver of loss than previously thought. The Tōhoku Earthquake in Japan during 2011 and the New Zealand earthquakes in Christchurch in 2010 and 2011 were other high-profile examples. The earthquakes in New Zealand caused a combined insurance industry loss of US$22.8-US$26.2 billion, with widespread liquefaction undermining the structural integrity of hundreds of buildings. Liquefaction has been identified by a local engineer as causing 50 percent of the loss. Now, research carried out by RMS scientists is helping insurers and other stakeholders to better understand the impact that liquefaction can have on earthquake-related losses. It is also helping to pinpoint other parts of the world that are highly vulnerable to liquefaction following earthquake. “Before Christchurch we had not appreciated that you could have a situation where a midrise building may be completely undamaged by the earthquake shaking, but the liquefaction means that the building has suffered differential settlement leaving the floors with a slight tilt, sufficient to be declared a 100 percent loss,” explains Muir-Wood. “We realized for the first time that you actually have to model the damage separately,” he continues. “Liquefaction is completely separate to the damage caused by shaking. But in the past we treated them as much of the same. Separating out the hazards has big implications for how we go about modeling the risk, or identifying other situations where you are likely to have extreme liquefaction at some point in the future.” The Missing Link Tim Ancheta, a risk modeler for RMS based in Newark, California, is responsible for developing much of the understanding about the interaction between groundwater depth and liquefaction. Using data from the 2011 earthquake in Christchurch and boring data from numerous sites across California to calculate groundwater depth, he has been able to identify sites that are particularly prone to liquefaction. “I was hired specifically for evaluating liquefaction and trying to develop a model,” he explains. “That was one of the key goals for my position. Before I joined RMS about seven years back, I was a post-doctoral researcher at PEER — the Pacific Earthquake Engineering Research Center at Berkeley — working on ground motion research. And my doctoral thesis was on the spatial variability of ground motions.” Joining RMS soon after the earthquakes in Christchurch had occurred meant that Ancheta had access to a wealth of new data on the behavior of liquefaction. For the first time, it showed the significance of ground- water depth in determining where the hazard was likely to occur. Research, funded by the New Zealand government, included a survey of liquefaction observations, satellite imagery, a time series of groundwater levels as well as the building responses. It also included data collected from around 30,000 borings. “All that had never existed on such a scale before,” says Ancheta. “And the critical factor here was they investigated both liquefaction sites and non-liquefaction sites — prior surveys had only focused on the liquefaction sites.” Whereas the influence of soil type on liquefaction had been reasonably well understood prior to his research, previous studies had not adequately incorporated groundwater depth. “The key finding was that if you don’t have a clear understanding of where the groundwater is shallow or where it is deep, or the transition — which is important — where you go from a shallow to deep groundwater depth, you can’t turn on and off the liquefaction properly when an earthquake happens,” reveals Ancheta. Ancheta and his team have gone on to collect and digitize groundwater data, geology and boring data in California, Japan, Taiwan and India with a view to gaining a granular understanding of where liquefaction is most likely to occur. “Many researchers have said that liquefaction properties are not regionally dependent, so that if you know the geologic age or types of soils, then you know approximately how susceptible soils can be to liquefaction. So an important step for us is to validate that claim,” he explains. The ability to use groundwater depth has been one of the factors in predicting potential losses that has significantly reduced uncertainty within the RMS suite of earthquake models, concentrating the losses in smaller areas rather than spreading them over an entire region. This has clear implications for (re)insurers and policymakers, particularly as they seek to determine whether there are any “no-go” areas within cities. “There are two general types of liquefaction that are just so severe that no one should build on them,” says Ancheta. “One is lateral spreading where the extensional strains are just too much for buildings. In New Zealand, lateral spreading was observed at numerous locations along the Avon River, for instance.” California is altogether more challenging, he explains. “If you think about all the rivers that flow through Los Angeles or the San Francisco Bay Area, you can try and model them in the same way as we did with the Avon River in Christchurch. We discovered that not all rivers have a similar lateral spreading on either side of the riverbank. Where the river courses have been reworked with armored slopes or concrete linings — essentially reinforcement — it can actually mitigate liquefaction-related displacements.” The second type of severe liquefaction is called “flow slides” triggered by liquefaction, which is where the soil behaves almost like a landslide. This was the type of liquefaction that occurred in Central Sulawesi when the village of Balaroa was entirely destroyed by rivers of soil, claiming entire neighborhoods. “It’s a type of liquefaction that is extremely rare,” he adds. “but they can cause tens to hundreds of meters of displacement, which is why they are so devastating. But it’s much harder to predict the soils that are going to be susceptible to them as well as you can for other types of liquefaction surface expressions.” Ancheta is cognizant of the fact that a no-build zone in a major urban area is likely to be highly contentious from the perspective of homeowners, insurers and policymakers, but insists that now the understanding is there, it should be acted upon. “The Pandora’s box for us in the Canterbury Earthquake Sequence was the fact that the research told us where the lateral spreading would occur,” he says. “We have five earthquakes that produced lateral spreading so we knew with some certainty where the lateral spreading would occur and where it wouldn’t occur. With severe lateral spreading you just have to demolish the buildings affected because they have been extended so much.”
