


EXPOSURE
The RMS Magazine with a unique perspective and clear mission “... to provide insight and analysis to help insurance and risk professionals innovate, adapt, and deliver.”

Insurance: The next 10 years
Mohsen Rahnama, Cihan Biyikoglu and Moe Khosravy of RMS look to 2029, consider the…
Times Square, New York City
Tag: NEW ZEALAND


Location, Location, Location: A New Era in Data Resolution
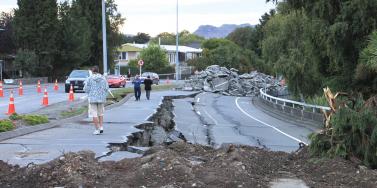
February 11, 2021The insurance industry has reached a transformational point in its ability to accurately understand the details of exposure at risk. It is the point at which three fundamental components of exposure management are coming together to enable (re)insurers to systematically quantify risk at the location level: the availability of high-resolution location data, access to the technology to capture that data and advances in modeling capabilities to use that data. Data resolution at the individual building level has increased considerably in recent years, including the use of detailed satellite imagery, while advances in data sourcing technology have provided companies with easier access to this more granular information. In parallel, the evolution of new innovations, such as RMS® High Definition Models™ and the transition to cloud-based technologies, has facilitated a massive leap forward in the ability of companies to absorb, analyze and apply this new data within their actuarial and underwriting ecosystems. Quantifying Risk Uncertainty “Risk has an inherent level of uncertainty,” explains Mohsen Rahnama, chief modeling officer at RMS. “The key is how you quantify that uncertainty. No matter what hazard you are modeling, whether it is earthquake, flood, wildfire or hurricane, there are assumptions being made. These catastrophic perils are low-probability, high-consequence events as evidenced, for example, by the 2017 and 2018 California wildfires or Hurricane Katrina in 2005 and Hurricane Harvey in 2017. For earthquake, examples include Tohoku in 2011, the New Zealand earthquakes in 2010 and 2011, and Northridge in 1994. For this reason, risk estimation based on an actuarial approach cannot be carried out for these severe perils; physical models based upon scientific research and event characteristic data for estimating risk are needed.” A critical element in reducing uncertainty is a clear understanding of the sources of uncertainty from the hazard, vulnerability and exposure at risk. “Physical models, such as those using a high-definition approach, systematically address and quantify the uncertainties associated with the hazard and vulnerability components of the model,” adds Rahnama. “There are significant epistemic (also known as systematic) uncertainties in the loss results, which users should consider in their decision-making process. This epistemic uncertainty is associated with a lack of knowledge. It can be subjective and is reducible with additional information.” What are the sources of this uncertainty? For earthquake, there is uncertainty about the ground motion attenuation functions, soil and geotechnical data, the size of the events, or unknown faults. Rahnama explains: “Addressing the modeling uncertainty is one side of the equation. Computational power enables millions of events and more than 50,000 years of simulation to be used, to accurately capture the hazard and reduce the epistemic uncertainty. Our findings show that in the case of earthquakes the main source of uncertainty for portfolio analysis is ground motion; however, vulnerability is the main driver of uncertainty for a single location.” The quality of the exposure data as the input to any mathematical models is essential to assess the risk accurately and reduce the loss uncertainty. However, exposure could represent the main source of loss uncertainty, especially when exposure data is provided in aggregate form. Assumptions can be made to disaggregate exposure using other sources of information, which helps to some degree reduce the associated uncertainty. Rahnama concludes, “Therefore, it is essential in order to minimize the uncertainty related to exposure to try to get location-level information about the exposure, in particular for the region with the potential of liquification for earthquake or for high-gradient hazard such as flood and wildfire.” A critical element in reducing that uncertainty, removing those assumptions and enhancing risk understanding is combining location-level data and hazard information. That combination provides the data basis for quantifying risk in a systematic way. Understanding the direct correlation between risk or hazard and exposure requires location-level data. The potential damage caused to a location by flood, earthquake or wind will be significantly influenced by factors such as first-floor elevation of a building, distance to fault lines or underlying soil conditions through to the quality of local building codes and structural resilience. And much of that granular data is now available and relatively easy to access. “The amount of location data that is available today is truly phenomenal,” believes Michael Young, vice president of product management at RMS, “and so much can be accessed through capabilities as widely available as Google Earth. Straightforward access to this highly detailed satellite imagery means that you can conduct desktop analysis of individual properties and get a pretty good understanding of many of the building and location characteristics that can influence exposure potential to perils such as wildfire.” Satellite imagery is already a core component of RMS model capabilities, and by applying machine learning and artificial intelligence (AI) technologies to such images, damage quantification and differentiation at the building level is becoming a much more efficient and faster undertaking — as demonstrated in the aftermath of Hurricanes Laura and Delta. “Within two days of Hurricane Laura striking Louisiana at the end of August 2020,” says Rahnama, “we had been able to assess roof damage to over 180,000 properties by applying our machine-learning capabilities to satellite images of the affected areas. We have ‘trained’ our algorithms to understand damage degree variations and can then superimpose wind speed and event footprint specifics to group the damage degrees into different wind speed ranges. What that also meant was that when Hurricane Delta struck the same region weeks later, we were able to see where damage from these two events overlapped.” The Data Intensity of Wildfire Wildfire by its very nature is a data-intensive peril, and the risk has a steep gradient where houses in the same neighborhood can have drastically different risk profiles. The range of factors that can make the difference between total loss, partial loss and zero loss is considerable, and to fully grasp their influence on exposure potential requires location-level data. The demand for high-resolution data has increased exponentially in the aftermath of recent record-breaking wildfire events, such as the series of devastating seasons in California in 2017-18, and unparalleled bushfire losses in Australia in 2019-20. Such events have also highlighted myriad deficiencies in wildfire risk assessment including the failure to account for structural vulnerabilities, the inability to assess exposure to urban conflagrations, insufficient high-resolution data and the lack of a robust modeling solution to provide insight about fire potential given the many years of drought. Wildfires in 2017 devastated the town of Paradise, California In 2019, RMS released its U.S. Wildfire HD Model, built to capture the full impact of wildfire at high resolution, including the complex behaviors that characterize fire spread, ember accumulation and smoke dispersion. Able to simulate over 72 million wildfires across the contiguous U.S., the model creates ultrarealistic fire footprints that encompass surface fuels, topography, weather conditions, moisture and fire suppression measures. “To understand the loss potential of this incredibly nuanced and multifactorial exposure,” explains Michael Young, “you not only need to understand the probability of a fire starting but also the probability of an individual building surviving. “If you look at many wildfire footprints,” he continues, “you will see that sometimes up to 60 percent of buildings within that footprint survived, and the focus is then on what increases survivability — defensible space, building materials, vegetation management, etc. We were one of the first modelers to build mitigation factors into our model, such as those building and location attributes that can enhance building resilience.” Moving the Differentiation Needle In a recent study by RMS and the Center for Insurance Policy Research, the Insurance Institute for Business and Home Safety and the National Fire Protection Association, RMS applied its wildfire model to quantifying the benefits of two mitigation strategies — structural mitigation and vegetation management — assessing hypothetical loss reduction benefits in nine communities across California, Colorado and Oregon. Young says: “By knowing what the building characteristics and protection measures are within the first 5 feet and 30 feet at a given property, we were able to demonstrate that structural modifications can reduce wildfire risk up to 35 percent, while structural and vegetation modifications combined can reduce it by up to 75 percent. This level of resolution can move the needle on the availability of wildfire insurance as it enables development of robust rating algorithms to differentiate specific locations — and means that entire neighborhoods don’t have to be non-renewed.” “By knowing what the building characteristics and protection measures are within the first 5 feet and 30 feet at a given property, we were able to demonstrate that structural modifications can reduce wildfire risk up to 35 percent, while structural and vegetation modifications combined can reduce it by up to 75 percent” Michael Young, RMS While acknowledging that modeling mitigation measures at a 5-foot resolution requires an immense granularity of data, RMS has demonstrated that its wildfire model is responsive to data at that level. “The native resolution of our model is 50-meter cells, which is a considerable enhancement on the zip-code level underwriting grids employed by some insurers. That cell size in a typical suburban neighborhood encompasses approximately three-to-five buildings. By providing the model environment that can utilize information within the 5-to-30-foot range, we are enabling our clients to achieve the level of data fidelity to differentiate risks at that property level. That really is a potential market game changer.” Evolving Insurance Pricing It is not hyperbolic to suggest that being able to combine high-definition modeling with high-resolution data can be market changing. The evolution of risk-based pricing in New Zealand is a case in point. The series of catastrophic earthquakes in the Christchurch region of New Zealand in 2010 and 2011 provided a stark demonstration of how insufficient data meant that the insurance market was blindsided by the scale of liquefaction-related losses from those events. “The earthquakes showed that the market needed to get a lot smarter in how it approached earthquake risk,” says Michael Drayton, consultant at RMS, “and invest much more in understanding how individual building characteristics and location data influenced exposure performance, particularly in relation to liquefaction. “To get to grips with this component of the earthquake peril, you need location-level data,” he continues. “To understand what triggers liquefaction, you must analyze the soil profile, which is far from homogenous. Christchurch, for example, sits on an alluvial plain, which means there are multiple complex layers of silt, gravel and sand that can vary significantly from one location to the next. In fact, across a large commercial or industrial complex, the soil structure can change significantly from one side of the building footprint to the other.” Extensive building damage in downtown Christchurch, New Zealand after 2011 earthquakeThe aftermath of the earthquake series saw a surge in soil data as teams of geotech engineers conducted painstaking analysis of layer composition. With multiple event sets to use, it was possible to assess which areas suffered soil liquefaction and from which specific ground-shaking intensity. “Updating our model with this detailed location information brought about a step-change in assessing liquefaction exposures. Previously, insurers could only assess average liquefaction exposure levels, which was of little use where you have highly concentrated risks in specific areas. Through our RMS® New Zealand Earthquake HD Model, which incorporates 100-meter grid resolution and the application of detailed ground data, it is now possible to assess liquefaction exposure potential at a much more localized level.” “Through our RMS® New Zealand Earthquake HD model, which incorporates 100-meter grid resolution and the application of detailed ground data, it is now possible to assess liquefaction exposure potential at a much more localized level” — Michael Drayton, RMS This development represents a notable market shift from community to risk-based pricing in New Zealand. With insurers able to differentiate risks at the location level, this has enabled companies such as Tower Insurance to more accurately adjust premium levels to reflect risk to the individual property or area. In its annual report in November 2019, Tower stated: “Tower led the way 18 months ago with risk-based pricing and removing cross-subsidization between low- and high-risk customers. Risk-based pricing has resulted in the growth of Tower’s portfolio in Auckland while also reducing exposure to high-risk areas by 16 percent. Tower’s fairer approach to pricing has also allowed the company to grow exposure by 4 percent in the larger, low-risk areas like Auckland, Hamilton, and Taranaki.” Creating the Right Ecosystem The RMS commitment to enable companies to put high-resolution data to both underwriting and portfolio management use goes beyond the development of HD Models™ and the integration of multiple layers of location-level data. Through the launch of RMS Risk Intelligence™, its modular, unified risk analytics platform, and the Risk Modeler™ application, which enables users to access, evaluate, compare and deploy all RMS models, the company has created an ecosystem built to support these next-generation data capabilities. Deployed within the Cloud, the ecosystem thrives on the computational power that this provides, enabling proprietary and tertiary data analytics to rapidly produce high-resolution risk insights. A network of applications — including the ExposureIQ™ and SiteIQ™ applications and Location Intelligence API — support enhanced access to data and provide a more modular framework to deliver that data in a much more customized way. “Because we are maintaining this ecosystem in the Cloud,” explains Michael Young, “when a model update is released, we can instantly stand that model side-by-side with the previous version. As more data becomes available each season, we can upload that new information much faster into our model environment, which means our clients can capitalize on and apply that new insight straightaway.” Michael Drayton adds: “We’re also offering access to our capabilities in a much more modular fashion, which means that individual teams can access the specific applications they need, while all operating in a data-consistent environment. And the fact that this can all be driven through APIs means that we are opening up many new lines of thought around how clients can use location data.” Exploring What Is Possible There is no doubt that the market is on the cusp of a new era of data resolution — capturing detailed hazard and exposure and using the power of analytics to quantify the risk and risk differentiation. Mohsen Rahnama believes the potential is huge. “I foresee a point in the future where virtually every building will essentially have its own social-security-like number,” he believes, “that enables you to access key data points for that particular property and the surrounding location. It will effectively be a risk score, including data on building characteristics, proximity to fault lines, level of elevation, previous loss history, etc. Armed with that information — and superimposing other data sources such as hazard data, geological data and vegetation data — a company will be able to systematically price risk and assess exposure levels for every asset up to the portfolio level.” “The only way we can truly assess this rapidly changing risk is by being able to systematically evaluate exposure based on high-resolution data and advanced modeling techniques that incorporate building resilience and mitigation measures” — Mohsen Rahnama, RMS Bringing the focus back to the here and now, he adds, the expanding impacts of climate change are making the need for this data transformation a market imperative. “If you look at how many properties around the globe are located just one meter above sea level, we are talking about trillions of dollars of exposure. The only way we can truly assess this rapidly changing risk is by being able to systematically evaluate exposure based on high-resolution data and advanced modeling techniques that incorporate building resilience and mitigation measures. How will our exposure landscape look in 2050? The only way we will know is by applying that data resolution underpinned by the latest model science to quantify this evolving risk.”

The Power of a Crisis
September 06, 2019As Christchurch City Council continues to build back better, will its resilience investment pay dividends when it comes to citywide insurance cover? The Canterbury Earthquake Sequence is the largest insured event in New Zealand’s history. Between September 2010 and December 2011, four major earthquakes caused damage to approximately 168,000 residential buildings. The earthquakes spawned more than 770,000 claims for the country’s Earthquake Commission (EQC) alone, resulting in a payout of around NZ$10 billion (US$6.4 billion). The private sector absorbed almost twice that, with the Insurance Council of New Zealand putting the figure at NZ$21.4 billion (as of March 31, 2019). Christchurch Art Gallery. The city’s art gallery, for example, has been retrofitted to resist even the most severe earthquake activity. Nine years on from the initial tremors, there remain over 1,200 open property claims in the private market, while the outstanding figure for the EQC stood at some 2,600 claims in February 2018. “Dealing with the property claims was extremely challenging,” explains Raf Manji, chair of the Christchurch City Council’s Finance Committee, “not just in terms of contractual issues, but because the insurance was based on building-by-building cover. And when you’re dealing with damage to so many buildings, it is going to take a very long time to agree what that damage is.” Building Back Better The need to rebuild Christchurch presented the city with an opportunity. “As American politician Rahm Emanuel once said, ‘Never let a crisis go to waste,’” says Lianne Dalziel, mayor of Christchurch. “The earthquakes provided a major opportunity to build back better and ensure we embed resilience into every aspect, from below ground up.” That commitment means that new construction, whether of above-ground assets or horizontal infrastructure, is being carried out to a level much higher than building codes dictate. “With the information, we want more informed conversations with both traditional and alternative markets about how we transfer risk more effectively” Raf Manji Christchurch City Council “We’re building to an exceptionally high standard,” states Mike Gillooly, chief resilience officer for the city. This is a relatively new public position created following Christchurch’s inclusion in the first wave of the Rockefeller Foundation’s 100 Resilient Cities program. “The city’s art gallery, for example, has been retrofitted to resist even the most severe earthquake activity,” Gillooly continues. But this dedication to resilience goes beyond the immediate rebuild. The council is also making resilience a core component of its long-term strategic planning. The city’s 2021-2051 infrastructure strategy, which covers the council’s investments in water supply, wastewater, stormwater, transport, parks, facilities, solid waste and communication technology for the next 30 years, will have resilience as its overarching theme. “This is the first time we are proactively building risk and resilience into our long-term planning framework,” states Dalziel. “We are developing a much deeper appreciation of risk and have spent considerable time understanding our infrastructure. We are also working toward a much more sophisticated engagement with risk at the community level.” “It’s not only about strengthening our physical infrastructure,” she continues. “It’s also about strengthening our social infrastructure.” “We are committed to promoting greater community well-being. We need to build up social capital by bringing people together to plan for an uncertain future. High levels of social capital accelerate recovery in the aftermath of a shock, while also creating greater inherent resilience to more slow-moving challenges, such as climate change and associated rising sea levels.” Dalziel is quick to stress the importance of insurance in all this. “There is a strong relationship between economic resilience and social resilience, and the role of insurance in facilitating both cannot be underestimated. The value of insurance does not simply equal the sum of claims paid — it’s as much about the financial and social well-being that it supports.” Making Resilience Pay Recently insurers across New Zealand have been shifting their appetite and premiums in high-hazard regions to be more reflective of the country’s risk profile. There has been a shift too in the council’s approach to insurance — a shift that is central to its resilience efforts, explains Manji. “Following the earthquakes, Lianne asked me to run for council. I was a former financial markets trader and she wanted someone onboard with a financial background. But when I joined, I was taken aback by the lack of risk understanding that I saw at the local government level.” One of his first steps was to set up an independently chaired audit and risk committee and introduce a new risk management framework — a model that has since been adopted by Auckland. “Through this new framework, we were able to establish a much more sophisticated view of risk,” he explains, “and we also launched a five-year program to document every single asset in place — both above and below ground. Having this granular level of exposure insight means we can assess our approach to mitigating, retaining and transferring risk from a much more data-informed position.” At present, Christchurch is conservatively insured. This is a very deliberate choice, however, and Manji is convinced of the benefits of this approach. “This excess capacity means we have headroom into which we can grow as we continue to construct new and reconstruct old assets. That’s a much stronger position to be in than having to return to the market seeking more limit when capacity may be limited. It also demonstrates a long-term commitment to the insurance market upon which you can have much more constructive, ongoing dialogue.” Data-Informed Dialogue Christchurch City Council has been making use of insurance capital for many years. It was the 2010-11 earthquakes, though, that spurred its focus on arming itself with increasingly higher-resolution data. “We’re now coming to the table each year with an ever more accurate picture of our exposure. Working with RMS, we’ve been able to significantly evolve our risk thinking based on a range of citywide loss scenarios, and to look at ways of creating a more effective balance between traditional and more innovative parametric-based solutions.” That desire for balance does not just apply to the source of Christchurch capital, but also what kinds of assets that capital covers. At present, while the council has secured coverage for 65 percent of the value of its above-ground structures, it has only managed to buy insurance to cover approximately 15 percent of its underground infrastructure. “The insurance market is not comfortable with providing cover for underground infrastructure because it tends not to be well understood or documented,” Manji continues. “Unlike most cities, however, we know exactly what is underground and just how resilient it is. With that information, we want to have more informed conversations — with both the traditional market and alternative providers of risk capital — about how we transfer this risk more effectively. Parametric-based solutions, for example, give us the opportunity to look beyond typical building replacement covers and take a bigger-picture view of what we want to achieve from our investment in risk transfer. “And whereas an indemnity-based policy is designed primarily to return you to where you were prior to the loss, parametric payouts can be deployed for what ever purpose you want. That flexibility — along with the speed and certainty of payout — is incredibly valuable.” For Gillooly, it is about becoming an increasingly sophisticated user of risk capital and engaging in ever more mature dialogue with the markets. “If we can demonstrate through the data and analytics that we understand the exposure, that we’ve quantified the risk and we’re investing in effective risk reduction, then the market needs to acknowledge these efforts in the form of increased capacity, reduced premiums or both. Data, analytics and risk insights will continue to be the key focus of our annual discussions with the London market — and will allow us to explore parametric insurance-linked securities with confidence too.”
Earthquake Risk: New Zealand Insurance Sector Experiences Growing Pains
May 20, 2019Speed of change around homeowners insurance is gathering pace as insurers move to differential pricing models New Zealand’s insurance sector is undergoing fundamental change as the impact of the NZ$40 billion (US$27 billion) Canterbury Earthquake and more recent Kaikōura disaster spur efforts to create a more sustainable, risk-reflective marketplace. In 2018, EXPOSURE examined risk-based pricing in the region following Tower Insurance’s decision to adopt such an approach to achieve a “fairer and more equitable way of pricing risk.” Since then, IAG, the country’s largest general insurer, has followed suit, with properties in higher-risk areas forecast to see premium hikes, while it also adopts “a conservative approach” to providing insurance in peril-prone areas. “Insurance, unsurprisingly, is now a mainstream topic across virtually every media channel in New Zealand,” says Michael Drayton, a consultant at RMS. “There has been a huge shift in how homeowners insurance is viewed, and it will take time to adjust to the introduction of risk-based pricing.” Another market-changing development is the move by the country’s Earthquake Commission (EQC) to increase the first layer of buildings’ insurance cover it provides from NZ$100,000 to NZ$150,000 (US$68,000 to US$101,000), while lowering contents cover from NZ$20,000 (US$13,500) to zero. These changes come into force in July 2019. Modeling the average annual loss (AAL) impact of these changes based on the updated RMS New Zealand Earthquake Industry Exposure Database shows the private sector will see a marginal increase in the amount of risk it takes on as the AAL increase from the contents exit outweighs the decrease from the buildings cover hike. These findings have contributed greatly to the debate around the relationship between buildings and contents cover. One major issue the market has been addressing is its ability to accurately estimate sums insured. According to Drayton, recent events have seen three separate spikes around exposure estimates. “The first spike occurred in the aftermath of the Christchurch Earthquake,” he explains, “when there was much debate about commercial building values and limits, and confusion relating to sums insured and replacement values. “The second occurred with the move away from open-ended replacement policies in favor of sums insured for residential properties. “Now that the EQC has removed contents cover, we are seeing another spike as the private market broaches uncertainty around content-related replacement values. “There is very much an education process taking place across New Zealand’s insurance industry,” Drayton concludes. “There are multiple lessons being learned in a very short period of time. Evolution at this pace inevitably results in growing pains, but if it is to achieve a sustainable insurance market it must push on through.”


Opening Pandora's Box
May 20, 2019With each new stride in hazard research and science comes the ability to better calculate and differentiate risk Efforts by RMS scientists and engineers to better understand liquefaction vulnerability is shedding new light on the secondary earthquake hazard. However, this also makes it more likely that, unless they can charge for the risk, (re)insurance appetite will diminish for some locations while also increasing in other areas. A more differentiated approach to underwriting and pricing is an inevitable consequence of investment in academic research. Once something has been learned, it cannot be unlearned, explains Robert Muir-Wood, chief research officer at RMS. “In the old days, everybody paid the same for insurance because no one had the means to actually determine how risk varied from location to location, but once you learn how to differentiate risk well, there’s just no going back. It’s like Pandora’s box has been opened. “There are two general types of liquefaction that are just so severe that no one should build on them” Tim Ancheta RMS “At RMS we are neutral on risk,” he adds. “It’s our job to work for all parties and provide the best neutral science-based perspective on risk, whether that’s around climate change in California or earthquake risk in New Zealand. And we and our clients believe that by having the best science-based assessment of risk they can make effective decisions about their risk management.” Spotting a Gap in the Science On September 28, 2018, a large and shallow M7.5 earthquake struck Central Sulawesi, Indonesia, triggering a tsunami over 2 meters in height. The shaking and tsunami caused widespread devastation in and around the provincial capital Palu, but according to a report published by the GEER Association, it was liquefaction and landslides that caused thousands of buildings to collapse in a catastrophe that claimed over 4,000 lives. It was the latest example of a major earthquake that showed that liquefaction — where the ground moves and behaves as if it is a liquid — can be a much bigger driver of loss than previously thought. The Tōhoku Earthquake in Japan during 2011 and the New Zealand earthquakes in Christchurch in 2010 and 2011 were other high-profile examples. The earthquakes in New Zealand caused a combined insurance industry loss of US$22.8-US$26.2 billion, with widespread liquefaction undermining the structural integrity of hundreds of buildings. Liquefaction has been identified by a local engineer as causing 50 percent of the loss. Now, research carried out by RMS scientists is helping insurers and other stakeholders to better understand the impact that liquefaction can have on earthquake-related losses. It is also helping to pinpoint other parts of the world that are highly vulnerable to liquefaction following earthquake. “Before Christchurch we had not appreciated that you could have a situation where a midrise building may be completely undamaged by the earthquake shaking, but the liquefaction means that the building has suffered differential settlement leaving the floors with a slight tilt, sufficient to be declared a 100 percent loss,” explains Muir-Wood. “We realized for the first time that you actually have to model the damage separately,” he continues. “Liquefaction is completely separate to the damage caused by shaking. But in the past we treated them as much of the same. Separating out the hazards has big implications for how we go about modeling the risk, or identifying other situations where you are likely to have extreme liquefaction at some point in the future.” The Missing Link Tim Ancheta, a risk modeler for RMS based in Newark, California, is responsible for developing much of the understanding about the interaction between groundwater depth and liquefaction. Using data from the 2011 earthquake in Christchurch and boring data from numerous sites across California to calculate groundwater depth, he has been able to identify sites that are particularly prone to liquefaction. “I was hired specifically for evaluating liquefaction and trying to develop a model,” he explains. “That was one of the key goals for my position. Before I joined RMS about seven years back, I was a post-doctoral researcher at PEER — the Pacific Earthquake Engineering Research Center at Berkeley — working on ground motion research. And my doctoral thesis was on the spatial variability of ground motions.” Joining RMS soon after the earthquakes in Christchurch had occurred meant that Ancheta had access to a wealth of new data on the behavior of liquefaction. For the first time, it showed the significance of ground- water depth in determining where the hazard was likely to occur. Research, funded by the New Zealand government, included a survey of liquefaction observations, satellite imagery, a time series of groundwater levels as well as the building responses. It also included data collected from around 30,000 borings. “All that had never existed on such a scale before,” says Ancheta. “And the critical factor here was they investigated both liquefaction sites and non-liquefaction sites — prior surveys had only focused on the liquefaction sites.” Whereas the influence of soil type on liquefaction had been reasonably well understood prior to his research, previous studies had not adequately incorporated groundwater depth. “The key finding was that if you don’t have a clear understanding of where the groundwater is shallow or where it is deep, or the transition — which is important — where you go from a shallow to deep groundwater depth, you can’t turn on and off the liquefaction properly when an earthquake happens,” reveals Ancheta. Ancheta and his team have gone on to collect and digitize groundwater data, geology and boring data in California, Japan, Taiwan and India with a view to gaining a granular understanding of where liquefaction is most likely to occur. “Many researchers have said that liquefaction properties are not regionally dependent, so that if you know the geologic age or types of soils, then you know approximately how susceptible soils can be to liquefaction. So an important step for us is to validate that claim,” he explains. The ability to use groundwater depth has been one of the factors in predicting potential losses that has significantly reduced uncertainty within the RMS suite of earthquake models, concentrating the losses in smaller areas rather than spreading them over an entire region. This has clear implications for (re)insurers and policymakers, particularly as they seek to determine whether there are any “no-go” areas within cities. “There are two general types of liquefaction that are just so severe that no one should build on them,” says Ancheta. “One is lateral spreading where the extensional strains are just too much for buildings. In New Zealand, lateral spreading was observed at numerous locations along the Avon River, for instance.” California is altogether more challenging, he explains. “If you think about all the rivers that flow through Los Angeles or the San Francisco Bay Area, you can try and model them in the same way as we did with the Avon River in Christchurch. We discovered that not all rivers have a similar lateral spreading on either side of the riverbank. Where the river courses have been reworked with armored slopes or concrete linings — essentially reinforcement — it can actually mitigate liquefaction-related displacements.” The second type of severe liquefaction is called “flow slides” triggered by liquefaction, which is where the soil behaves almost like a landslide. This was the type of liquefaction that occurred in Central Sulawesi when the village of Balaroa was entirely destroyed by rivers of soil, claiming entire neighborhoods. “It’s a type of liquefaction that is extremely rare,” he adds. “but they can cause tens to hundreds of meters of displacement, which is why they are so devastating. But it’s much harder to predict the soils that are going to be susceptible to them as well as you can for other types of liquefaction surface expressions.” Ancheta is cognizant of the fact that a no-build zone in a major urban area is likely to be highly contentious from the perspective of homeowners, insurers and policymakers, but insists that now the understanding is there, it should be acted upon. “The Pandora’s box for us in the Canterbury Earthquake Sequence was the fact that the research told us where the lateral spreading would occur,” he says. “We have five earthquakes that produced lateral spreading so we knew with some certainty where the lateral spreading would occur and where it wouldn’t occur. With severe lateral spreading you just have to demolish the buildings affected because they have been extended so much.”


A Risk-Driven Business
September 05, 2018Following Tower Insurance’s switch to risk-based pricing in New Zealand, EXPOSURE examines how recent market developments may herald a more fundamental industry shift The ramifications of the Christchurch earthquakes of 2010-11 continue to reverberate through the New Zealand insurance market. The country’s Earthquake Commission (EQC), which provides government-backed natural disaster insurance, is forecast to have paid around NZ$11 billion (US$7.3 billion) by the time it settles its final claim. The devastating losses exposed significant shortfalls in the country’s insurance market. These included major deficiencies in insurer data, gaps in portfolio management and expansive policy wordings that left carriers exposed to numerous unexpected losses. Since then, much has changed. Policy terms have been tightened, restrictions have been introduced on coverage and concerted efforts have been made to bolster databases. On July 1, 2019, the EQC increased the cap limit on the government-mandated residential cover it provides to all householders from NZ$100,000 (US$66,000) (a figure set in 1993) to NZ$150,000. A significant increase, but well below the average house price in New Zealand as of December 2017, which stood at NZ$669,565, and an average rebuild cost of NZ$350,000. It has also removed contents coverage. More recently, however, one development has taken place that has the potential to have a much more profound impact on the market. Risk-Based Pricing In March 2018, New Zealand insurer Tower Insurance announced a move to risk-based pricing for home insurance. It aims to ensure premium levels are commensurate with individual property risk profiles, with those in highly exposed areas experiencing a price rise on the earthquake component of their coverage. Describing the shift as a “fairer and more equitable way of pricing risk,” Tower CEO Richard Harding says this was the “right thing to do” both for the “long-term benefit of New Zealand” and for customers, with risk-based pricing “the fairest way to distribute the costs we face as an insurer.” The move has generated much media coverage, with stories highlighting instances of triple-digit percentage hikes in earthquake-prone regions such as Wellington. Yet, what has generated significantly fewer column inches has been the marginal declines available to the vast majority of households in the less seismically active regions, as the high-risk earthquake burden on their premium is reduced. A key factor in Tower’s decision was the increasing quality and granularity of the underwriting data at its disposal. “Tower has always focused on the quality of its data and has invested heavily in ensuring it has the highest-resolution information available,” says Michael Drayton, senior risk modeler for RMS, based in New Zealand. “The earthquakes generated the most extensive liquefaction in a built-up area seen in a developed country” Michael Drayton RMS In fact, in the aftermath of the Christchurch earthquakes, RMS worked with Tower as RMS rebuilt its New Zealand High-Definition (HD) Earthquake Model due to the caliber of their data. Prior to the earthquake, claims data was in very short supply given that there had been few previous events with large-scale impacts on highly built-up areas. “On the vulnerability side,” Drayton explains, “we had virtually no local claims data to build our damage functions. Our previous model had used comparisons of building performance in other earthquake-exposed regions. After Christchurch, we suddenly had access to billions of dollars of claims information.” RMS sourced data from numerous parties, including EQC and Tower, as well as geoscience research firm GNS Science, as it reconstructed the model from this swell of data. “RMS had a model that had served the market well for many years,” he explains. “On the hazard side, the fundamentals remained the same — the highest hazard is along the plate boundary, which runs offshore along the east coast of North Island traversing over to the western edge of South Island. But we had now gathered new information on fault lines, activity rates, magnitudes and subduction zones. We also updated our ground motion prediction equations.” One of the most high-profile model developments was the advanced liquefaction module. “The 2010-11 earthquakes generated probably the most extensive liquefaction in a built-up area seen in a developed country. With the new information, we were now able to capture the risk at much higher gradients and in much greater resolution,” says Drayton. This data surge enabled RMS to construct its New Zealand Earthquake HD Model on a variable resolution grid set at a far more localized level. In turn, this has helped give Tower sufficient confidence in the granularity and accuracy of its data at the property level to adopt risk-based pricing. The Ripple Effects As homeowners received their renewal notices, the reality of risk-based pricing started to sink in. Tower is the third-largest insurer for domestic household, contents and private motor cover in New Zealand and faces stiff competition. Over 70 percent of the market is in the hands of two players, with IAG holding around 47 percent and Suncorp approximately 25 percent. News reports also suggested movement from the larger players. AMI and State, both owned by IAG, announced that three-quarters of its policyholders — those at heightened risk of earthquake, landslide or flood — will see an average annual premium increase of NZ$91 (US$60); the remaining quarter at lower risk will see decreases averaging NZ$54 per year. A handful of households could see increases or decreases of up to NZ$1,000. According to the news website Stuff, IAG has not changed premiums for its NZI policyholders, with NZI selling house insurance policies through brokers. “One interesting dynamic is that a small number of start-ups are now entering the market with the same risk-based pricing stance taken by Tower,” Drayton points out. “These are companies with new purpose-built IT systems that are small and nimble and able to target niche sectors.” “It’s certainly a development to watch closely,” he continues, “as it raises the potential for larger players, if they are not able to respond effectively, being selected against. It will be interesting to see if the rate of these new entrants increases.” The move from IAG suggests risk-based pricing will extend beyond the earthquake component of cover to flood-related elements. “Flood is not a reinsurance peril for New Zealand, but it is an attritional one,” Drayton points out. “Then there is the issue of rising sea levels and the potential for coastal flooding, which is a major cause for concern. So, the risk-based pricing shift is feeding into climate change discussions too.” A Fundamental Shift Policyholders in risk-exposed areas such as Wellington were almost totally unaware of how much higher their insurance should be based on their property exposure, largely shielded away from the risk reality of earthquakes in recent years. The move to risk-based pricing will change that. “The market shifts we are seeing today pose a multitude of questions and few clear answers” Michael Drayton RMS Drayton agrees that recent developments are opening the eyes of homeowners. “There is a growing realization that New Zealand’s insurance market has operated very differently from other insurance markets and that that is now changing.” One major marketwide development in recent years has been the move from full replacement cover to fixed sums insured in household policies. “This has a lot of people worried they might not be covered,” he explains. “Whereas before, people simply assumed that in the event of a big loss the insurer would cover it all, now they’re slowly realizing it no longer works like that. This will require a lot of policyholder education and will take time.” At a more foundational level, current market dynamics also address the fundamental role of insurance, exposing the conflicted role of the insurer as both a facilitator of risk pooling and a profit-making enterprise. When investment returns outweighed underwriting profit, it appeared as if cross-subsidization wasn’t a big issue. However, current dynamics has meant the operating model is squarely focused on underwriting returns — to favor risk-based pricing. Cross-subsidization is the basis upon which EQC is built, but is it fair? Twenty cents in every NZ$100 (US$66) of home or contents fire insurance premium, up to a maximum of NZ$100,000 insured, is passed on to the EQC. While to date there has been limited government response to risk-based pricing, it is monitoring the situation closely given the broader implications. Looking globally, in an RMS blog, chief research officer Robert Muir-Wood also raises the question whether “flat-rated” schemes, like the French cat nat scheme, will survive now that it has become clear how to use risk models to calculate the wide differentials in the underlying cost of the risk. He asks whether “such schemes are established in the name of ‘solidarity’ or ignorance?” While there is no evidence yet, current developments raise the potential for certain risks to become uninsurable. Increasingly granular data combined with the drive for greater profitability may cause a downward spiral in a market built on a shared burden. Drayton adds: “Potential uninsurability has more to do with land-use planning and building consent regimes, and insurers shouldn’t be paying the price for poor planning decisions. Ironically, earthquake loading codes are very sophisticated and have evolved to recognize the fine gradations in earthquake risk provided by localized data. In fact, they are so refined that structural engineers remark that they are too nuanced and need to be simpler. But if you are building in a high-risk area, it’s not just designing for the hazard, it is also managing the potential financial risk.” He concludes: “The market shifts we are seeing today pose a multitude of questions and few clear answers. However, the only constant running through all these discussions is that they are all data driven.” Making the Move Key to understanding the rationale behind the shift to risk-based pricing is understanding the broader economic context of New Zealand, says Tower CEO Richard Harding. “The New Zealand economy is comparatively small,” he explains, “and we face a range of unique climatic and geological risks. If we don’t plan for and mitigate these risks, there is a chance that reinsurers will charge insurers more or restrict cover. “Before this happens, we need to educate the community, government, councils and regulators, and by moving toward risk-based pricing, we’re putting a signal into the market to drive social change through these organizations. “These signals will help demonstrate to councils and government that more needs to be done to plan for and mitigate natural disasters and climate change.” Harding feels that this risk-based pricing shift is a natural market evolution. “When you look at global trends, this is happening around the world. So, given that we face a number of large risks here in New Zealand, in some respects, it’s surprising it hasn’t happened sooner,” he says. While some parties have raised concerns that there may be a fall in insurance uptake in highly exposed regions, Harding does not believe this will be the case. “For the average home, insurance may be more expensive than it currently is, but it won’t be unattainable,” he states. Moving forward, he says that Tower is working to extend its risk-based pricing approach beyond the earthquake component of its cover, stating that the firm “is actively pursuing risk-based pricing for flood and other natural perils, and over the long term we would expect other insurers to follow in our footsteps.” In terms of the potential wider implications if this occurs, Harding says that such a development would compel government, councils and other organizations to change how they view risk in their planning processes. “I think it will start to drive customers to consider risk more holistically and take this into account when they build and buy homes,” he concludes.
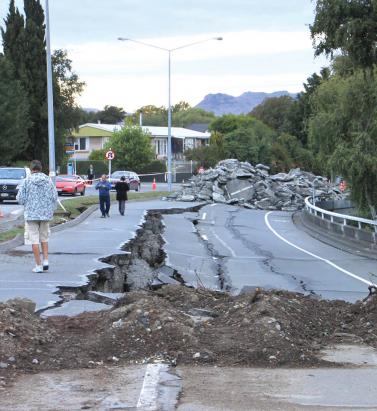
Learning From New Zealand to Avoid Surprises
July 25, 2016Secondary hazards, such as liquefaction, and the earthquake sequencing that hit the low-seismicity area of Canterbury, New Zealand, in 2010 and 2011 contributed significantly to the overall loss figures, explains RMS seismology expert Megan Arnold. The phenomenon of “loss creep” has long been an issue associated with major catastrophes, and slight revisions in expected losses are to be expected. However, when unanticipated losses occur and an insurance or reinsurance company radically revises its loss figures upwards there can be a detrimental impact on the business. “When unanticipated losses occur and an insurance or reinsurance company radically revises its loss figures upwards there can be a detrimental impact on the business.” While catastrophe models and exposure management tools have evolved considerably, every major catastrophe is a necessary learning experience. This includes the 2010 and 2011 Canterbury earthquake sequence in New Zealand. Figure 1. Example of liquefaction that caused significant damage to buildings during the Canterbury earthquake sequence. The photo was taken during the RMS reconnaissance trip to Christchurch after the February 22, 2011, earthquake. The magnitude 7.1 earthquake in September 2010 on an unknown fault in Canterbury, which was previously thought to be a low seismic-hazard area, caused surprisingly widespread damage, but no loss of life. This started a sequence of 17 loss-causing earthquakes in the region, lasting over a year. It was the magnitude 6.3 event – right beneath the city of Christchurch on February 22, 2011 – that proved deadly. Many buildings that had been damaged and weakened in earlier quakes were reduced to rubble, and 182 people died. In addition to this low-seismicity area suddenly experiencing earthquake shake damage, the main unanticipated losses were from the unprecedented amount of liquefaction, when saturated or partially saturated soil substantially loses strength causing it to behave like a liquid. This phenomenon produced so much damage that thousands of residential homes in the region were found to be situated on land with liquefaction susceptibility too hazardous for repairs or rebuilding. They were subsequently designated within the government red zone and demolished. The impact of repeated events and the large amount of liquefaction created progressive damage during the 2010-2011 Canterbury earthquake sequence, significantly confusing the loss picture and prolonging the loss adjusting and claims settlement process. The New Zealand Earthquake Commission (EQC) and private insurers are still settling outstanding Canterbury earthquake claims five years later. “These important enhancements to the model’s liquefaction loss component offer a more precise tool with which to gauge the likely impact of this secondary earthquake hazard on a book of business.” The 2010-2011 earthquakes presented an important opportunity to learn more about the behavior of liquefaction. The Natural Hazards Research Platform, EQC and many local agencies in New Zealand funded the collection of liquefaction observation data across Christchurch. This extensive, high-quality data reveals several key observations, including: The spatial extent of the observed liquefaction during the February 2, 2011, M6.3 event corresponds well to the shallow groundwater zones in the area of Christchurch, but not where the groundwater is deeper. The observations confirm that groundwater depth is an important factor in predicting liquefaction initiation. There is significant spatial variation in the liquefaction-related ground displacements over short distances. To account for these large differences in severity over short distances, the modeling methods need to map liquefaction severity parameters for localized variations where possible. Two primary failure mechanisms cause the severe ground displacements, predominantly vertical deformation as well as more laterally induced ground displacement. The Christchurch liquefaction data shows a probable correlation between ground displacement severity and damage. Lateral deformation is found to be more damaging than vertical displacement. Figure 2. Example of lateral spreading that caused severe damage to buildings and infrastructure in Christchurch during the February 22, 2011, earthquake. The photo was taken during the RMS reconnaissance trip to Christchurch. Learning from the earthquakes using observational data and our own research, RMS incorporates four innovations in liquefaction loss modeling into the RMS® New Zealand Earthquake HD Model to help firms better predict the occurrence and severity of liquefaction: Innovation 1: New geospatial methods that map groundwater-well data and near-surface groundwater depth to better determine regions of high liquefaction susceptibility across the country, including low-seismicity areas. Innovation 2: New geospatial methods that use site-specific liquefaction borehole data to create maps that delineate liquefaction initiation potential and severity parameters. Innovation 3: New methods of predicting where liquefaction could result in horizontal displacement. Innovation 4: New analysis of empirical building fragility to liquefaction based on the Christchurch observation data and insurance claims. These important enhancements to the model’s liquefaction loss component offer a more precise tool with which to gauge the likely impact of this secondary earthquake hazard on a book of business by enabling firms to predict a more granular scale loss from liquefaction. The developments have improved how RMS earthquake models determine the spatial pattern of liquefaction initiation, the liquefaction severity at the ground surface (if initiated) and expected building responses to liquefaction-induced ground displacements.
