Secondary hazards, such as liquefaction, and the earthquake sequencing that hit the low-seismicity area of Canterbury, New Zealand, in 2010 and 2011 contributed significantly to the overall loss figures, explains RMS seismology expert Megan Arnold.
The phenomenon of “loss creep” has long been an issue associated with major catastrophes, and slight revisions in expected losses are to be expected. However, when unanticipated losses occur and an insurance or reinsurance company radically revises its loss figures upwards there can be a detrimental impact on the business.
“When unanticipated losses occur and an insurance or reinsurance company radically revises its loss figures upwards there can be a detrimental impact on the business.”
While catastrophe models and exposure management tools have evolved considerably, every major catastrophe is a necessary learning experience. This includes the 2010 and 2011 Canterbury earthquake sequence in New Zealand.

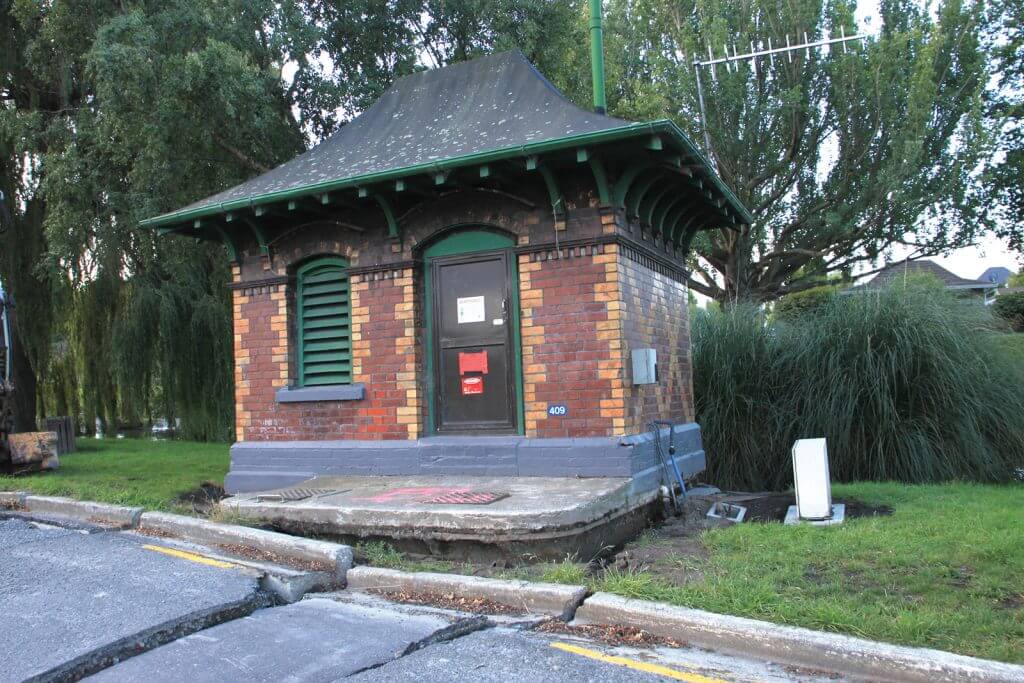
Figure 1. Example of liquefaction that caused significant damage to buildings during the Canterbury earthquake sequence. The photo was taken during the RMS reconnaissance trip to Christchurch after the February 22, 2011, earthquake.
The magnitude 7.1 earthquake in September 2010 on an unknown fault in Canterbury, which was previously thought to be a low seismic-hazard area, caused surprisingly widespread damage, but no loss of life. This started a sequence of 17 loss-causing earthquakes in the region, lasting over a year. It was the magnitude 6.3 event – right beneath the city of Christchurch on February 22, 2011 – that proved deadly. Many buildings that had been damaged and weakened in earlier quakes were reduced to rubble, and 182 people died.
In addition to this low-seismicity area suddenly experiencing earthquake shake damage, the main unanticipated losses were from the unprecedented amount of liquefaction, when saturated or partially saturated soil substantially loses strength causing it to behave like a liquid. This phenomenon produced so much damage that thousands of residential homes in the region were found to be situated on land with liquefaction susceptibility too hazardous for repairs or rebuilding. They were subsequently designated within the government red zone and demolished.
The impact of repeated events and the large amount of liquefaction created progressive damage during the 2010-2011 Canterbury earthquake sequence, significantly confusing the loss picture and prolonging the loss adjusting and claims settlement process. The New Zealand Earthquake Commission (EQC) and private insurers are still settling outstanding Canterbury earthquake claims five years later.
“These important enhancements to the model’s liquefaction loss component offer a more precise tool with which to gauge the likely impact of this secondary earthquake hazard on a book of business.”
The 2010-2011 earthquakes presented an important opportunity to learn more about the behavior of liquefaction. The Natural Hazards Research Platform, EQC and many local agencies in New Zealand funded the collection of liquefaction observation data across Christchurch. This extensive, high-quality data reveals several key observations, including:
- The spatial extent of the observed liquefaction during the February 2, 2011, M6.3 event corresponds well to the shallow groundwater zones in the area of Christchurch, but not where the groundwater is deeper. The observations confirm that groundwater depth is an important factor in predicting liquefaction initiation.
- There is significant spatial variation in the liquefaction-related ground displacements over short distances. To account for these large differences in severity over short distances, the modeling methods need to map liquefaction severity parameters for localized variations where possible.
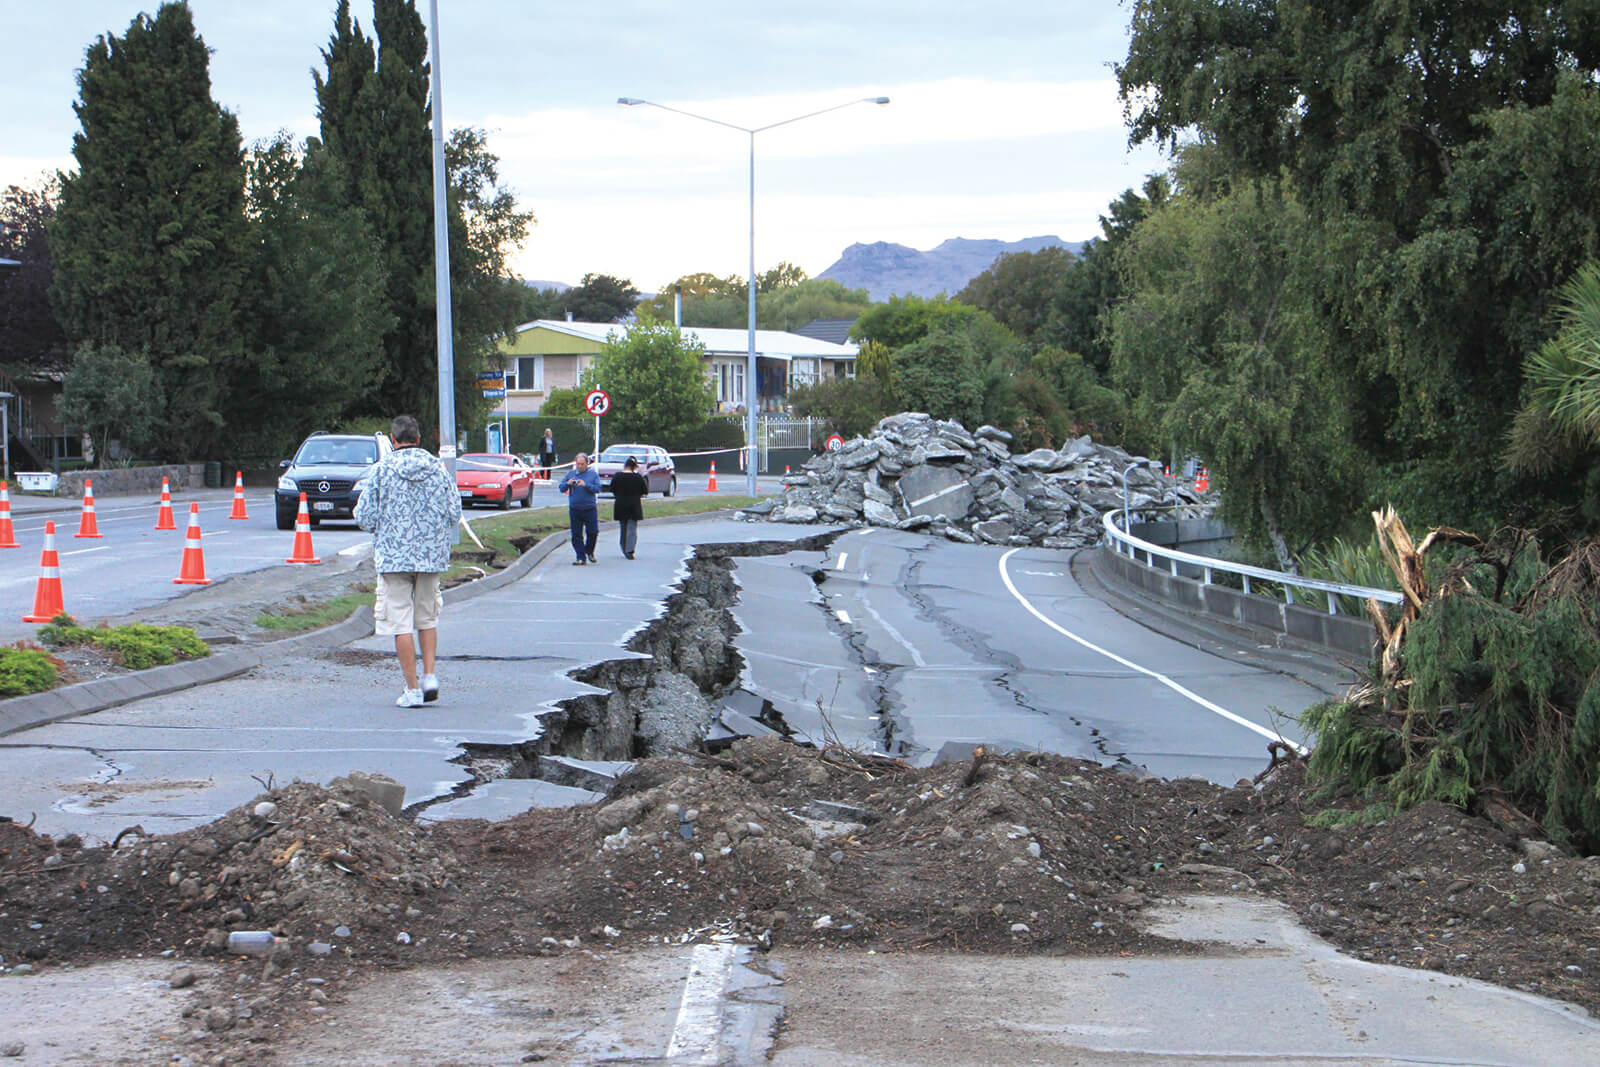
- Two primary failure mechanisms cause the severe ground displacements, predominantly vertical deformation as well as more laterally induced ground displacement.
- The Christchurch liquefaction data shows a probable correlation between ground displacement severity and damage. Lateral deformation is found to be more damaging than vertical displacement.

Figure 2. Example of lateral spreading that caused severe damage to buildings and infrastructure in Christchurch during the February 22, 2011, earthquake. The photo was taken during the RMS reconnaissance trip to Christchurch.
Learning from the earthquakes using observational data and our own research, RMS incorporates four innovations in liquefaction loss modeling into the RMS® New Zealand Earthquake HD Model to help firms better predict the occurrence and severity of liquefaction:
Innovation 1: New geospatial methods that map groundwater-well data and near-surface groundwater depth to better determine regions of high liquefaction susceptibility across the country, including low-seismicity areas.
Innovation 2: New geospatial methods that use site-specific liquefaction borehole data to create maps that delineate liquefaction initiation potential and severity parameters.
Innovation 3: New methods of predicting where liquefaction could result in horizontal displacement.
Innovation 4: New analysis of empirical building fragility to liquefaction based on the Christchurch observation data and insurance claims.
These important enhancements to the model’s liquefaction loss component offer a more precise tool with which to gauge the likely impact of this secondary earthquake hazard on a book of business by enabling firms to predict a more granular scale loss from liquefaction. The developments have improved how RMS earthquake models determine the spatial pattern of liquefaction initiation, the liquefaction severity at the ground surface (if initiated) and expected building responses to liquefaction-induced ground displacements.


