


EXPOSURE
The RMS Magazine with a unique perspective and clear mission “... to provide insight and analysis to help insurance and risk professionals innovate, adapt, and deliver.”

Insurance: The next 10 years
Mohsen Rahnama, Cihan Biyikoglu and Moe Khosravy of RMS look to 2029, consider the…
Times Square, New York City
Reset Filters
Tech
- 2022
- 2021
- 2020
- 2019
- 2018
- 2017
- 2016

RMS HWind Hurricane Forecasting and Response and ExposureIQ: Exposure Management Without the Grind
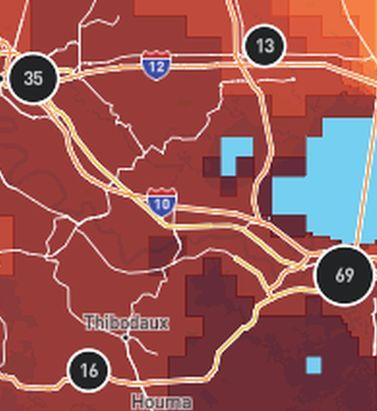
Accessing data in real-time to assess and manage an insurance carrier’s potential liabilities from a loss event remains the holy grail for exposure management teams and is high on a business’ overall wish list A 2021 PwC Pulse Survey of U.S. risk management leaders found that risk executives are increasingly taking advantage of “tech solutions for real-time and automated processes, including dynamic risk monitoring (30 percent), new risk management tech solutions (25 percent), data analytics (24 percent) [and] integrated risk management tools on a single platform (19 percent)”. PwC suggested that as part of an organization’s wider digital and business transformation process, risk management teams should therefore: “use technologies that work together, draw on common data sources, build enterprise-wide analytics and define common sets of metrics.” Separately, Deloitte’s 2021 third-party risk management (TPRM) survey found that 53 percent of respondents across a range of industry sectors wanted to improve real-time information, risk metrics, and reporting in their organizations. With the pandemic providing the unlikely backdrop for driving innovation across the business world, the Deloitte survey explained the statistic with the suggestion that one impact of COVID-19 “has been a greater need for real-time continuous assessment and alerts, rather than traditional point-in-time third-party assessment.” Event Forecasting and Response with HWind and ExposureIQ Natural catastrophe events are a risk analytics flash point. And while growing board-level awareness of the importance of real-time reporting might seem like a positive, without marrying the data with the right tools to gather and process that data, together with a more integrated approach to risk management and modeling functions, the pain points for exposure managers on the event frontline, are unlikely to be relieved. RMS® ExposureIQ™ is an exposure management application available on the cloud-native RMS Intelligent Risk Platform™, which enables clients to centralize exposure data, process it, write direct reports and then run deterministic scenarios to quickly and accurately assess their exposure. When an event is threatening or impacts risks, an exposure management team needs to rapidly process the available data to work out their overall exposure and the likely effect on insured assets. The integration of event response data such as HWind into the ExposureIQ application is where the acquisition of this hazard data really starts to make a difference. The 2022 North Atlantic hurricane season, for example, is upon us, and access to regular, real-time data is relied upon as a crucial part of event response to tropical cyclones. With reliable event response analytics, updated in real-time, businesses can get fully prepared and ensure solvency through additional reinsurance cover, more accurately reserve funds, and confidently communicate risk to all stakeholders. The National Oceanic and Atmospheric Administration’s (NOAA) National Hurricane Center (NHC) has long been viewed as a valuable resource for forecasts on the expected track and severity of hurricanes. However, according to Callum Higgins, product manager, global climate, at RMS, “There are some limitations with what you get [from the NHC]. Forecasts lack detailed insights into the spatial variability of hazard severity and while uncertainty is accounted for, this is based on historical data rather than the forecast uncertainty specific to the storm. Hurricane Henri in 2021 was a good example of this. While the ultimate landfall location fell outside the NHC ‘cone of uncertainty’ four days in advance of landfall, given the large model uncertainty in the track for Henri, HWind forecasts were able to account for this possibility.” Introducing HWind RMS HWind provides observation-based tropical cyclone data for both real-time and historical events and was originally developed as a data service for the NHC by renowned meteorologist Dr. Mark Powell. It combines the widest set of observations for a particular storm in order to create the most accurate representation of its wind field. Since RMS acquired HWind in 2015, it has continually evolved as a solution that can be leveraged more easily by insurers to benefit individual use cases. HWind provides snapshots (instantaneous views of the storm’s wind field) and cumulative footprints (past swaths of the maximum wind speeds) every six hours. In addition, RMS delivers hurricane forecast data that includes a series of forecast scenarios of both the wind and surge hazard, enabling users to understand the potential severity of the event up to five days in advance of landfall. “Because HWind real-time products are released up to every six hours, you can adapt your response as forecasts shift. After an event has struck you very quickly get a good view of which areas have been impacted and to what level of severity,” explains Higgins. The level of detail is another key differentiator. In contrast to the NHC forecasts, which do not include a detailed wind field, HWind provides much more data granularity, with forecast wind and surge scenarios developed by leveraging the RMS North Atlantic Hurricane Models. Snapshots and cumulative footprints, meanwhile, represent the wind field on a 1x1 kilometer grid. And while the NHC does provide uncertainty metrics in its forecasts, such as the “cone of uncertainty” around where the center of the storm will track, these are typically based on historical statistics. “HWind accounts for the actual level of model convergence for a particular storm. That provides you with the insights you need to make decisions around how much confidence to place in each forecast, including whether a more conservative approach is required in cases of heightened uncertainty,” Higgins explains. HWind’s observational approach and access to more than 30 data sources, some of which are exclusive to RMS, means users are better able to capture a particular wind field and apply that data across a wide variety of use cases. Some HWind clients – most notably, Swiss Re – also use it as a trigger for parametric insurance policies. “That’s a critical component for some of our clients,” says Higgins. “For a parametric trigger, you want to make sure you have as accurate as possible a view of the wind speed experienced at underwritten locations when a hurricane strikes.” Real-time data is only one part of the picture. The HWind Enhanced Archive is a catalog of data – including high-resolution images, snapshots, and footprints from historical hurricanes extending back almost 30 years that can be used to validate historical claims and loss experience. “When we're creating forecasts in real-time, we only have the information of what has come before [in that particular storm],” says Higgins. “With the archive, we can take advantage of the data that comes in after we produce the snapshots and use all of that to produce an enhanced archive to improve what we do in real-time.” Taking the Stress out of Event Response “Event response is quite a stressful time for the insurance industry, because they've got to make business decisions based around what their losses could be,” Higgins adds. “At the time of these live events, there's always increased scrutiny around their exposure and reporting.” HWind has plugged the gap in the market for a tool that can provide earlier, more frequent, and more detailed insights into the potential impact of a hurricane before, during, and following landfall. “The key reason for having HWind available with ExposureIQ is to have it all in one place,” explains Higgins. “There are many different sources of information out there, and during a live event the last thing you want to do is be scrambling across websites trying to see who's released what and then pull it across to your environment, so you can overlay it on your live portfolio of risks. As soon as we release the accumulation footprints, they are uploaded directly into the application, making it faster and more convenient for users to generate an understanding of potential loss for their specific portfolios." RMS applications such as ExposureIQ, and the modeling application Risk Modeler™, all use the same cloud-native Intelligent Risk Platform. This allows for a continuous workflow, allowing users to generate both accumulation analytics as well as modeled losses from the same set of exposure data. During an event, for example, with the seven hurricane scenarios that form part of the HWind data flow, the detailed wind fields and tracks (see Figure below) and the storm surge footprints for each scenario can be viewed on the ExposureIQ application for clients to run accumulations against. The application has a robust integrated mapping service that allows users to view their losses and hot spots on a map, and it also includes the functionality to switch to see the same data distributed in loss tables if that is preferred. “Now that we have both those on view in the cloud, you can overlay the footprint files on top of your exposures, and quickly see it before you even run [the accumulations],” says Higgins. Figure 1: RMS HWind forecast probability of peak gusts greater than 80 miles per hour from Hurricane Ida at 1200UTC August 29, 2021, overlaid on exposure data within the RMS ExposureIQ applicationOne-Stop-Shop This close interaction between HWind and the ExposureIQ application indicates another advantage of the RMS product suite – the use of consistent event response data across the platform so exposure mapping and modeling are all in one place. “The idea is that by having it on the cloud, it is much more performant; you can analyze online portfolios a lot more quickly, and you can get those reports to your board a lot faster than previously,” says Higgins. In contrast to other solutions in the market, which typically use third-party hazard tools and modeling platforms, the RMS suite has a consistent model methodology flowing through the entire product chain. “That's really where the sweet spot of ExposureIQ is – this is all one connected ecosystem,” commented Higgins. “I get my data into ExposureIQ and it is in the same format as Risk Modeler, so I don't need to convert anything. Both products use a consistent financial model too – so you are confident the underlying policy and reinsurance terms are being applied in the same way.” The modular nature of the RMS application ecosystem means that, in addition to hurricane risks, data on perils such as floods, earthquakes, and wildfires are also available – and then processed by the relevant risk modeling tool to give clients insights on their potential losses. “With that indication of where you might expect to experience claims, and how severe those claims might be, you can start to reach out to policyholders to understand if they've been affected.” At this point, clients are then in a good position to start building their claims deployment strategy, preparing claims adjusters to visit impacted sites and briefing reserving and other teams on when to start processing payments. But even before a hurricane has made landfall, clients can make use of forecast wind fields to identify locations that might be affected in advance of the storm and warn policyholders to prepare accordingly. “That can not only help policyholders to protect their property but also mitigate insurance losses as well,” says Higgins. “Similarly, you can use it to apply an underwriting moratorium in advance of a storm. Identify areas that are likely to be impacted, and then feed that into underwriting processes to ensure that no one can write a policy in the region when a storm is approaching.” The First Unified Risk Modeling Platform Previously, before moving to an integrated, cloud-based platform, these tools would likely have been hosted using on-premises servers with all the significant infrastructure costs that implies. Now, in addition to accessing a full suite of products via a single cloud-native platform, RMS clients can also leverage the company’s three decades of modeling expertise, benefiting from a strong foundation of trusted exposure data to help manage their exposures. “A key goal for a lot of people responding to events is initially to understand what locations are affected, how severely they're affected, and what their total exposed limit is, and to inform things like deploying claims adjusters,” says Higgins. And beyond the exposure management function, argues Higgins, it’s about gearing up for the potential pain of those claims, the processes that go around that, and the communication to the board. “These catastrophic events can have a significant impact on a company’s revenue, and the full implications – and any potential mitigation – needs to be well understood.” Find out more about the award-winning ExposureIQ.


Location, Location, Location: A New Era in Data Resolution
The insurance industry has reached a transformational point in its ability to accurately understand the details of exposure at risk. It is the point at which three fundamental components of exposure management are coming together to enable (re)insurers to systematically quantify risk at the location level: the availability of high-resolution location data, access to the technology to capture that data and advances in modeling capabilities to use that data. Data resolution at the individual building level has increased considerably in recent years, including the use of detailed satellite imagery, while advances in data sourcing technology have provided companies with easier access to this more granular information. In parallel, the evolution of new innovations, such as RMS® High Definition Models™ and the transition to cloud-based technologies, has facilitated a massive leap forward in the ability of companies to absorb, analyze and apply this new data within their actuarial and underwriting ecosystems. Quantifying Risk Uncertainty “Risk has an inherent level of uncertainty,” explains Mohsen Rahnama, chief modeling officer at RMS. “The key is how you quantify that uncertainty. No matter what hazard you are modeling, whether it is earthquake, flood, wildfire or hurricane, there are assumptions being made. These catastrophic perils are low-probability, high-consequence events as evidenced, for example, by the 2017 and 2018 California wildfires or Hurricane Katrina in 2005 and Hurricane Harvey in 2017. For earthquake, examples include Tohoku in 2011, the New Zealand earthquakes in 2010 and 2011, and Northridge in 1994. For this reason, risk estimation based on an actuarial approach cannot be carried out for these severe perils; physical models based upon scientific research and event characteristic data for estimating risk are needed.” A critical element in reducing uncertainty is a clear understanding of the sources of uncertainty from the hazard, vulnerability and exposure at risk. “Physical models, such as those using a high-definition approach, systematically address and quantify the uncertainties associated with the hazard and vulnerability components of the model,” adds Rahnama. “There are significant epistemic (also known as systematic) uncertainties in the loss results, which users should consider in their decision-making process. This epistemic uncertainty is associated with a lack of knowledge. It can be subjective and is reducible with additional information.” What are the sources of this uncertainty? For earthquake, there is uncertainty about the ground motion attenuation functions, soil and geotechnical data, the size of the events, or unknown faults. Rahnama explains: “Addressing the modeling uncertainty is one side of the equation. Computational power enables millions of events and more than 50,000 years of simulation to be used, to accurately capture the hazard and reduce the epistemic uncertainty. Our findings show that in the case of earthquakes the main source of uncertainty for portfolio analysis is ground motion; however, vulnerability is the main driver of uncertainty for a single location.” The quality of the exposure data as the input to any mathematical models is essential to assess the risk accurately and reduce the loss uncertainty. However, exposure could represent the main source of loss uncertainty, especially when exposure data is provided in aggregate form. Assumptions can be made to disaggregate exposure using other sources of information, which helps to some degree reduce the associated uncertainty. Rahnama concludes, “Therefore, it is essential in order to minimize the uncertainty related to exposure to try to get location-level information about the exposure, in particular for the region with the potential of liquification for earthquake or for high-gradient hazard such as flood and wildfire.” A critical element in reducing that uncertainty, removing those assumptions and enhancing risk understanding is combining location-level data and hazard information. That combination provides the data basis for quantifying risk in a systematic way. Understanding the direct correlation between risk or hazard and exposure requires location-level data. The potential damage caused to a location by flood, earthquake or wind will be significantly influenced by factors such as first-floor elevation of a building, distance to fault lines or underlying soil conditions through to the quality of local building codes and structural resilience. And much of that granular data is now available and relatively easy to access. “The amount of location data that is available today is truly phenomenal,” believes Michael Young, vice president of product management at RMS, “and so much can be accessed through capabilities as widely available as Google Earth. Straightforward access to this highly detailed satellite imagery means that you can conduct desktop analysis of individual properties and get a pretty good understanding of many of the building and location characteristics that can influence exposure potential to perils such as wildfire.” Satellite imagery is already a core component of RMS model capabilities, and by applying machine learning and artificial intelligence (AI) technologies to such images, damage quantification and differentiation at the building level is becoming a much more efficient and faster undertaking — as demonstrated in the aftermath of Hurricanes Laura and Delta. “Within two days of Hurricane Laura striking Louisiana at the end of August 2020,” says Rahnama, “we had been able to assess roof damage to over 180,000 properties by applying our machine-learning capabilities to satellite images of the affected areas. We have ‘trained’ our algorithms to understand damage degree variations and can then superimpose wind speed and event footprint specifics to group the damage degrees into different wind speed ranges. What that also meant was that when Hurricane Delta struck the same region weeks later, we were able to see where damage from these two events overlapped.” The Data Intensity of Wildfire Wildfire by its very nature is a data-intensive peril, and the risk has a steep gradient where houses in the same neighborhood can have drastically different risk profiles. The range of factors that can make the difference between total loss, partial loss and zero loss is considerable, and to fully grasp their influence on exposure potential requires location-level data. The demand for high-resolution data has increased exponentially in the aftermath of recent record-breaking wildfire events, such as the series of devastating seasons in California in 2017-18, and unparalleled bushfire losses in Australia in 2019-20. Such events have also highlighted myriad deficiencies in wildfire risk assessment including the failure to account for structural vulnerabilities, the inability to assess exposure to urban conflagrations, insufficient high-resolution data and the lack of a robust modeling solution to provide insight about fire potential given the many years of drought. Wildfires in 2017 devastated the town of Paradise, California In 2019, RMS released its U.S. Wildfire HD Model, built to capture the full impact of wildfire at high resolution, including the complex behaviors that characterize fire spread, ember accumulation and smoke dispersion. Able to simulate over 72 million wildfires across the contiguous U.S., the model creates ultrarealistic fire footprints that encompass surface fuels, topography, weather conditions, moisture and fire suppression measures. “To understand the loss potential of this incredibly nuanced and multifactorial exposure,” explains Michael Young, “you not only need to understand the probability of a fire starting but also the probability of an individual building surviving. “If you look at many wildfire footprints,” he continues, “you will see that sometimes up to 60 percent of buildings within that footprint survived, and the focus is then on what increases survivability — defensible space, building materials, vegetation management, etc. We were one of the first modelers to build mitigation factors into our model, such as those building and location attributes that can enhance building resilience.” Moving the Differentiation Needle In a recent study by RMS and the Center for Insurance Policy Research, the Insurance Institute for Business and Home Safety and the National Fire Protection Association, RMS applied its wildfire model to quantifying the benefits of two mitigation strategies — structural mitigation and vegetation management — assessing hypothetical loss reduction benefits in nine communities across California, Colorado and Oregon. Young says: “By knowing what the building characteristics and protection measures are within the first 5 feet and 30 feet at a given property, we were able to demonstrate that structural modifications can reduce wildfire risk up to 35 percent, while structural and vegetation modifications combined can reduce it by up to 75 percent. This level of resolution can move the needle on the availability of wildfire insurance as it enables development of robust rating algorithms to differentiate specific locations — and means that entire neighborhoods don’t have to be non-renewed.” “By knowing what the building characteristics and protection measures are within the first 5 feet and 30 feet at a given property, we were able to demonstrate that structural modifications can reduce wildfire risk up to 35 percent, while structural and vegetation modifications combined can reduce it by up to 75 percent” Michael Young, RMS While acknowledging that modeling mitigation measures at a 5-foot resolution requires an immense granularity of data, RMS has demonstrated that its wildfire model is responsive to data at that level. “The native resolution of our model is 50-meter cells, which is a considerable enhancement on the zip-code level underwriting grids employed by some insurers. That cell size in a typical suburban neighborhood encompasses approximately three-to-five buildings. By providing the model environment that can utilize information within the 5-to-30-foot range, we are enabling our clients to achieve the level of data fidelity to differentiate risks at that property level. That really is a potential market game changer.” Evolving Insurance Pricing It is not hyperbolic to suggest that being able to combine high-definition modeling with high-resolution data can be market changing. The evolution of risk-based pricing in New Zealand is a case in point. The series of catastrophic earthquakes in the Christchurch region of New Zealand in 2010 and 2011 provided a stark demonstration of how insufficient data meant that the insurance market was blindsided by the scale of liquefaction-related losses from those events. “The earthquakes showed that the market needed to get a lot smarter in how it approached earthquake risk,” says Michael Drayton, consultant at RMS, “and invest much more in understanding how individual building characteristics and location data influenced exposure performance, particularly in relation to liquefaction. “To get to grips with this component of the earthquake peril, you need location-level data,” he continues. “To understand what triggers liquefaction, you must analyze the soil profile, which is far from homogenous. Christchurch, for example, sits on an alluvial plain, which means there are multiple complex layers of silt, gravel and sand that can vary significantly from one location to the next. In fact, across a large commercial or industrial complex, the soil structure can change significantly from one side of the building footprint to the other.” Extensive building damage in downtown Christchurch, New Zealand after 2011 earthquakeThe aftermath of the earthquake series saw a surge in soil data as teams of geotech engineers conducted painstaking analysis of layer composition. With multiple event sets to use, it was possible to assess which areas suffered soil liquefaction and from which specific ground-shaking intensity. “Updating our model with this detailed location information brought about a step-change in assessing liquefaction exposures. Previously, insurers could only assess average liquefaction exposure levels, which was of little use where you have highly concentrated risks in specific areas. Through our RMS® New Zealand Earthquake HD Model, which incorporates 100-meter grid resolution and the application of detailed ground data, it is now possible to assess liquefaction exposure potential at a much more localized level.” “Through our RMS® New Zealand Earthquake HD model, which incorporates 100-meter grid resolution and the application of detailed ground data, it is now possible to assess liquefaction exposure potential at a much more localized level” — Michael Drayton, RMS This development represents a notable market shift from community to risk-based pricing in New Zealand. With insurers able to differentiate risks at the location level, this has enabled companies such as Tower Insurance to more accurately adjust premium levels to reflect risk to the individual property or area. In its annual report in November 2019, Tower stated: “Tower led the way 18 months ago with risk-based pricing and removing cross-subsidization between low- and high-risk customers. Risk-based pricing has resulted in the growth of Tower’s portfolio in Auckland while also reducing exposure to high-risk areas by 16 percent. Tower’s fairer approach to pricing has also allowed the company to grow exposure by 4 percent in the larger, low-risk areas like Auckland, Hamilton, and Taranaki.” Creating the Right Ecosystem The RMS commitment to enable companies to put high-resolution data to both underwriting and portfolio management use goes beyond the development of HD Models™ and the integration of multiple layers of location-level data. Through the launch of RMS Risk Intelligence™, its modular, unified risk analytics platform, and the Risk Modeler™ application, which enables users to access, evaluate, compare and deploy all RMS models, the company has created an ecosystem built to support these next-generation data capabilities. Deployed within the Cloud, the ecosystem thrives on the computational power that this provides, enabling proprietary and tertiary data analytics to rapidly produce high-resolution risk insights. A network of applications — including the ExposureIQ™ and SiteIQ™ applications and Location Intelligence API — support enhanced access to data and provide a more modular framework to deliver that data in a much more customized way. “Because we are maintaining this ecosystem in the Cloud,” explains Michael Young, “when a model update is released, we can instantly stand that model side-by-side with the previous version. As more data becomes available each season, we can upload that new information much faster into our model environment, which means our clients can capitalize on and apply that new insight straightaway.” Michael Drayton adds: “We’re also offering access to our capabilities in a much more modular fashion, which means that individual teams can access the specific applications they need, while all operating in a data-consistent environment. And the fact that this can all be driven through APIs means that we are opening up many new lines of thought around how clients can use location data.” Exploring What Is Possible There is no doubt that the market is on the cusp of a new era of data resolution — capturing detailed hazard and exposure and using the power of analytics to quantify the risk and risk differentiation. Mohsen Rahnama believes the potential is huge. “I foresee a point in the future where virtually every building will essentially have its own social-security-like number,” he believes, “that enables you to access key data points for that particular property and the surrounding location. It will effectively be a risk score, including data on building characteristics, proximity to fault lines, level of elevation, previous loss history, etc. Armed with that information — and superimposing other data sources such as hazard data, geological data and vegetation data — a company will be able to systematically price risk and assess exposure levels for every asset up to the portfolio level.” “The only way we can truly assess this rapidly changing risk is by being able to systematically evaluate exposure based on high-resolution data and advanced modeling techniques that incorporate building resilience and mitigation measures” — Mohsen Rahnama, RMS Bringing the focus back to the here and now, he adds, the expanding impacts of climate change are making the need for this data transformation a market imperative. “If you look at how many properties around the globe are located just one meter above sea level, we are talking about trillions of dollars of exposure. The only way we can truly assess this rapidly changing risk is by being able to systematically evaluate exposure based on high-resolution data and advanced modeling techniques that incorporate building resilience and mitigation measures. How will our exposure landscape look in 2050? The only way we will know is by applying that data resolution underpinned by the latest model science to quantify this evolving risk.”


Cyber Solutions 4.0: Modeling Systemic Risk
The updated RMS cyber model leverages data, software vulnerabilities, attack scenarios and advanced analytics to help insurers and reinsurers get a handle on their risk aggregations From distributed denial of service (DDoS) attacks, cloud outages and contagious malware through to cyber physical exposures, cyber risk is a sentient and ever-changing threat environment. The cyber insurance market has evolved with the threat, tailoring policies to the exposures most concerning businesses around the world, ranging from data breach to business interruption. But recent events have highlighted the very real potential for systemic risks arising from a cyberattack. Nowhere was this more obvious than the 2017 WannaCry and NotPetya ransomware attacks. WannaCry affected over 200,000 computers in businesses that spanned industry sectors across 150 countries, including more than 80 National Health Service organizations in the U.K. alone. Had it not been for the discovery of a “kill switch,” the malware would have caused even more disruption and economic loss. Just a month after WannaCry, NotPetya hit. It used the same weakness within corporate networks as the WannaCry ransomware, but without the ability to jump from one network to another. With another nation-state as the suspected sponsor, this new strain of contagious malware impacted major organizations, including shipping firm Maersk and pharmaceutical company Merck. Both cyber events highlighted the potential for systemic loss from a single attack, as well as the issues surrounding “silent” cyber cover. The high-profile claims dispute arising between U.S. snack-food giant Mondelez and its property insurer, after the carrier refused a US$100 million claim based on a war exclusion within its policy, fundamentally changed the direction of the insurance market. It resulted in regulators and the industry coming together in a concerted push to clarify whether cyber cover was affirmative or non-affirmative. The Cyber Black Swan There are numerous sources of systemic risk arising from a cyber incident. For the cyber (re)insurance market to reach maturity and a stage at which it can offer the limits and capacity now desired by commercial clients, it is first necessary to understand and mitigate these aggregate exposures. A report published by RMS and the Cambridge Centre for Risk Studies in 2019 found there is increasing potential for systemic failures in IT systems or for systemic exploitation of strategically important technologies. Much of this is the result of an ever more connected world, with a growth in the internet of things (IoT) and reliance on third-party vendors. Supply chain attacks are a source of systemic risk, which will continue to grow over time with the potential for significant accumulation losses for the insurance industry As the report states, “Supply chain attacks are a source of systemic risk, which will continue to grow over time with the potential for significant accumulation losses for the insurance industry.” The report also noted that many of the victims of NotPetya were unintentionally harmed by the ransomware, which is believed to have been a politically motivated attack against Ukraine. Cyber Models Meet Evolving Market Demands Models and other risk analysis tools have become critical to the ongoing development and growing sophistication of the cyber insurance and reinsurance markets. As the industry continues to adapt its offering, there is demand for models that capture the latest threats and enable a clearer understanding into potential aggregations of risk within carriers’ books of business. From introducing exclusions on the silent side and developing sophisticated models to understanding the hazard itself and modeling contagious malware as a physical process, we are gaining ever-greater insight into the physics and dynamics of the underlying risk Dr. Christos Mitas, RMS As the insurance industry has evolved in its approach to cyber risk, so too has the modeling. Version 4.0 of the RMS Cyber Solutions, released in October 2019, brings together years of extensive research into the underlying processes that underpin cyber risk. It leverages millions of data points and provides expanded data enrichment capabilities on 13 million global companies, leading to improved model accuracy, explains Dr. Christos Mitas, head of the RMS cyber risk modeling group. “We have been engaging with a couple of dozen clients for the past four years and incorporating features into our solution that speak to the pain points they see in their day-to-day business,” he says. “From introducing exclusions on the silent side and developing sophisticated models to understanding the hazard itself and modeling contagious malware as a physical process, we are gaining ever-greater insight into the physics and dynamics of the underlying risk.” Feedback over the past six months since the release of Version 4.0 has been extremely positive, says Mitas. “There has been genuine amazement around the data assets we have developed and the modeling framework around which we have organized this data collection effort. There has been a huge effort over the last two years by our data scientists who have been using artificial intelligence (AI) and machine learning (ML) to collect data points from cyber events across all the sources of cyber risk that we model. “Cyber 4.0 also included new functionality to address software vulnerabilities and motivations of cyber threat actor groups that have been active over the last few years,” he continues. “These are all datasets that we have collected, and they are complemented with third-party sources — including academia, cybersecurity firms, and partners within the insurance industry — into cyber damage events.” There has been strong support from the reinsurance market, which has been a little bit behind the primary insurance market in developing its cyber product suite. “The reinsurance market has not developed as much as you would expect it to if they were relying on robust models,” says Mitas. “So, we have enhanced reinsurance modeling in our financial engines and exceedance probability (EP) curves to meet this need. “We’ve had some good feedback from reinsurance pieces we have included in Version 4.0,” he continues. “From a cybersecurity point of view, very sophisticated clients that work with internal cybersecurity teams have commented on the strength of some of our modeling for contagious malware, and for cloud outages and data breach.” Quoted Source: Barracuda Networks Click here to learn more about RMS’s purpose-built cyber model


A Solution Shared
The Risk Data Open Standard is now available, and active industry collaboration is essential for achieving wide-scale interoperability objectives On January 31, the first version of the Risk Data Open Standard™ (RDOS) was made available to the risk community and the public on the GitHub platform. The RDOS is an “open” standard because it is available with no fees or royalties and anyone can review, download, contribute to or leverage the RDOS for their own project. With the potential to transform the way risk data is expressed and exchanged across the (re)insurance industry and beyond, the RDOS represents a new data model (i.e., a data specification or schema) specifically designed for holding all types of risk data, from exposure through model settings to results analyses. The industry has longed recognized that a dramatic improvement in risk data container design is required to support current and future industry operations. The industry currently relies on data models for risk data exchange and storage that were originally designed to support property cat models over 20 years ago. These formats are incomplete. They do not capture critical information about contracts, business structures or model settings. This means that an analyst receiving data in these old formats has detective work to do – filling in the missing pieces of the risk puzzle. Because formats lack a complete picture linking exposures to results, highly skilled, well-paid people are wasting a huge amount of time, and efforts to automate are difficult, if not impossible, to achieve. Existing formats are also very property-centric. As models for new insurance lines have emerged over the years, such as energy, agriculture and cyber, the risk data for these lines of business have either been forced suboptimally into the property cat data model, or entirely new formats have been created to support single lines of business. The industry is faced with two poor choices: accept substandard data or deal with many data formats – potentially one for each line of business – possibly multiplied by the number of companies who offer models for a particular line of business. The industry is painfully aware of the problems we are trying to solve. The RDOS aims to provide a complete, flexible and interoperable data format ‘currency’ for exchange that will eliminate the time-consuming and costly data processes that are currently required Paul Reed RMS “The industry is painfully aware of the problems we are trying to solve. The RDOS aims to provide a complete, flexible and interoperable data format ‘currency’ for exchange that will eliminate the time-consuming and costly data processes that are currently required,” explains Paul Reed, technical program manager for the RDOS at RMS. He adds, “Of course, adoption of a new standard can’t happen overnight, but because it is backward-compatible with the RMS EDM and RDM users have optionality through the transition period.” Taking on the Challenge The RDOS has great promise. An open standard specifically designed to represent and exchange risk data, it accommodates all categories of risk information across five critical information sets – exposure, contracts (coverage), business structures, model settings and results analyses. But can it really overcome the many intrinsic data hurdles currently constraining the industry? According to Ryan Ogaard, senior vice president of model product management at RMS, its ability to do just that lies in the RDOS’s conceptual entity model. “The design is simple, yet complete, consisting of these five linked categories of information that provide an unambiguous, auditable view of risk analysis,” he explains. “Each data category is segregated – creating flexibility by isolating changes to any given part of the RDOS – but also linked in a single container to enable clear navigation through and understanding of any risk analysis, from the exposure and contracts through to the results.” By adding critical information about the business structure and models used, the standard creates a complete data picture – a fully traceable description of any analysis. This unique capability is a result of the superior technical data model design that the RDOS brings to the data struggle, believes Reed. “The RDOS delivers multiple technical advantages,” he says. “Firstly, it stores results data along with contracts, business structure and settings data, which combine to enable a clear and comprehensive understanding of analyses. Secondly, the contract definition language (CDL) and structure definition language (SDL) provide a powerful tool for unambiguously determining contract payouts from a set of claims. In addition, the data model design supports advanced database technology and can be implanted in several popular DB formats including object-relational and SQL. Flexibility has been designed into virtually every facet of the RDOS, with design for extensibility built into each of the five information entities.” “New information sets can be introduced to the RDOS without impacting existing information,” Ogaard says. “This overcomes the challenges of model rigidity and provides the flexibility to capture multivendor modeling data, as well as the user’s own view of risk. This makes the standard future-proof and usable by a broad cross section of the (re)insurance industry and other industries.” Opening Up the Standard To achieve the ambitious objective of risk data interoperability, it was critical that the RDOS was founded on an open-source platform. Establishing the RDOS on the GitHub platform was a game-changing decision, according to Cihan Biyikoglu, executive vice president of product at RMS. You have to recognize the immense scale of the data challenge that exists within the risk analysis field. To address it effectively will require a great deal of collaboration across a broad range of stakeholders. Having the RDOS as an open standard enables that scale of collaboration to occur. “I’ve worked on a number of open-source projects,” he says, “and in my opinion an open-source standard is the most effective way of energizing an active community of contributors around a particular project. “You have to recognize the immense scale of the data challenge that exists within the risk analysis field. To address it effectively will require a great deal of collaboration across a broad range of stakeholders. Having the RDOS as an open standard enables that scale of collaboration to occur.” Concerns have been raised about whether, given its open-source status and the ambition to become a truly industrywide standard, RMS should continue to play a leading role in the ongoing development of the RDOS now that it is open to all. Biyikoglu believes it should. “Many open-source projects start with a good initial offering but are not maintained over time and quickly become irrelevant. If you look at the successful projects, a common theme is that they emanate from an industry participant suffering greatly from the particular issue. In the early phase, they contribute the majority of the improvements, but as the project evolves and the active community expands, the responsibility for moving it forward is shared by all. And that is exactly what we expect to see with the RDOS.” For Paul Reed, the open-source model provides a fair and open environment in which all parties can freely contribute. “By adopting proven open-source best practices and supported by the industry-driven RDOS Steering Committee, we are creating a level playing field in which all participants have an equal opportunity to contribute.” Assessing The Potential Following the initial release of the RDOS, much of the activity on the GitHub platform has involved downloading and reviewing the RDOS data model and tools, as users look to understand what it can offer and how it will function. However, as the open RDOS community builds and contributions are received, combined with guidance from industry experts on the steering committee, Ogaard is confident it will quickly start generating clear value on multiple fronts. “The flexibility, adaptability and completeness of the RDOS structure create the potential to add tremendous industry value,” he believes, “by addressing the shortcomings of current data models in many areas. There is obvious value in standardized data for lines of business beyond property and in facilitating efficiency and automation. The RDOS could also help solve model interoperability problems. It’s really up to the industry to set the priorities for which problem to tackle first. The flexibility, adaptability and completeness of the RDOS structure create the potential to add tremendous industry value “Existing data formats were designed to handle property data,” Ogaard continues, “and do not accommodate new categories of exposure information. The RDOS Risk Item entity describes an exposure and enables new Risk Items to be created to represent any line of business or type of risk, without impacting any existing Risk Item. That means a user could add marine as a new type of Risk Item, with attributes specific to marine, and define contracts that cover marine exposure or its own loss type, without interfering with any existing Risk Item.” The RDOS is only in its infancy, and how it evolves – and how quickly it evolves – lies firmly in the hands of the industry. RMS has laid out the new standard in the GitHub open-source environment and, while it remains committed to the open standard’s ongoing development, the direction that the RDOS takes is firmly in the hands of the (re)insurance community. Access the Risk Data Open Standard here


Insurance: The next 10 years
Mohsen Rahnama, Cihan Biyikoglu and Moe Khosravy of RMS look to 2029, consider the changes the (re)insurance industry will have undergone and explain why all roads lead to a platform Over the last 30 years, catastrophe models have become an integral part of the insurance industry for portfolio risk management. During this time, the RMS model suite has evolved and expanded from the initial IRAS model — which covered California earthquake — to a comprehensive and diverse set of models covering over 100 peril-country combinations all over the world. RMS Risk Intelligence™, an open and flexible platform, was recently launched, and it was built to enable better risk management and support profitable risk selection. Since the earliest versions of catastrophe models, significant advances have been made in both technology and computing power. These advances allow for a more comprehensive application of new science in risk modeling and make it possible for modelers to address key sources of model and loss uncertainty in a more systematic way. These and other significant changes over the last decade are shaping the future of insurance. By 2029, the industry will be fully digitized, presenting even more opportunity for disruption in an era of technological advances. In what is likely to remain a highly competitive environment, market participants will need to differentiate based on the power of computing speed and the ability to mine and extract value from data to inform quick, risk-based decisions. Laying the Foundations So how did we get here? Over the past few decades we have witnessed several major natural catastrophes including Hurricanes Andrew, Katrina and Sandy; the Northridge, Kobe, Maule, Tōhoku and Christchurch Earthquakes; and costly hurricanes and California wildfires in 2017 and 2018. Further, human-made catastrophes have included the terrorist attacks of 9/11 and major cyberattacks, such as WannaCry and NotPetya. Each of these events has changed the landscape of risk assessment, underwriting and portfolio management. Combining the lessons learned from past events, including billions of dollars of loss data, with new technology has enhanced the risk modeling methodology, resulting in more robust models and a more effective way to quantify risk across diverse regions and perils. The sophistication of catastrophe models has increased as technology has enabled a better understanding of root causes and behavior of events, and it has improved analysis of their impact. Technology has also equipped the industry with more sophisticated tools to harness larger datasets and run more computationally intensive analytics. These new models are designed to translate finer-grained data into deeper and more detailed insights. Consequently, we are creating better models while also ensuring model users can make better use of model results through more sophisticated tools and applications. A Collaborative Approach In the last decade, the pace at which technology has advanced is compelling. Emerging technology has caused the insurance industry to question if it is responding quickly and effectively to take advantage of new opportunities. In today’s digital world, many segments of the industry are leveraging the power and capacity enabled by Cloud-computing environments to conduct intensive data analysis using robust analytics. Technology has also equipped the industry with more sophisticated tools to harness larger datasets Such an approach empowers the industry by allowing information to be accessed quickly, whenever it is needed, to make effective, fully informed decisions. The development of a standardized, open platform creates smooth workflows and allows for rapid advancement, information sharing and collaboration in growing common applications. The future of communication between various parties across the insurance value chain — insurers, brokers, reinsurers, supervisors and capital markets — will be vastly different from what it is today. By 2029, we anticipate the transfer of data, use of analytics and other collaborations will be taking place across a common platform. The benefits will include increased efficiency, more accurate data collection and improvements in underwriting workflow. A collaborative platform will also enable more robust and informed risk assessments, portfolio rollout processes and risk transfers. Further, as data is exchanged it will be enriched and augmented using new machine learning and AI techniques. An Elastic Platform We continue to see technology evolve at a very rapid pace. Infrastructure continues to improve as the cost of storage declines and computational speed increases. Across the board, the incremental cost of computing technology has come down. Software tools have evolved accordingly, with modern big data systems now capable of handling hundreds if not thousands of terabytes of data. Improved programming frameworks allow for more seamless parallel programming. User-interface components reveal data in ways that were not possible in the past. Furthermore, this collection of phenomenal advances is now available in the Cloud, with the added benefit that it is continuously self-improving to support growing commercial demands. In addition to helping avoid built-in obsolescence, the Cloud offers “elasticity.” Elasticity means accessing many machines when you need them and fewer when you don’t. It means storage that can dynamically grow and shrink, and computing capacity that can follow the ebb and flow of demand. In our world of insurance and data analytics, the macro cycles of renewal seasons and micromodeling demand bursts can both be accommodated through the elastic nature of the Cloud. In an elastic world, the actual cost of supercomputing goes down, and we can confidently guarantee fast response times. Empowering Underwriters A decade from now, the industry will look very different, not least due to changes within the workforce and the risk landscape. First-movers and fast-followers will be in a position of competitive advantage come 2029 in an industry where large incumbents are already partnering with more agile “insurtech” startups. The role of the intermediary will continue to evolve, and at every stage of risk transfer — from insured to primary insurer, reinsurer and into the capital markets — data sharing and standardization will become key success factors. Over the next 10 years, as data becomes more standardized and more widely shared, the concept of blockchain, or distributed ledger technology, will move closer to becoming a reality. This standardization, collaboration and use of advanced analytics are essential to the future of the industry. Machine learning and AI, highly sophisticated models and enhanced computational power will enable underwriters to improve their risk selection and make quick, highly informed decisions. And this ability will enhance the role of the insurance industry in society, in a changing and altogether riskier world. The tremendous protection gap can only be tackled when there is more detailed insight and differentiation around each individual risk. When there is greater insight into the underlying risk, there is less need for conservatism, risks become more accurately and competitively priced, and (re)insurers are able to innovate to provide products and solutions for new and emerging exposures. Over the coming decade, models will require advanced computing technology to fully harness the power of big data. Underwater robots are now probing previously unmapped ocean waters to detect changes in temperatures, currents, sea level and coastal flooding. Drones are surveying our built-up environment in fine detail. Artificial intelligence and machine learning algorithms are searching for patterns of climate change in these new datasets, and climate models are reconstructing the past and predicting the future at a resolution never before possible. These emerging technologies and datasets will help meet our industry’s insatiable demand for more robust risk assessment at the level of an individual asset. This explosion of data will fundamentally change the way we think about model execution and development, as well as the end-to-end software infrastructure. Platforms will need to be dynamic and forward-looking verses static and historic in the way they acquire, train, and execute on data. The industry has already transformed considerably over the past five years, despite traditionally being considered a laggard in terms of its technology adoption. The foundation is firmly in place for a further shift over the next decade where all roads are leading to a common, collaborative industry platform, where participants are willing to share data and insights and, as they do so, open up new markets and opportunities. RMS Risk Intelligence The analytical and computational power of the Risk Intelligence (RI) platform enables the RMS model development team to bring the latest science and research to the RMS catastrophe peril model suite and build the next generation of high-definition models. The functionality and high performance of RI allows the RMS team to assess elements of model and loss uncertainty in a more robust way than before. The framework of RI is flexible, modular and scalable, allowing the rapid integration of future knowledge with a swifter implementation and update cycle. The open modeling platform allows model users to extract more value from their claims experience to develop vulnerability functions that represent a view of risk specific to their data or to use custom-built alternatives. This enables users to perform a wide range of sensitivity tests and take ownership of their view of risk. Mohsen Rahnama is chief risk modeling officer and executive vice president, models and data, Cihan Biyikoglu is executive vice president, product and Moe Khosravy is executive vice president, software and platform at RMS


Risk in 2030
At this year’s RMS Exceedance conference in Miami, Robert Muir-Wood and Michael Steel imagined 10 future risks


A Data Step Change
With the introduction of the Risk Data Open Standard, the potential now exists to change the way the (re)insurance industry interacts with risk modeling data In May 2019, RMS introduced the (re)insurance industry to a new open data standard. Set to redefine how the market structures data, the Risk Data Open Standard (RDOS) offers a flexible, fully transparent and highly efficient framework — spanning all risks, models and contracts and information sets — that can be implemented using a wide range of data technology. “The RDOS has been constructed to hold the entire set of information that supports the analysis of any risk” Ryan Ogaard RMS That this new standard has the potential to alter fundamentally how the market interacts with exposure data is not hyperbole. Consider the formats that it is replacing. The RMS Exposure and Results Data Modules (EDM and RDM) have been the data cornerstones of the property catastrophe market for over 20 years. Other vendors use similar data formats, and some catastrophe modeling firms have their own versions. These information workhorses have served the sector well, transforming the way property catastrophe risk is transacted, priced and managed. Out With the Old But after over two decades of dedicated service, it is past time these formats were put out to pasture. Built to handle a narrow range of modeling approaches, limited in their ability to handle multiple information formats, property-centric by design and powered by outdated technology, the EDM/RDM and other formats represent “old-gen” standards crumbling under current data demands. “EDM and RDM have earned their status as the de facto standards for property catastrophe data exchange,” explains Ryan Ogaard, senior vice president at RMS. “Clearly documented, easy to implement, SQL-based, they were groundbreaking and have been used extensively in systems and processes for over 20 years. But the industry has evolved well beyond the capabilities of all the existing formats, and a new data model must be introduced to facilitate innovation and efficiency across our industry.” The RDOS is not the only attempt to solve the data formatting challenge. Multiple other initiatives have been attempted, or are underway, to improve data efficiency within the insurance industry. However, Ogaard believes all of these share one fatal flaw — they do not go far enough. “I have been involved in various industry groups exploring ways to overcome data challenges,” he explains, “and have examined the potential of different options. But in every instance, what is clear is that they would not advance the industry far enough to make them worth switching to.” The switching costs are a major issue with any new data standard. Transitioning to a new format from one so firmly embedded within your data hierarchy is a considerable move. To shift to a new standard that offers only marginal relief from the data pains of the current system would not be enough. “The industry needs a data container that can be extended to new coverages, risk types or contracts,” he states. “If we require a different format for every line of business or type of model, we end up with a multiplicative world of data inefficiency. Look at cyber risk. We’ve already created a separate new standard for that information. If our industry is truly going to move forward, the switch must solve our challenges in the short, medium and long term. That means a future-proof design to handle new models, risks and contracts — ideally all in one container.” Setting the Standard Several years in the making, the RDOS is designed to address every deficiency in the current formatting framework, providing a data container that can be easily modified as needs change and can deliver information in a single, auditable format that supports a wide range of analytics. It is already used within the framework of the recently launched risk management platform RMS Risk Intelligence™ “The RDOS is designed to be extended across several dimensions,” Ogaard continues. “It can handle the data and output to support any modeling algorithm — so RMS, or anyone else, can use it as a basis for new or existing models. It was originally built to support our high-definition (HD) modeling, which requires a domain-specific language to represent policy or treaty terms and structures — that was not possible with the old format. During that process, we realized that we should design a container that would not have to be replaced in the future when we inevitably build other types of models.” The RDOS can also span all business lines. It is designed to accommodate the description of any risk item or subject at risk. The standard has inherent flexibility — new tables can be introduced to the framework without disrupting existing sets, while current tables can be extended to handle information for multiple model types or additional proprietary data. “EDM and RDM were fundamental to creating a much more stable, resilient and dynamic marketplace,” says Ogaard. “That level of modeling simply isn’t available across other lines — but with the RDOS it can be. Right off the bat, that has huge implications for issues such as clash risk. By taking the data that exists across your policy and treaty systems and converting it into a single data format, you can then apply an accumulation engine to evaluate all clash scenarios. So, essentially, you can tackle accumulation risk across all business lines.” It is also built to encompass the full “risk story.” Current data formats essentially provide exposure and modeling results, but lack critical information on how the exposure was used to create the results. This means that anyone receiving these data sets must rely on an explanation of how an analysis was done — or figure it out themselves. “The RDOS has been constructed to hold the entire set of information that supports the analysis of any risk,” he explains. “This includes exposures, (re)insurance coverage information, the business structure used to create the results, complete model settings and adjustments, the results, and the linkage between the information. Multiple analyses can also be included in a single container. That means more time can be spent on accurate risk decision-making.” The RDOS is also independent of any specific technology and can be implemented in modern object relational technology, making it highly flexible. It can also be implemented in SQL Server if the limitations of a relational representation are adequate for the intended usage. The insurance industry, and cat analytics software, has been slow to adopt the power of tools such as Parquet, Spark, Athena and other new and powerful (and often open-source) data tools that can drive more data insights. Opening the Box For the RDOS to achieve its full potential, however, it cannot be constrained by ownership. By its very nature, it must be an open standard operated in a neutral environment if it is to be adopted by all and serve a larger market purpose. RMS recognized this and donated the RDOS to the industry (and beyond) as an open standard, harnessing open-source principles common in the software industry. Taking this route is perhaps not surprising given the executive leadership now in place at the company, with both CEO Karen White and Executive Vice President of Product Cihan Biyikoglu having strong open-source credentials. “When they saw the RDOS,” Ogaard explains, “it clearly had all of the hallmarks of an open-source candidate. It was being built by a leading market player with an industrywide purpose that required a collaborative approach.” What RMS has created with the RDOS represents a viable standard — but rather than a finished product, it is a series of building blocks designed to create a vast range of new applications from across the market. And to do that it must be a completely open standard that can evolve with the industry. “Some companies claim to have open standards,” he continues, “but by that they mean that you can look inside the box. Truly open standards are set up to be overseen and actually modified by the industry. With the RDOS, companies can not only open the box, but take the standard out, use it and modify it to create something better. They can build additions and submit them for inclusion and use by the entire industry. The RDOS will not be driven by RMS needs and priorities — it will exist as a separate entity. RMS cannot build every potential solution or model. We hope that by making this an open standard, new synergy is created that will benefit everyone — including us, of course.” Under Scrutiny To create a standard fit for all, RMS accepted that the RDOS could not be built in isolation and pushed out into the market — it had to be tested, the underlying premise reviewed, the format scrutinized. To ensure this, the company set up a steering committee from across the (re)insurance market. Charged with putting the RDOS through its paces, the committee members are given a central role in virtually every development stage. The committee is currently sixteen companies strong and growing. It will be dynamic and membership will change over time as issues and company focuses evolve. The membership list can be seen at www.riskdataos.org. “You cannot sit in an ivory tower and decide what might work for the industry as a whole,” Ogaard explains. “You need a robust vetting process and by creating this group of leading (re)insurance practitioners, each committed not simply to the success of the project but to the development of the best possible data solution, the RDOS will be guided by the industry, not just one company.” The role of the committee is twofold. First, it reviewed the existing specification, documentation and tooling to determine if it was ready for market consumption. RDOS saw its industry launch at the end of January 2020, and now the RDOS is published, the committee’s role will be to advise on the priorities and scope of future developments based on market-led requests for change and improvement. “Almost every open standard in any industry is based on a real, working product — not a theoretical construct,” he states. “Because the RDOS was built for a practical purpose and is in real-world use, it is much more likely to hold up to wider use and scrutiny.” So, while the RDOS may be growing its awareness in the wider market, it has already established its data credentials within the RMS model framework. Of course, there remains the fundamental challenge of shifting from one data format to another — but measures are already in place to make this as painless as possible. “The RDOS is essentially a superset of the original EDM and RDM formats,” he explains, “offering an environment in which the new and old standards are interchangeable. So, a company can translate an EDM into an RDOS and vice versa. The open standard tooling will include translators to make this translation. The user will therefore be able to operate both formats simultaneously and, as they recognize the RDOS data benefits, transition to that environment at their own pace. The RDOS could be extended to include other modelers’ data fields as well — so could solve model interoperability issues — if the industry decides to use it this way.” The standard has launched on the global development platform GitHub, which supports open-source standards, offering a series of downloadable assets including the RDOS specification, documentation, tools and data so that companies can create their own implementation and translate to and from old data formats. The potential that it creates is considerable and to a degree only limited by the willingness of users to push boundaries. “Success could come in several forms,” Ogaard concludes. “The RDOS becomes the single universal container for data exchange, creating huge efficiencies. Or it creates a robust ecosystem of developers opening up new opportunities and promoting greater industry choice. Or it supports new products that could not be foreseen today and creates synergies that drive more value — perhaps even outside the traditional market. Ideally, all of these things.”
