Five years on from the wildfire that devastated Fort McMurray, the event has proved critical to developing a much deeper understanding of wildfire losses in Canada
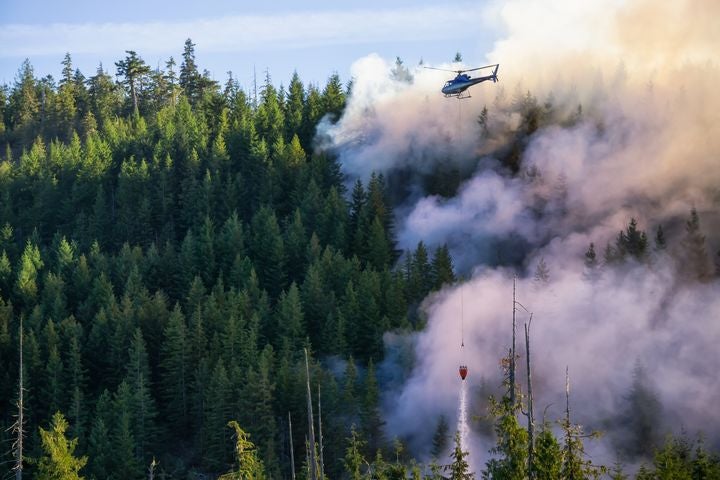
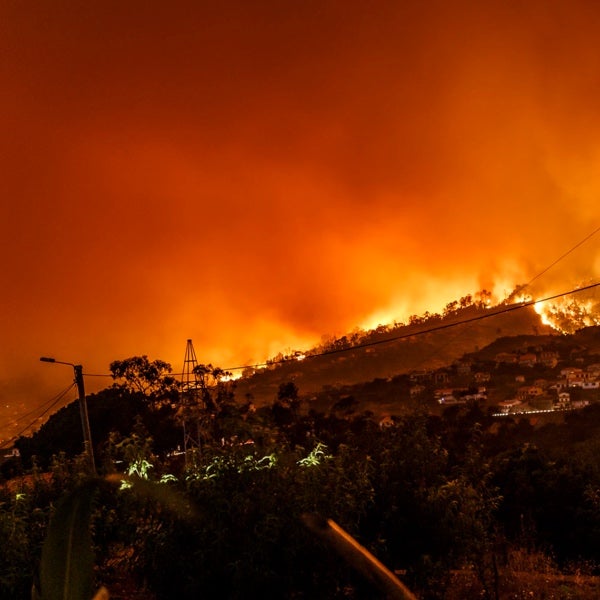
In May 2016, Fort McMurray, Alberta, became the location of Canada’s costliest wildfire event to date. In total, some 2,400 structures were destroyed by the fire, with a similar number designated as uninhabitable. Fortunately, the evacuation of the 90,000-strong population meant that no lives were lost as a direct result of the fires.
From an insurance perspective, the estimated CA$4 billion loss elevated wildfire risk to a whole new level. This was a figure now comparable to the extreme fire losses experienced in wildfire-exposed regions such as California, and established wildfire as a peak natural peril second only to flood in Canada.
However, the event also exposed gaps in the market’s understanding of wildfire events and highlighted the lack of actionable exposure data. In the U.S., significant investment had been made in enhancing the scale and granularity of publicly available wildfire data through bodies such as the United States Geological Survey, but the resolution of data available through equivalent parties in Canada was not at the same standard.
A Question of Scale
Making direct wildfire comparisons between the U.S. and Canada is difficult for multiple reasons. Take, for example, population density. Canada’s total population is approximately 37.6 million, spread over a landmass of 9,985 million square kilometers (3,855 million square miles), while California has a population of around 39.5 million, inhabiting an area of 423,970 square kilometers (163,668 square miles).
The potential for wildfire events impacting populated areas is therefore significantly less in Canada. In fact, in the event of a wildfire in Canada—due to the reduced potential exposure—fires are typically allowed to burn for longer and over a wider area, whereas in the U.S. there is a significant focus on fire suppression.
This willingness to let fires burn has the benefit of reducing levels of vegetation and fuel buildup. Also, more fires in the country are a result of natural rather than human-caused ignitions and occur in hard-to-access areas with low population exposure. Sixty percent of fires in Canada are attributed to human causes.
The challenge for the insurance industry in Canada is therefore more about measuring the potential impact of wildfire on smaller pockets of exposure
Michael Young, senior director, product management, at RMS
But as Fort McMurray showed, the potential for disaster clearly exists. In fact, the event was one of a series of large-scale fires in recent years that have impacted populated areas in Canada, including the Okanagan Mountain Fire, the McLure Fire, the Slave Lake Fire, and the Williams Lake and Elephant Hills Fire.
“The challenge for the insurance industry in Canada,” explains Michael Young, senior director, product management, at RMS, “is therefore more about measuring the potential impact of wildfire on smaller pockets of exposure, rather than the same issues of frequency and severity of event that are prevalent in the U.S.”
Regions at Risk
What is interesting to note is just how much of the populated territories are potentially exposed to wildfire events in Canada, despite a relatively low population density overall.
A 2017 report entitled Mapping Canadian Wildland Fire Interface Areas, published by the Canadian Forest Service, stated that the threat of wildfire impacting populated areas will inevitably increase as a result of the combined impacts of climate change and the development of more interface area “due to changes in human land use.” This includes urban and rural growth, the establishment of new industrial facilities and the building of more second homes.
According to the study, the wildland-human interface in Canada spans 116.5 million hectares (288 million acres), which is 13.8 percent of the country’s total land area or 20.7 percent of its total wildland fuel area. In terms of the wildland-urban interface (WUI), this covers 32.3 million hectares (79.8 million acres), which is 3.8 percent of land area or 5.8 percent of fuel area. The WUI for industrial areas (known as WUI-Ind) covers 10.5 million hectares (25.9 million acres), which is 1.3 percent of land area or 1.9 percent of fuel area.
In terms of the provinces and territories with the largest interface areas, the report highlighted Quebec, Alberta, Ontario and British Columbia as being most exposed. At a more granular level, it stated that in populated areas such as cities, towns and settlements, 96 percent of locations had “at least some WUI within a five-kilometer buffer,” while 60 percent also had over 500 hectares (1,200 acres) of WUI within a five-kilometer buffer (327 of the total 544 areas).
Data: A Closer Look
Fort McMurray has, in some ways, become an epicenter for the generation of wildfire-related data in Canada. According to a study by the Institute for Catastrophic Loss Reduction, which looked at why certain homes survived, the Fort McMurray Wildfire “followed a well-recognized pattern known as the wildland/urban interface disaster sequence.”
The detailed study, which was conducted in the aftermath of the disaster, showed that 90 percent of properties in the areas affected by the wildfire survived the event. Further, “surviving homes were generally rated with ‘Low’ to ‘Moderate’ hazard levels and exhibited many of the attributes promoted by recommended FireSmart Canada guidelines.”
FireSmart Canada is an organization designed to promote greater wildfire resilience across the country. Similar to FireWise in the U.S., it has created a series of hazard factors spanning aspects such as building structure, vegetation/fuel, topography and ignition sites. It also offers a hazard assessment system that considers hazard layers and adoption rates of resilience measures.
According to the study: “Tabulation by hazard level shows that 94 percent of paired comparisons of all urban and country residential situations rated as having either ‘Low’ or ‘Moderate’ hazard levels survived the wildfire. Collectively, vegetation/fuel conditions accounted for 49 percent of the total hazard rating at homes that survived and 62 percent of total hazard at homes that failed to survive.”
Accessing the Data
In many ways, the findings of the Fort McMurray study are reassuring, as they clearly demonstrate the positive impact of structural and topographical risk mitigation measures in enhancing wildfire resilience—essentially proving the underlying scientific data. Further, the data shows that “a strong, positive correlation exists between home destruction during wildfire events and untreated vegetation within 30 meters of homes.”
“What the level of survivability in Fort McMurray showed was just how important structural hardening is,” Young explains. “It is not simply about defensible space, managing vegetation and ensuring sufficient distance from the WUI. These are clearly critical components of wildfire resilience, but by factoring in structural mitigation measures you greatly increase levels of survivability, even during urban conflagration events as extreme as Fort McMurray.”
What the level of survivability in Fort McMurray showed was just how important structural hardening is
Michael Young, senior director, product management, RMS
From an insurance perspective, access to these combined datasets is vital to effective exposure analysis and portfolio management. There is a concerted drive on the part of the Canadian insurance industry to adopt a more data-intensive approach to managing wildfire exposure.
Enhancing data availability across the region has been a key focus at RMS® in recent years, and efforts have culminated in the launch of the RMS® Canada Wildfire HD Model. It offers the most complete view of the country’s wildfire risk currently available and is the only probabilistic model available to the market that covers all 10 provinces.
“The hazard framework that the model is built on spans all of the critical wildfire components, including landscape and fire behavior patterns, fire weather simulations, fire and smoke spread, urban conflagration and ember intensity,” says Young. “In each instance, the hazard component has been precisely calibrated to reflect the dynamics, assumptions and practices that are specific to Canada.
“For example, the model’s fire spread component has been adjusted to reflect the fact that fires tend to burn for longer and over a wider area in the country, which reflects the watching brief that is often applied to managing wildfire events, as opposed to the more suppression-focused approach in the U.S.,” he continues. “Also, the urban conflagration component helps insurers address the issue of extreme tail-risk events such as Fort McMurray.”
Another key model differentiator is the wildfire vulnerability function, which automatically determines key risk parameters based on high-resolution data. In fact, RMS has put considerable efforts into building out the underlying datasets by blending multiple different information sources to generate fire, smoke and ember footprints at 50-meter resolution, as opposed to the standard 250-meter resolution of the publicly available data.
Critical site hazard data such as slope, distance to vegetation, and fuel types can be set against primary building modifiers such as construction, number of stories and year built. A further secondary modifier layer enables insurers to apply building-specific mitigation measures such as roof characteristics, ember accumulators and whether the property has cladding or a deck. Given the influence of such components on building survivability during the Fort McMurray Fire, such data is vital to exposure analysis at the local level.
A Changing Market
“The market has long recognized that greater data resolution is vital to adopting a more sophisticated approach to wildfire risk,” Young says. “As we worked to develop this new model, it was clear from our discussions with clients that there was an unmet need to have access to hard data that they could ‘hang numbers from.’ There was simply too little data to enable insurers to address issues such as potential return periods, accumulation risk and countrywide portfolio management.”
The ability to access more granular data might also be well timed in response to a growing shift in the information required during the insurance process. There is a concerted effort taking place across the Canadian insurance market to reduce the information burden on policyholders during the submission process. At the same time, there is a shift toward risk-based pricing.
“As we see this dynamic evolve,” Young says, “the reduced amount of risk information sourced from the insured will place greater importance on the need to apply modeled data to how insurance companies manage and price risk accurately. Companies are also increasingly looking at the potential to adopt risk-based pricing, a process that is dependent on the ability to apply exposure analysis at the individual location level. So, it is clear from the coming together of these multiple market shifts that access to granular data is more important to the Canadian wildfire market than ever.”

