
EXPOSURE
The Moody's insurance solutions magazine with a unique perspective and clear mission “... to provide insight and analysis to help insurance and risk professionals innovate, adapt, and deliver.”

Insurance: The next 10 years
Mohsen Rahnama, Cihan Biyikoglu and Moe Khosravy of RMS look to 2029, consider the…
Times Square, New York City
Tag: EARTHQUAKE
The Earthquakes That Changed Everything
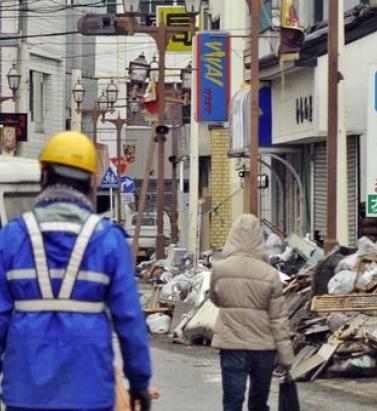
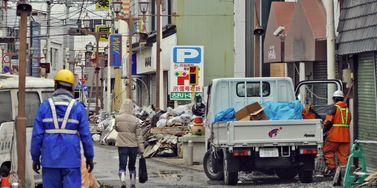
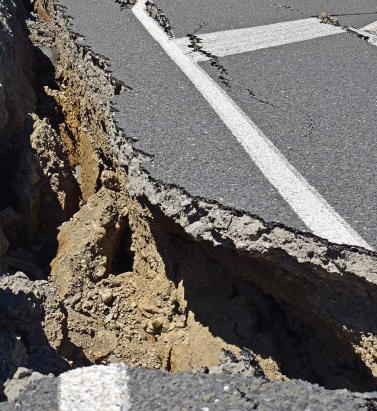
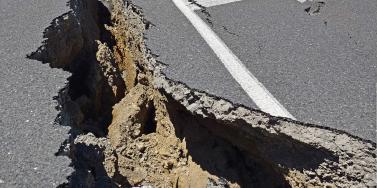
June 15, 2021In the decade since the devastating 2011 Tohoku and Christchurch Earthquakes, risk modelers such as RMS have been proactive in honoring the data generated from these events. It is a process of continuous learning and refinement, explains Chesley Williams and Laura Barksby from RMS, and the journey is still ongoing Within the space of just 17 days in 2011, Christchurch in New Zealand was rocked by an M6.3 earthquake — almost directly beneath the central business district (CBD) — and Japan was reeling from the most powerful earthquake in its history. At RMS, event response and reconnaissance teams were mobilized with the implicit knowledge they were there to do justice to those affected and to gather as much data as possible in order to advance seismic hazard and risk understanding. The tsunami waves triggered by the M9.0 Tohoku Earthquake inundated approximately 532 square kilometers (205 square miles) of the country's northeastern coastline. At its highest point, the waves reached over 15 meters (49 feet) in some localized areas. They overtopped seawalls, destroyed 122,000 buildings with over a million buildings severely or partially damaged, and damaged 230,000 vehicles. The event also triggered level seven meltdowns at Fukushima Dai-ichi Nuclear Power Station. The disaster at Chernobyl in 1986 was the only previous level seven event. The catastrophe was watched, in horror, in real time on news channels around the world. In total, it caused 15,899 deaths with 2,527 missing. Estimated economic damage totaled US$235 billion. When initiating a risk model update, cat modelers generally start with published national seismic hazard maps, which are typically built on consensus-based research. This represents an important first step — to review the key assumptions in such studies to make sure that they are consistent with the latest data and methods for seismic hazard and risk assessment. “When we developed our RMS® Japan Earthquake Model in 2005, the starting point was the first version of the national seismic hazard maps released in that year,” says Chesley Williams, senior director at RMS. “We had detailed discussions with the Japanese researchers who developed the maps to understand the key assumptions, particularly with a focus on the sources impacting Tokyo.” After the 2011 event, it is now clear that the Japan Trench can produce M9 events. The 2005 national hazard maps were focused on the M7-M8 events that had occurred in the preceding 450+ years. Looking at the geologic record that there have likely been large, possibly M9 events in the past, for example the Jogan Sanriku Earthquake in 869. Honoring the Data So much about both these events in 2011 — the Christchurch Earthquake on February 22 and Tohoku Earthquake on March 11 — was unexpected. Although New Zealand is a highly seismic region, the 2010-11 Canterbury Earthquake Sequence occurred in an area that historically had relatively low seismicity. Prior to the Canterbury Earthquake Sequence there were fewer than 30 earthquakes of magnitude four or greater in Christchurch and the immediate surrounding area. In the last decade, there have been more than 370 earthquakes in this region. The Christchurch Earthquake caused higher-than-expected ground motions and unprecedented liquefaction. As a result, it was the costliest event in the sequence and the second-highest insured loss from earthquake in history, after the Tohoku Earthquake. Japan is also highly seismic, but the Tohoku event occurred on structures that had not shown their full potential during the historical record. The intensity of M9.0 Tohoku was particularly surprising in scale — the highest-ever economic losses from a natural disaster — and the tsunami impact was unprecedented for Japan. “Both Christchurch and Tohoku taught us an awful lot about earthquake risk, including the secondary impacts of earthquakes — tsunami, liquefaction, landslides, nuclear disaster, aftershocks, business interruption, contingent business interruption, and post-event loss amplification,” commented Williams. “They transformed how we think about and model seismic hazard and risk.” New Insights Into Large-Magnitude Events Media coverage of Tohoku clearly showed that the damage in the tsunami induction zones was catastrophic. Once the search and rescue work had been completed, RMS sent a reconnaissance team to Japan to examine tsunami damage and also damage from strong ground shaking, which was extensive. Key observations from this work included that older (pre-1981) concrete buildings often sustained significant damage at high ground motions, traditional wooden homes with heavy tile roofs were more heavily damaged than more modern home construction, and contents damage in high-tech industrial facilities was particularly problematic for production continuity. Tsunami damage from the Tohoku EarthquakeIn the period immediately following a disaster, the Japanese government posts running tallies for the damage statistics as they are collected. This data is invaluable for understanding the scale of damage but also provides important insights with regard to drivers of loss. RMS used these damage statistics during the early event response process to help inform economic and insured loss estimates. In subsequent months, more comprehensive damage statistics compiled by Japan’s Ministry of Land, Infrastructure, Transport and Tourism proved vital for refinement of building performance modeling by RMS during strong ground shaking as well as for the development of vulnerability functions for tsunami inundation. Japan has created and maintained what is arguably the best and most dense national seismic network in the world. This network recorded more than 1,000 observations of the ground motions produced by the Tohoku Earthquake. Because large M9+ events are so rare (only five in the last 150 years), this observation dataset is key for understanding the strong ground motions produced by these extremely strong earthquakes. “Prior to this event, modeling of ground motions for events in this magnitude range had to be extrapolated from observation of smaller magnitude events,” says Williams. “Having more data to constrain M9+ ground motions helps refine seismic hazard and risk for all regions that can experience events in this magnitude range. Additionally, the observation data captured the details of the interaction of sedimentary basins and shallow site conditions on ground motion amplitude and frequency content.” The information has allowed RMS to dramatically improve the assessment of site condition impacts (both shallow and deep) to allow for a better assessment of localized interactions of ground motions on structural performance. Following the 2011 events, the Japanese government commissioned a series of comprehensive research studies to better understand earthquake potential for the key subduction zones (i.e., Japan Trench, Kuril Trench, Sagami Trough and Nankai Trough) and key crustal faults. The goal was to extend understanding of the historical record by utilizing the geologic record and providing information on past events over the last several thousand years. Key geologic datasets that were examined included paleotsunami deposits in coastal regions, coastal terraces uplifted in past events and paleoseismic studies to examine past ruptures on faults. The RMS Japan Earthquake Model was informed by all these datasets, allowing for a better representation of the range of events that can occur as well as better constraining the recurrence of future events on these structures. Advances in Tsunami Modeling Prior to the Tohoku event, RMS tsunami solutions had been focused on key tsunami scenario footprints that were developed to allow for an understanding of exposure accumulations at risk. “With the 2011 event and the contribution of approximately 30 percent of the loss from tsunami, it was clear that RMS needed to start providing fully probabilistic tsunami solutions,” said Williams. “The unique characteristics of the Tohoku tsunami event and its generation were key for guiding the RMS tsunami hazard and risk development.” The extremely high fault slip and large ocean bottom deformations highlighted the importance of modeling a range of slip models. RMS has chosen to use analytical slip modeling, and the sampling of alternative slip models for a given earthquake rupture allows for a more comprehensive understanding of tsunami and seismic risk. Tsunami insights from Tohoku also informed tsunami modeling in New Zealand. Following Tohoku, GNS Science, the New Zealand geoscience research institute, updated the maximum magnitude potential for the Hikurangi Subduction Zone to the east of the North Island. This assumption is reflected in the RMS® New Zealand Earthquake HD Model, and when combined with other updates, the larger magnitude has consequential impacts for portfolios with exposure in the capital of Wellington. Lessons in Liquefaction Residents in Christchurch had certainly felt the initial M7.1 Darfield Earthquake on September 4, 2010, some 40 kilometers (25 miles) west of the city, and power and water supplies were disrupted. The event caused moderate damage, the worst of which was to unreinforced masonry chimneys and walls. Damage was also observed in historic buildings. Following the Darfield event, assessments were made to repair the damaged buildings. However, despite the lower magnitude of the February 2011 earthquake, its proximity almost directly beneath the CBD meant that the ground motions were considerable. The Christchurch Earthquake generated widespread liquefaction and was part of an ongoing sequence of events, the largest of which, following February 2011, were M5.9, M5.5 and M5.3. A number of buildings that had been compromised during the September 2010 quake crumbled under the more intense ground motion of February 22, 2011. “It was the way the sequence moved eastward from Darfield to Christchurch so that it was virtually under the CBD that made it so devastating," said Laura Barksby, product manager at RMS. "It occurred in the wrong place at the wrong time.” The Christchurch event exacerbated preexisting damage, as well as damaging previously unscathed structures. Damage was so severe in some areas of Christchurch that a red zone was established, within which it was considered uneconomical to repair buildings, and structures were demolished regardless of their state. In total, the Canterbury Earthquake Sequence caused 185 fatalities and around NZ$40 billion in economic damage, of which an estimated NZ$33-38 billion was insured. The sudden change in seismicity was traumatic for residents and hampered efforts to assess the damage and begin the rebuild and restoration process. Access inside the CBD was restricted as many older structures, mostly unreinforced masonry buildings, were deemed unsafe. In the years immediately following the earthquake, demolitions outnumbered rebuilds by four to one. Aftermath of the Christchurch Earthquake in 2011“There has been a huge societal impact. The CBD was cordoned off and many businesses had to close,” says Barksby. “From a community perspective, they went from years of no earthquakes to almost waiting for the next to happen. The fact that the events were part of a sequence added to that sense of nervousness.” The overall headline, she explains, was the damage caused by liquefaction. “When we think about earthquakes, our immediate thoughts are about the ground shaking, but with Christchurch the focus was the liquefaction. It was responsible for around 30 to 40 percent of the losses, which is considerable.” During an earthquake, the ground motions can cause an increase in water pressure in soil layers beneath the ground. This can cause a reduction in the strength of the soil particles, and they subsequently behave like a liquid, which can cause significant ground deformation. In Christchurch, for buildings with shallow foundations, there was significant damage. One aspect that had not been appreciated prior to Christchurch was the scale of the destruction liquefaction could cause — and the loss it could generate. RMS reconnaissance observed that some buildings experienced no shake damage but considerable liquefaction damage. “The damage was particularly bad along the River Avon in Christchurch," says Barksby. "Due to the lateral displacement, it looked as though some of the buildings had been pulled apart — the Christchurch Earthquake really demonstrated the different types of liquefaction displacement.” This represented an important distinguishing feature when modeling liquefaction risk. “What was seen in Christchurch was a notable difference in the damage severity depending on the liquefaction process that had occurred. There was a correlation between the type of liquefaction displacement and building damage,” said Barksby. “Lateral spreading versus vertical displacement can have very different outcomes when it comes to loss. This distinction is not something we were able to capture before Christchurch, but thanks to data we can now model it at a high resolution and directly relate it to damage at a location.” The liquefaction impact was highly variable, a feature best captured by aerial photographs taken in the immediate aftermath. While some streets were largely unscathed, others looked as though they had been inundated by flood waters from liquefaction expressed at the surface. Barksby added, “We also saw streets with the whole spectrum of liquefaction damage, ranging from none at all to severe damage just a few hundred meters down the road.” Geotechnical engineering experts from around the world seized the opportunity to better understand the hazard, using Christchurch as a liquefaction laboratory. Through its collaboration with the Canterbury Geotechnical Database (now known as the New Zealand Geotechnical Database), RMS was able to analyze borehole data along with claims insights in order to better understand how soil characteristics, water table depth and proximity to water courses influenced the exposure. It was also really important to establish the link on how liquefaction translated into damage, as ultimately this was the main area of concern. Given the significant advances in seismic understanding after Christchurch, New Zealand was chosen as the location for the first RMS high-definition (HD) earthquake model. Released in 2016 and updated in 2020, the model leveraged the surge in data available from the Earthquake Commission (EQC) and GNS Science, among others, together with collaboration partners in the insurance market to offer a more granular view of the hazard and vulnerability. The RMS New Zealand Earthquake HD Model was also the first to include an advanced liquefaction module in addition to landslide, fire following earthquake and probabilistic tsunami. ʺWe applied all the lessons from Christchurch to the rest of the country at a more localized level than had been possible before,” says Barksby. “New Zealand was selected for the first high-definition model because we had so much data arising from the sequence that we knew we could leverage HD methodologies and Cloud-computing technology, plus the country has a sophisticated insurance market.” Barksby describes it as a paradigm shift, with the same underlying principles and framework rolled out to improve the granularity and level of hazard and vulnerability detail captured by the other earthquake models, including those for Japan and North America. Striving for a Resilient Future A decade on from Tohoku and Christchurch, communities in Japan and New Zealand are still coming to terms with the tragedies and how the quakes have shaped their lives. While very large earthquakes remain relatively rare, it is important to understand the potential, including from the associated perils. The return period for earthquakes on major faults or subduction zones is hundreds to thousands of years. Because they are so rare, each earthquake disaster has its own unique characteristics. The events of 2011 were an opportunity to learn and to continue to push the boundaries of earthquake science and seismic engineering. The earthquakes provided a unique opportunity to fundamentally improve the scientific and engineering communities’ understanding of earthquakes and their impacts. RMS has used this opportunity to redefine its perspective on seismic risk in Japan and in New Zealand, and beyond. Chesley Williams concludes: “At RMS, the goal is to implement the best available science, to understand the limitations of the modeling, to apply appropriate uncertainty assumptions and to ensure that we make the best estimate of seismic risk based on the information we have today.”


Location, Location, Location: A New Era in Data Resolution
February 11, 2021The insurance industry has reached a transformational point in its ability to accurately understand the details of exposure at risk. It is the point at which three fundamental components of exposure management are coming together to enable (re)insurers to systematically quantify risk at the location level: the availability of high-resolution location data, access to the technology to capture that data and advances in modeling capabilities to use that data. Data resolution at the individual building level has increased considerably in recent years, including the use of detailed satellite imagery, while advances in data sourcing technology have provided companies with easier access to this more granular information. In parallel, the evolution of new innovations, such as RMS® High Definition Models™ and the transition to cloud-based technologies, has facilitated a massive leap forward in the ability of companies to absorb, analyze and apply this new data within their actuarial and underwriting ecosystems. Quantifying Risk Uncertainty “Risk has an inherent level of uncertainty,” explains Mohsen Rahnama, chief modeling officer at RMS. “The key is how you quantify that uncertainty. No matter what hazard you are modeling, whether it is earthquake, flood, wildfire or hurricane, there are assumptions being made. These catastrophic perils are low-probability, high-consequence events as evidenced, for example, by the 2017 and 2018 California wildfires or Hurricane Katrina in 2005 and Hurricane Harvey in 2017. For earthquake, examples include Tohoku in 2011, the New Zealand earthquakes in 2010 and 2011, and Northridge in 1994. For this reason, risk estimation based on an actuarial approach cannot be carried out for these severe perils; physical models based upon scientific research and event characteristic data for estimating risk are needed.” A critical element in reducing uncertainty is a clear understanding of the sources of uncertainty from the hazard, vulnerability and exposure at risk. “Physical models, such as those using a high-definition approach, systematically address and quantify the uncertainties associated with the hazard and vulnerability components of the model,” adds Rahnama. “There are significant epistemic (also known as systematic) uncertainties in the loss results, which users should consider in their decision-making process. This epistemic uncertainty is associated with a lack of knowledge. It can be subjective and is reducible with additional information.” What are the sources of this uncertainty? For earthquake, there is uncertainty about the ground motion attenuation functions, soil and geotechnical data, the size of the events, or unknown faults. Rahnama explains: “Addressing the modeling uncertainty is one side of the equation. Computational power enables millions of events and more than 50,000 years of simulation to be used, to accurately capture the hazard and reduce the epistemic uncertainty. Our findings show that in the case of earthquakes the main source of uncertainty for portfolio analysis is ground motion; however, vulnerability is the main driver of uncertainty for a single location.” The quality of the exposure data as the input to any mathematical models is essential to assess the risk accurately and reduce the loss uncertainty. However, exposure could represent the main source of loss uncertainty, especially when exposure data is provided in aggregate form. Assumptions can be made to disaggregate exposure using other sources of information, which helps to some degree reduce the associated uncertainty. Rahnama concludes, “Therefore, it is essential in order to minimize the uncertainty related to exposure to try to get location-level information about the exposure, in particular for the region with the potential of liquification for earthquake or for high-gradient hazard such as flood and wildfire.” A critical element in reducing that uncertainty, removing those assumptions and enhancing risk understanding is combining location-level data and hazard information. That combination provides the data basis for quantifying risk in a systematic way. Understanding the direct correlation between risk or hazard and exposure requires location-level data. The potential damage caused to a location by flood, earthquake or wind will be significantly influenced by factors such as first-floor elevation of a building, distance to fault lines or underlying soil conditions through to the quality of local building codes and structural resilience. And much of that granular data is now available and relatively easy to access. “The amount of location data that is available today is truly phenomenal,” believes Michael Young, vice president of product management at RMS, “and so much can be accessed through capabilities as widely available as Google Earth. Straightforward access to this highly detailed satellite imagery means that you can conduct desktop analysis of individual properties and get a pretty good understanding of many of the building and location characteristics that can influence exposure potential to perils such as wildfire.” Satellite imagery is already a core component of RMS model capabilities, and by applying machine learning and artificial intelligence (AI) technologies to such images, damage quantification and differentiation at the building level is becoming a much more efficient and faster undertaking — as demonstrated in the aftermath of Hurricanes Laura and Delta. “Within two days of Hurricane Laura striking Louisiana at the end of August 2020,” says Rahnama, “we had been able to assess roof damage to over 180,000 properties by applying our machine-learning capabilities to satellite images of the affected areas. We have ‘trained’ our algorithms to understand damage degree variations and can then superimpose wind speed and event footprint specifics to group the damage degrees into different wind speed ranges. What that also meant was that when Hurricane Delta struck the same region weeks later, we were able to see where damage from these two events overlapped.” The Data Intensity of Wildfire Wildfire by its very nature is a data-intensive peril, and the risk has a steep gradient where houses in the same neighborhood can have drastically different risk profiles. The range of factors that can make the difference between total loss, partial loss and zero loss is considerable, and to fully grasp their influence on exposure potential requires location-level data. The demand for high-resolution data has increased exponentially in the aftermath of recent record-breaking wildfire events, such as the series of devastating seasons in California in 2017-18, and unparalleled bushfire losses in Australia in 2019-20. Such events have also highlighted myriad deficiencies in wildfire risk assessment including the failure to account for structural vulnerabilities, the inability to assess exposure to urban conflagrations, insufficient high-resolution data and the lack of a robust modeling solution to provide insight about fire potential given the many years of drought. Wildfires in 2017 devastated the town of Paradise, California In 2019, RMS released its U.S. Wildfire HD Model, built to capture the full impact of wildfire at high resolution, including the complex behaviors that characterize fire spread, ember accumulation and smoke dispersion. Able to simulate over 72 million wildfires across the contiguous U.S., the model creates ultrarealistic fire footprints that encompass surface fuels, topography, weather conditions, moisture and fire suppression measures. “To understand the loss potential of this incredibly nuanced and multifactorial exposure,” explains Michael Young, “you not only need to understand the probability of a fire starting but also the probability of an individual building surviving. “If you look at many wildfire footprints,” he continues, “you will see that sometimes up to 60 percent of buildings within that footprint survived, and the focus is then on what increases survivability — defensible space, building materials, vegetation management, etc. We were one of the first modelers to build mitigation factors into our model, such as those building and location attributes that can enhance building resilience.” Moving the Differentiation Needle In a recent study by RMS and the Center for Insurance Policy Research, the Insurance Institute for Business and Home Safety and the National Fire Protection Association, RMS applied its wildfire model to quantifying the benefits of two mitigation strategies — structural mitigation and vegetation management — assessing hypothetical loss reduction benefits in nine communities across California, Colorado and Oregon. Young says: “By knowing what the building characteristics and protection measures are within the first 5 feet and 30 feet at a given property, we were able to demonstrate that structural modifications can reduce wildfire risk up to 35 percent, while structural and vegetation modifications combined can reduce it by up to 75 percent. This level of resolution can move the needle on the availability of wildfire insurance as it enables development of robust rating algorithms to differentiate specific locations — and means that entire neighborhoods don’t have to be non-renewed.” “By knowing what the building characteristics and protection measures are within the first 5 feet and 30 feet at a given property, we were able to demonstrate that structural modifications can reduce wildfire risk up to 35 percent, while structural and vegetation modifications combined can reduce it by up to 75 percent” Michael Young, RMS While acknowledging that modeling mitigation measures at a 5-foot resolution requires an immense granularity of data, RMS has demonstrated that its wildfire model is responsive to data at that level. “The native resolution of our model is 50-meter cells, which is a considerable enhancement on the zip-code level underwriting grids employed by some insurers. That cell size in a typical suburban neighborhood encompasses approximately three-to-five buildings. By providing the model environment that can utilize information within the 5-to-30-foot range, we are enabling our clients to achieve the level of data fidelity to differentiate risks at that property level. That really is a potential market game changer.” Evolving Insurance Pricing It is not hyperbolic to suggest that being able to combine high-definition modeling with high-resolution data can be market changing. The evolution of risk-based pricing in New Zealand is a case in point. The series of catastrophic earthquakes in the Christchurch region of New Zealand in 2010 and 2011 provided a stark demonstration of how insufficient data meant that the insurance market was blindsided by the scale of liquefaction-related losses from those events. “The earthquakes showed that the market needed to get a lot smarter in how it approached earthquake risk,” says Michael Drayton, consultant at RMS, “and invest much more in understanding how individual building characteristics and location data influenced exposure performance, particularly in relation to liquefaction. “To get to grips with this component of the earthquake peril, you need location-level data,” he continues. “To understand what triggers liquefaction, you must analyze the soil profile, which is far from homogenous. Christchurch, for example, sits on an alluvial plain, which means there are multiple complex layers of silt, gravel and sand that can vary significantly from one location to the next. In fact, across a large commercial or industrial complex, the soil structure can change significantly from one side of the building footprint to the other.” Extensive building damage in downtown Christchurch, New Zealand after 2011 earthquakeThe aftermath of the earthquake series saw a surge in soil data as teams of geotech engineers conducted painstaking analysis of layer composition. With multiple event sets to use, it was possible to assess which areas suffered soil liquefaction and from which specific ground-shaking intensity. “Updating our model with this detailed location information brought about a step-change in assessing liquefaction exposures. Previously, insurers could only assess average liquefaction exposure levels, which was of little use where you have highly concentrated risks in specific areas. Through our RMS® New Zealand Earthquake HD Model, which incorporates 100-meter grid resolution and the application of detailed ground data, it is now possible to assess liquefaction exposure potential at a much more localized level.” “Through our RMS® New Zealand Earthquake HD model, which incorporates 100-meter grid resolution and the application of detailed ground data, it is now possible to assess liquefaction exposure potential at a much more localized level” — Michael Drayton, RMS This development represents a notable market shift from community to risk-based pricing in New Zealand. With insurers able to differentiate risks at the location level, this has enabled companies such as Tower Insurance to more accurately adjust premium levels to reflect risk to the individual property or area. In its annual report in November 2019, Tower stated: “Tower led the way 18 months ago with risk-based pricing and removing cross-subsidization between low- and high-risk customers. Risk-based pricing has resulted in the growth of Tower’s portfolio in Auckland while also reducing exposure to high-risk areas by 16 percent. Tower’s fairer approach to pricing has also allowed the company to grow exposure by 4 percent in the larger, low-risk areas like Auckland, Hamilton, and Taranaki.” Creating the Right Ecosystem The RMS commitment to enable companies to put high-resolution data to both underwriting and portfolio management use goes beyond the development of HD Models™ and the integration of multiple layers of location-level data. Through the launch of RMS Risk Intelligence™, its modular, unified risk analytics platform, and the Risk Modeler™ application, which enables users to access, evaluate, compare and deploy all RMS models, the company has created an ecosystem built to support these next-generation data capabilities. Deployed within the Cloud, the ecosystem thrives on the computational power that this provides, enabling proprietary and tertiary data analytics to rapidly produce high-resolution risk insights. A network of applications — including the ExposureIQ™ and SiteIQ™ applications and Location Intelligence API — support enhanced access to data and provide a more modular framework to deliver that data in a much more customized way. “Because we are maintaining this ecosystem in the Cloud,” explains Michael Young, “when a model update is released, we can instantly stand that model side-by-side with the previous version. As more data becomes available each season, we can upload that new information much faster into our model environment, which means our clients can capitalize on and apply that new insight straightaway.” Michael Drayton adds: “We’re also offering access to our capabilities in a much more modular fashion, which means that individual teams can access the specific applications they need, while all operating in a data-consistent environment. And the fact that this can all be driven through APIs means that we are opening up many new lines of thought around how clients can use location data.” Exploring What Is Possible There is no doubt that the market is on the cusp of a new era of data resolution — capturing detailed hazard and exposure and using the power of analytics to quantify the risk and risk differentiation. Mohsen Rahnama believes the potential is huge. “I foresee a point in the future where virtually every building will essentially have its own social-security-like number,” he believes, “that enables you to access key data points for that particular property and the surrounding location. It will effectively be a risk score, including data on building characteristics, proximity to fault lines, level of elevation, previous loss history, etc. Armed with that information — and superimposing other data sources such as hazard data, geological data and vegetation data — a company will be able to systematically price risk and assess exposure levels for every asset up to the portfolio level.” “The only way we can truly assess this rapidly changing risk is by being able to systematically evaluate exposure based on high-resolution data and advanced modeling techniques that incorporate building resilience and mitigation measures” — Mohsen Rahnama, RMS Bringing the focus back to the here and now, he adds, the expanding impacts of climate change are making the need for this data transformation a market imperative. “If you look at how many properties around the globe are located just one meter above sea level, we are talking about trillions of dollars of exposure. The only way we can truly assess this rapidly changing risk is by being able to systematically evaluate exposure based on high-resolution data and advanced modeling techniques that incorporate building resilience and mitigation measures. How will our exposure landscape look in 2050? The only way we will know is by applying that data resolution underpinned by the latest model science to quantify this evolving risk.”


Like Moths to the Flame
September 06, 2019Why is it that, in many different situations and perils, people appear to want to relocate toward the risk? What is the role of the private insurance and reinsurance industry in curbing their clients’ risk tropism? Florida showed rapid percentage growth in terms of exposure and number of policyholders If the Great Miami Hurricane of 1926 were to occur again today it would result in insurance losses approaching US$200 billion. Even adjusted for inflation, that is hundreds of times more than the US$100 million damage toll in 1926. Over the past 100 years, the Florida coast has developed exponentially, with wealthy individuals drawn to buying lavish coastal properties — and the accompanying wind and storm-surge risks. Since 2000, the number of people living in coastal areas of Florida increased by 4.2 million, or 27 percent, to 19.8 million in 2015, according to the U.S. Census Bureau. This is an example of unintended “risk tropism,” explains Robert Muir-Wood, chief research officer at RMS. Just as the sunflower is a ‘heliotrope’, turning toward the sun, research has shown how humans have an innate drive to live near water, on a river or at the beach, often at increased risk of flood hazards. “There is a very strong human desire to find the perfect primal location for your house. It is something that is built deeply into the human psyche,” Muir-Wood explains. “People want to live with the sound of the sea, or in the forest ‘close to nature,’ and they are drawn to these locations thinking about all the positives and amenity values, but not really understanding or evaluating the accompanying risk factors. “People will pay a lot to live right next to the ocean,” he adds. “It’s an incredibly powerful force and they will invest in doing that, so the price of land goes up by a factor of two or three times when you get close to the beach.” Even when beachfront properties are wiped out in hurricane catastrophes, far from driving individuals away from a high-risk zone, research shows they simply “build back bigger,” says Muir-Wood. “The disaster can provide the opportunity to start again, and wealthier people move in and take the opportunity to rebuild grander houses. At least the new houses are more likely to be built to code, so maybe the reduction in vulnerability partly offsets the increased exposure at risk.” Risk tropism can also be found with the encroachment of high-value properties into the wildlands of California, leading to a big increase in wildfire insurance losses. Living close to trees can be good for mental health until those same trees bring a conflagration. Insurance losses due to wildfire exceeded US$10 billion in 2017 and have already breached US$12 billion for last year’s Camp, Hill and Woolsey Fires, according to the California Department of Insurance. It is not the number of fires that have increased, but the number of houses consumed by the fires. “Insurance tends to stop working when you have levels of risk above one percent […] People are unprepared to pay for it” Robert Muir-Wood RMS Muir-Wood notes that the footprint of the 2017 Tubbs Fire, with claims reaching to nearly US$10 billion, was very similar to the area burned during the Hanley Fire of 1964. The principal difference in outcome is driven by how much housing has been developed in the path of the fire. “If a fire like that arrives twice in one hundred years to destroy your house, then the amount you are going to have to pay in insurance premium is going to be more than 2 percent of the value per year,” he says. “People will think that’s unjustified and will resist it, but actually insurance tends to stop working when you have levels of risk cost above 1 percent of the property value, meaning, quite simply, that people are unprepared to pay for it.” Risk tropism can also be found in the business sector, in the way that technology companies have clustered in Silicon Valley: a tectonic rift within a fast-moving tectonic plate boundary. The tectonics have created the San Francisco Bay and modulate the climate to bring natural air-conditioning. “Why is it that, around the world, the technology sector has picked locations — including Silicon Valley, Seattle, Japan and Taiwan — that are on plate boundaries and are earthquake prone?” asks Muir-Wood. “There seems to be some ideal mix of mountains and water. The Bay Area is a very attractive environment, which has brought the best students to the universities and has helped companies attract some of the smartest people to come and live and work in Silicon Valley,” he continues. “But one day there will be a magnitude 7+ earthquake in the Bay Area that will bring incredible disruption, that will affect the technology firms themselves.” Insurance and reinsurance companies have an important role to play in informing and dissuading organizations and high net worth individuals from being drawn toward highly exposed locations; they can help by pricing the risk correctly and maintaining underwriting discipline. The difficulty comes when politics and insurance collide. The growth of Fair Access to Insurance Requirements (FAIR) plans and beach plans, offering more affordable insurance in parts of the U.S. that are highly exposed to wind and quake perils, is one example of how this function is undermined. At its peak, the size of the residual market in hurricane-exposed states was US$885 billion, according to the Insurance Information Institute (III). It has steadily been reduced, partly as a result of the influx of non-traditional capacity from the ILS market and competitive pricing in the general reinsurance market. However, in many cases the markets-of-last-resort remain some of the largest property insurers in coastal states. Between 2005 and 2009 (following Hurricanes Charley, Frances, Ivan and Jeanne in 2004), the plans in Mississippi, Texas and Florida showed rapid percentage growth in terms of exposure and number of policyholders. A factor fueling this growth, according to the III, was the rise in coastal properties. As long as state-backed insurers are willing to subsidize the cost of cover for those choosing to locate in the riskiest locations, private (re)insurance will fail as an effective check on risk tropism, thinks Muir-Wood. “In California there are quite a few properties that have not been able to get standard fire insurance,” he observes. “But there are state or government-backed schemes available, and they are being used by people whose wildfire risk is considered to be too high.”


Shaking Up Workers' Compensation
September 06, 2019Are (re)insurers sufficiently capitalized to withstand a major earthquake in a metropolitan area during peak hours? The U.S. workers’ compensation insurance market continues to generate underwriting profit. According to Fitch Ratings, 2019 is on track to mark the fifth consecutive year of profits and deliver a statutory combined ratio of 86 percent in 2018. Since 2015, it has achieved an annual average combined ratio of 93 percent. The market’s size has increased considerably since the 2008 financial crisis sparked a flurry of activity in the workers’ compensation arena. Over the last 10 years, written premiums have risen 50 percent from approximately US$40 billion to almost US$60 billion, aided by low unemployment and growth in rate and wages. Yet market conditions are changing. The pricing environment is deteriorating, prior-year reserve releases are slowing and severity is ticking upwards. And while loss reserves currently top US$150 billion, questions remain over whether these are sufficient to bear the brunt of a major earthquake in a highly populated area. The Big One California represents over 20 percent of the U.S. workers’ compensation market. The Workers’ Compensation Insurance Rating Bureau of California (WCIRB) forecasts a written premium pot of US$15.7 billion for 2019, a slight decline on 2018’s US$17 billion figure. “So, the workers’ compensation sector’s largest premium is concentrated in the area of the U.S. most exposed to earthquake risk,” explains Nilesh Shome, vice president at RMS. “This problem is unique to the U.S., since in most other countries occupational injury is covered by government insurance schemes instead of the private market. Further, workers’ compensation policies have no limits, so they can be severely impacted by a large earthquake.” Workers’ compensation insurers enjoy relatively healthy balance sheets, with adequate profitability and conservative premium-to-surplus ratios. But, when you assess the industry’s exposure to large earthquakes in more detail, the surplus base starts to look a little smaller. “We are also talking about a marketplace untested in modern times,” he continues. “The 1994 Northridge Earthquake in Los Angeles, for example, while causing major loss, occurred at 4:30 a.m. when most people were still in bed, so had limited impact from a workers’ compensation perspective.” Analyzing the Numbers Working with the WCIRB, RMS modeled earthquake scenarios using Version 17 of the RMS® North America Earthquake Casualty Model, which incorporates the latest science in earthquake hazard and vulnerability research. The portfolio provided by the WCIRB contained exposure information for 11 million full-time-equivalent employees, including occupation details for each. The analysis showed that the average annual estimated insured loss is US$29 million, which corresponds to 0.5 cents per $100 payroll and $2.50 per employee. The 1-in-100-year insurance loss is expected to exceed US$300 million, around 5,000 casualties including 300 fatalities; while at peak work-time hours, the loss could rise to US$1.5 billion. For a 1-in-250-year loss, the figure could top US$1.4 billion and more than 1,000 fatalities, rising to US$5 billion at peak work-time hours. But looking at the magnitude 7.8 San Francisco Earthquake in 1906 at 5:12 a.m., the figure would be 7,300 injuries, 1,900 fatalities and around US$1 billion in loss. At peak work hours, this would rise to 22,000 casualties, 5,800 fatalities and a US$3 billion loss. To help reduce the impact of major earthquakes, RMS is working with the Berkeley Research Lab and the United States Geological Survey (USGS) to research the benefits of an earthquake early warning system (EEWS) and safety measures such as drop-cover-hold and evacuating buildings after an EEWS alarm. Initial studies indicate that an EEWS alert for the large, faraway earthquakes such as the 1857 magnitude 7.9 Fort Tejon Earthquake near Los Angeles can reduce injuries by 20 percent-50 percent. Shome concludes: “It is well known in the industry that workers’ compensation loss distribution has a long tail, and at conferences RMS has demonstrated how our modeling best captures this tail. The model considers many low probability, high consequence events by accurately modeling the latest USGS findings.”
The Power of a Crisis
September 06, 2019As Christchurch City Council continues to build back better, will its resilience investment pay dividends when it comes to citywide insurance cover? The Canterbury Earthquake Sequence is the largest insured event in New Zealand’s history. Between September 2010 and December 2011, four major earthquakes caused damage to approximately 168,000 residential buildings. The earthquakes spawned more than 770,000 claims for the country’s Earthquake Commission (EQC) alone, resulting in a payout of around NZ$10 billion (US$6.4 billion). The private sector absorbed almost twice that, with the Insurance Council of New Zealand putting the figure at NZ$21.4 billion (as of March 31, 2019). Christchurch Art Gallery. The city’s art gallery, for example, has been retrofitted to resist even the most severe earthquake activity. Nine years on from the initial tremors, there remain over 1,200 open property claims in the private market, while the outstanding figure for the EQC stood at some 2,600 claims in February 2018. “Dealing with the property claims was extremely challenging,” explains Raf Manji, chair of the Christchurch City Council’s Finance Committee, “not just in terms of contractual issues, but because the insurance was based on building-by-building cover. And when you’re dealing with damage to so many buildings, it is going to take a very long time to agree what that damage is.” Building Back Better The need to rebuild Christchurch presented the city with an opportunity. “As American politician Rahm Emanuel once said, ‘Never let a crisis go to waste,’” says Lianne Dalziel, mayor of Christchurch. “The earthquakes provided a major opportunity to build back better and ensure we embed resilience into every aspect, from below ground up.” That commitment means that new construction, whether of above-ground assets or horizontal infrastructure, is being carried out to a level much higher than building codes dictate. “With the information, we want more informed conversations with both traditional and alternative markets about how we transfer risk more effectively” Raf Manji Christchurch City Council “We’re building to an exceptionally high standard,” states Mike Gillooly, chief resilience officer for the city. This is a relatively new public position created following Christchurch’s inclusion in the first wave of the Rockefeller Foundation’s 100 Resilient Cities program. “The city’s art gallery, for example, has been retrofitted to resist even the most severe earthquake activity,” Gillooly continues. But this dedication to resilience goes beyond the immediate rebuild. The council is also making resilience a core component of its long-term strategic planning. The city’s 2021-2051 infrastructure strategy, which covers the council’s investments in water supply, wastewater, stormwater, transport, parks, facilities, solid waste and communication technology for the next 30 years, will have resilience as its overarching theme. “This is the first time we are proactively building risk and resilience into our long-term planning framework,” states Dalziel. “We are developing a much deeper appreciation of risk and have spent considerable time understanding our infrastructure. We are also working toward a much more sophisticated engagement with risk at the community level.” “It’s not only about strengthening our physical infrastructure,” she continues. “It’s also about strengthening our social infrastructure.” “We are committed to promoting greater community well-being. We need to build up social capital by bringing people together to plan for an uncertain future. High levels of social capital accelerate recovery in the aftermath of a shock, while also creating greater inherent resilience to more slow-moving challenges, such as climate change and associated rising sea levels.” Dalziel is quick to stress the importance of insurance in all this. “There is a strong relationship between economic resilience and social resilience, and the role of insurance in facilitating both cannot be underestimated. The value of insurance does not simply equal the sum of claims paid — it’s as much about the financial and social well-being that it supports.” Making Resilience Pay Recently insurers across New Zealand have been shifting their appetite and premiums in high-hazard regions to be more reflective of the country’s risk profile. There has been a shift too in the council’s approach to insurance — a shift that is central to its resilience efforts, explains Manji. “Following the earthquakes, Lianne asked me to run for council. I was a former financial markets trader and she wanted someone onboard with a financial background. But when I joined, I was taken aback by the lack of risk understanding that I saw at the local government level.” One of his first steps was to set up an independently chaired audit and risk committee and introduce a new risk management framework — a model that has since been adopted by Auckland. “Through this new framework, we were able to establish a much more sophisticated view of risk,” he explains, “and we also launched a five-year program to document every single asset in place — both above and below ground. Having this granular level of exposure insight means we can assess our approach to mitigating, retaining and transferring risk from a much more data-informed position.” At present, Christchurch is conservatively insured. This is a very deliberate choice, however, and Manji is convinced of the benefits of this approach. “This excess capacity means we have headroom into which we can grow as we continue to construct new and reconstruct old assets. That’s a much stronger position to be in than having to return to the market seeking more limit when capacity may be limited. It also demonstrates a long-term commitment to the insurance market upon which you can have much more constructive, ongoing dialogue.” Data-Informed Dialogue Christchurch City Council has been making use of insurance capital for many years. It was the 2010-11 earthquakes, though, that spurred its focus on arming itself with increasingly higher-resolution data. “We’re now coming to the table each year with an ever more accurate picture of our exposure. Working with RMS, we’ve been able to significantly evolve our risk thinking based on a range of citywide loss scenarios, and to look at ways of creating a more effective balance between traditional and more innovative parametric-based solutions.” That desire for balance does not just apply to the source of Christchurch capital, but also what kinds of assets that capital covers. At present, while the council has secured coverage for 65 percent of the value of its above-ground structures, it has only managed to buy insurance to cover approximately 15 percent of its underground infrastructure. “The insurance market is not comfortable with providing cover for underground infrastructure because it tends not to be well understood or documented,” Manji continues. “Unlike most cities, however, we know exactly what is underground and just how resilient it is. With that information, we want to have more informed conversations — with both the traditional market and alternative providers of risk capital — about how we transfer this risk more effectively. Parametric-based solutions, for example, give us the opportunity to look beyond typical building replacement covers and take a bigger-picture view of what we want to achieve from our investment in risk transfer. “And whereas an indemnity-based policy is designed primarily to return you to where you were prior to the loss, parametric payouts can be deployed for what ever purpose you want. That flexibility — along with the speed and certainty of payout — is incredibly valuable.” For Gillooly, it is about becoming an increasingly sophisticated user of risk capital and engaging in ever more mature dialogue with the markets. “If we can demonstrate through the data and analytics that we understand the exposure, that we’ve quantified the risk and we’re investing in effective risk reduction, then the market needs to acknowledge these efforts in the form of increased capacity, reduced premiums or both. Data, analytics and risk insights will continue to be the key focus of our annual discussions with the London market — and will allow us to explore parametric insurance-linked securities with confidence too.”
Earthquake Risk: New Zealand Insurance Sector Experiences Growing Pains
May 20, 2019Speed of change around homeowners insurance is gathering pace as insurers move to differential pricing models New Zealand’s insurance sector is undergoing fundamental change as the impact of the NZ$40 billion (US$27 billion) Canterbury Earthquake and more recent Kaikōura disaster spur efforts to create a more sustainable, risk-reflective marketplace. In 2018, EXPOSURE examined risk-based pricing in the region following Tower Insurance’s decision to adopt such an approach to achieve a “fairer and more equitable way of pricing risk.” Since then, IAG, the country’s largest general insurer, has followed suit, with properties in higher-risk areas forecast to see premium hikes, while it also adopts “a conservative approach” to providing insurance in peril-prone areas. “Insurance, unsurprisingly, is now a mainstream topic across virtually every media channel in New Zealand,” says Michael Drayton, a consultant at RMS. “There has been a huge shift in how homeowners insurance is viewed, and it will take time to adjust to the introduction of risk-based pricing.” Another market-changing development is the move by the country’s Earthquake Commission (EQC) to increase the first layer of buildings’ insurance cover it provides from NZ$100,000 to NZ$150,000 (US$68,000 to US$101,000), while lowering contents cover from NZ$20,000 (US$13,500) to zero. These changes come into force in July 2019. Modeling the average annual loss (AAL) impact of these changes based on the updated RMS New Zealand Earthquake Industry Exposure Database shows the private sector will see a marginal increase in the amount of risk it takes on as the AAL increase from the contents exit outweighs the decrease from the buildings cover hike. These findings have contributed greatly to the debate around the relationship between buildings and contents cover. One major issue the market has been addressing is its ability to accurately estimate sums insured. According to Drayton, recent events have seen three separate spikes around exposure estimates. “The first spike occurred in the aftermath of the Christchurch Earthquake,” he explains, “when there was much debate about commercial building values and limits, and confusion relating to sums insured and replacement values. “The second occurred with the move away from open-ended replacement policies in favor of sums insured for residential properties. “Now that the EQC has removed contents cover, we are seeing another spike as the private market broaches uncertainty around content-related replacement values. “There is very much an education process taking place across New Zealand’s insurance industry,” Drayton concludes. “There are multiple lessons being learned in a very short period of time. Evolution at this pace inevitably results in growing pains, but if it is to achieve a sustainable insurance market it must push on through.”


Opening Pandora's Box
May 20, 2019With each new stride in hazard research and science comes the ability to better calculate and differentiate risk Efforts by RMS scientists and engineers to better understand liquefaction vulnerability is shedding new light on the secondary earthquake hazard. However, this also makes it more likely that, unless they can charge for the risk, (re)insurance appetite will diminish for some locations while also increasing in other areas. A more differentiated approach to underwriting and pricing is an inevitable consequence of investment in academic research. Once something has been learned, it cannot be unlearned, explains Robert Muir-Wood, chief research officer at RMS. “In the old days, everybody paid the same for insurance because no one had the means to actually determine how risk varied from location to location, but once you learn how to differentiate risk well, there’s just no going back. It’s like Pandora’s box has been opened. “There are two general types of liquefaction that are just so severe that no one should build on them” Tim Ancheta RMS “At RMS we are neutral on risk,” he adds. “It’s our job to work for all parties and provide the best neutral science-based perspective on risk, whether that’s around climate change in California or earthquake risk in New Zealand. And we and our clients believe that by having the best science-based assessment of risk they can make effective decisions about their risk management.” Spotting a Gap in the Science On September 28, 2018, a large and shallow M7.5 earthquake struck Central Sulawesi, Indonesia, triggering a tsunami over 2 meters in height. The shaking and tsunami caused widespread devastation in and around the provincial capital Palu, but according to a report published by the GEER Association, it was liquefaction and landslides that caused thousands of buildings to collapse in a catastrophe that claimed over 4,000 lives. It was the latest example of a major earthquake that showed that liquefaction — where the ground moves and behaves as if it is a liquid — can be a much bigger driver of loss than previously thought. The Tōhoku Earthquake in Japan during 2011 and the New Zealand earthquakes in Christchurch in 2010 and 2011 were other high-profile examples. The earthquakes in New Zealand caused a combined insurance industry loss of US$22.8-US$26.2 billion, with widespread liquefaction undermining the structural integrity of hundreds of buildings. Liquefaction has been identified by a local engineer as causing 50 percent of the loss. Now, research carried out by RMS scientists is helping insurers and other stakeholders to better understand the impact that liquefaction can have on earthquake-related losses. It is also helping to pinpoint other parts of the world that are highly vulnerable to liquefaction following earthquake. “Before Christchurch we had not appreciated that you could have a situation where a midrise building may be completely undamaged by the earthquake shaking, but the liquefaction means that the building has suffered differential settlement leaving the floors with a slight tilt, sufficient to be declared a 100 percent loss,” explains Muir-Wood. “We realized for the first time that you actually have to model the damage separately,” he continues. “Liquefaction is completely separate to the damage caused by shaking. But in the past we treated them as much of the same. Separating out the hazards has big implications for how we go about modeling the risk, or identifying other situations where you are likely to have extreme liquefaction at some point in the future.” The Missing Link Tim Ancheta, a risk modeler for RMS based in Newark, California, is responsible for developing much of the understanding about the interaction between groundwater depth and liquefaction. Using data from the 2011 earthquake in Christchurch and boring data from numerous sites across California to calculate groundwater depth, he has been able to identify sites that are particularly prone to liquefaction. “I was hired specifically for evaluating liquefaction and trying to develop a model,” he explains. “That was one of the key goals for my position. Before I joined RMS about seven years back, I was a post-doctoral researcher at PEER — the Pacific Earthquake Engineering Research Center at Berkeley — working on ground motion research. And my doctoral thesis was on the spatial variability of ground motions.” Joining RMS soon after the earthquakes in Christchurch had occurred meant that Ancheta had access to a wealth of new data on the behavior of liquefaction. For the first time, it showed the significance of ground- water depth in determining where the hazard was likely to occur. Research, funded by the New Zealand government, included a survey of liquefaction observations, satellite imagery, a time series of groundwater levels as well as the building responses. It also included data collected from around 30,000 borings. “All that had never existed on such a scale before,” says Ancheta. “And the critical factor here was they investigated both liquefaction sites and non-liquefaction sites — prior surveys had only focused on the liquefaction sites.” Whereas the influence of soil type on liquefaction had been reasonably well understood prior to his research, previous studies had not adequately incorporated groundwater depth. “The key finding was that if you don’t have a clear understanding of where the groundwater is shallow or where it is deep, or the transition — which is important — where you go from a shallow to deep groundwater depth, you can’t turn on and off the liquefaction properly when an earthquake happens,” reveals Ancheta. Ancheta and his team have gone on to collect and digitize groundwater data, geology and boring data in California, Japan, Taiwan and India with a view to gaining a granular understanding of where liquefaction is most likely to occur. “Many researchers have said that liquefaction properties are not regionally dependent, so that if you know the geologic age or types of soils, then you know approximately how susceptible soils can be to liquefaction. So an important step for us is to validate that claim,” he explains. The ability to use groundwater depth has been one of the factors in predicting potential losses that has significantly reduced uncertainty within the RMS suite of earthquake models, concentrating the losses in smaller areas rather than spreading them over an entire region. This has clear implications for (re)insurers and policymakers, particularly as they seek to determine whether there are any “no-go” areas within cities. “There are two general types of liquefaction that are just so severe that no one should build on them,” says Ancheta. “One is lateral spreading where the extensional strains are just too much for buildings. In New Zealand, lateral spreading was observed at numerous locations along the Avon River, for instance.” California is altogether more challenging, he explains. “If you think about all the rivers that flow through Los Angeles or the San Francisco Bay Area, you can try and model them in the same way as we did with the Avon River in Christchurch. We discovered that not all rivers have a similar lateral spreading on either side of the riverbank. Where the river courses have been reworked with armored slopes or concrete linings — essentially reinforcement — it can actually mitigate liquefaction-related displacements.” The second type of severe liquefaction is called “flow slides” triggered by liquefaction, which is where the soil behaves almost like a landslide. This was the type of liquefaction that occurred in Central Sulawesi when the village of Balaroa was entirely destroyed by rivers of soil, claiming entire neighborhoods. “It’s a type of liquefaction that is extremely rare,” he adds. “but they can cause tens to hundreds of meters of displacement, which is why they are so devastating. But it’s much harder to predict the soils that are going to be susceptible to them as well as you can for other types of liquefaction surface expressions.” Ancheta is cognizant of the fact that a no-build zone in a major urban area is likely to be highly contentious from the perspective of homeowners, insurers and policymakers, but insists that now the understanding is there, it should be acted upon. “The Pandora’s box for us in the Canterbury Earthquake Sequence was the fact that the research told us where the lateral spreading would occur,” he says. “We have five earthquakes that produced lateral spreading so we knew with some certainty where the lateral spreading would occur and where it wouldn’t occur. With severe lateral spreading you just have to demolish the buildings affected because they have been extended so much.”
