
EXPOSURE
The Moody's insurance solutions magazine with a unique perspective and clear mission “... to provide insight and analysis to help insurance and risk professionals innovate, adapt, and deliver.”

Insurance: The next 10 years
Mohsen Rahnama, Cihan Biyikoglu and Moe Khosravy of RMS look to 2029, consider the…
Times Square, New York City
Tag: ISSUE 4

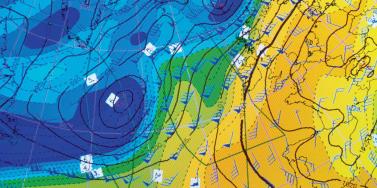
Assigning a Return Period to 2017
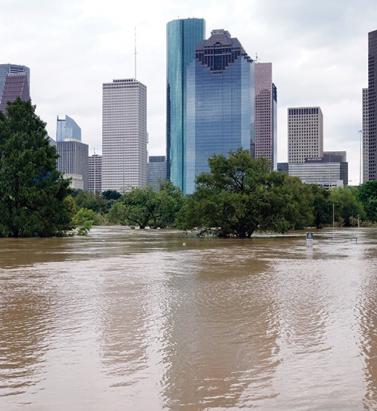
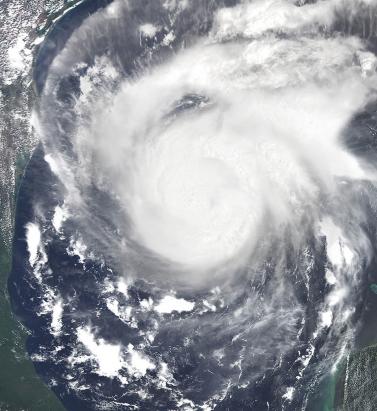
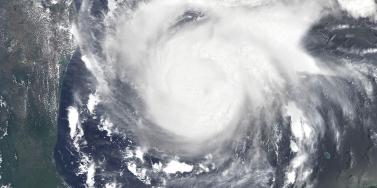
May 11, 2018Hurricanes Harvey, Irma and Maria (HIM) tore through the Caribbean and U.S. in 2017, resulting in insured losses over US$80 billion. Twelve years after Hurricanes Katrina, Rita and Wilma (KRW), EXPOSURE asks if the (re)insurance industry was better prepared for its next ‘terrible trio’ and what lessons can be learned In one sense, 2017 was a typical loss year for the insurance industry in that the majority of losses stemmed from the “peak zone” of U.S. hurricanes. However, not since the 2004-05 season had the U.S. witnessed so many landfalling hurricanes. It was the second most costly hurricane season on record for the (re)insurance industry, when losses in 2005 are adjusted for inflation. According to Aon Benfield, HIM caused total losses over US$220 billion and insured losses over US$80 billion — huge sums in the context of global catastrophe losses for the year of US$344 billion and insured losses of US$134 billion. Overall, weather-related catastrophe losses exceeded 0.4 percent of global GDP in 2017 (based on data from Aon Benfield, Munich Re and the World Bank), the second highest figure since 1990. In that period, only 2005 saw a higher relative catastrophe loss at around 0.5 percent of GDP. But, it seems, (re)insurers were much better prepared to absorb major losses this time around. Much has changed in the 12 years since Hurricane Katrina breached the levees in New Orleans. Catastrophe modeling as a profession has evolved into exposure management, models and underlying data have improved and there is a much greater appreciation of model uncertainty and assumptions, explains Alan Godfrey, head of exposure management at Asta. “Even post-2005 people would still see an event occurring, go to the models and pull out a single event ID … then tell all and sundry this is what we’re going to lose. And that’s an enormous misinterpretation of how the models are supposed to be used. In 2017, people demonstrated a much greater maturity and used the models to advise their own loss estimates, and not the other way around.” It also helped that the industry was extremely well-capitalized moving into 2017. After a decade of operating through a low interest rate and increasingly competitive environment, (re)insurers had taken a highly disciplined approach to capital management. Gone are the days where a major event sparked a series of run-offs. While some (re)insurers have reported higher losses than others, all have emerged intact. “In 2017 the industry has performed incredibly well from an operational point of view,” says Godfrey. “There have obviously been challenges from large losses and recovering capital, but those are almost outside of exposure management.” According to Aon Benfield, global reinsurance capacity grew by 80 percent between 1990 and 2017 (to US$605 billion), against global GDP growth of around 24 percent. The influx of capacity from the capital markets into U.S. property catastrophe reinsurance has also brought about change and innovation, offering new instruments such as catastrophe bonds for transferring extreme risks. Harvey broke all U.S. records for tropical cyclone-driven rainfall with observed cumulative rainfall of 51 inches Much of this growth in non-traditional capacity has been facilitated by better data and more sophisticated analytics, along with a healthy appetite for insurance risk from pension funds and other institutional investors. For insurance-linked securities (ILS), the 2017 North Atlantic hurricane season, Mexico’s earthquakes and California’s wildfires were their first big test. “Some thought that once we had a significant year that capital would leave the market,” says John Huff, president and chief executive of the Association of Bermuda Insurers and Reinsurance (ABIR). “And we didn’t see that. “In January 2018 we saw that capital being reloaded,” he continues. “There is abundant capital in all parts of the reinsurance market. Deploying that capital with a reasonable rate of return is, of course, the objective.” Huff thinks the industry performed extremely well in 2017 in spite of the severity of the losses and a few surprises. “I’ve even heard of reinsurers that were ready with claim payments on lower layers before the storm even hit. The modeling and ability to track the weather is getting more sophisticated. We saw some shifting of the storms — Irma was the best example — but reinsurers were tracking that in real time in order to be able to respond.” The Buffalo Bayou River floods a park in Houston after the arrival of Hurricane Harvey How Harvey Inundated Houston One lesson the industry has learned over three decades of modeling is that models are approximations of reality. Each event has its own unique characteristics, some of which fall outside of what is anticipated by the models. The widespread inland flooding that occurred after Hurricane Harvey made landfall on the Texas coastline is an important illustration of this, explains Huff. Even so, he adds, it continued a theme, with flood losses being a major driver of U.S. catastrophe claims for several years now. “What we’re seeing is flood events becoming the No. 1 natural disaster in the U.S. for people who never thought they were at risk of flood.” Harvey broke all U.S. records for tropical cyclone-driven rainfall with observed cumulative rainfall of 51 inches (129 centimeters). The extreme rainfall generated by Harvey and the unprecedented inland flooding across southeastern Texas and parts of southern Louisiana was unusual. However, nobody was overly surprised by the fact that losses from Harvey were largely driven by water versus wind. Prior events with significant storm surge-induced flooding, including Hurricane Katrina and 2012’s Superstorm Sandy, had helped to prepare (re)insurers, exposure managers and modelers for this eventuality. “The events themselves were very large but they were well within uncertainty ranges and not disproportionate to expectations,” says Godfrey. “Harvey is a new data point — and we don’t have that many — so the scientists will look at it and know that any new data point will lead to tweaks,” he continues. “If anything, it will make people spend a bit more time on their calibration for the non-modeled elements of hurricane losses, and some may conclude that big changes are needed to their own adjustments.” But, he adds: “Nobody is surprised by the fact that flooding post-hurricane causes loss. We know that now. It’s more a case of tweaking and calibrating, which we will be doing for the rest of our lives.” Flood Modeling Hurricane Harvey also underscored the importance of the investment in sophisticated, probabilistic flood models. RMS ran its U.S. Inland Flood HD Model in real time to estimate expected flood losses. “When Hurricane Harvey happened, we had already simulated losses of that magnitude in our flood model, even before the event occurred,” says Dr. Pete Dailey, vice president of product management and responsible for U.S. flood modeling at RMS. “The value of the model is to be able to anticipate extreme tail events well before they occur, so that insurance companies can be prepared in advance for the kind of risk they’re taking on and what potential claims volume they may have after a major event,” he adds. Does this mean that a US$100 billion-plus loss year like 2017 is now a 1-in-6-year event? Harvey has already offered a wealth of new data that will be fed into the flood model. The emergency shutdown of the Houston metropolitan area prevented RMS meteorologists and engineers from accessing the scene in the immediate aftermath, explains Dailey. However, once on the ground they gathered as much information as they could, observing and recording what had actually happened to affected properties. “We go to individual properties to assess the damage visually, record the latitude and longitude of the property, the street address, the construction, occupancy and the number of stories,” he says. “We will also make an estimate of the age of the property. Those basic parameters allow us to go back and take a look at what the model would have predicted in terms of damage and loss, as compared to what we observed.” The fact that insured losses emanating from the flooding were only a fraction of the total economic losses is an inevitable discussion point. The majority of claims paid were for commercial properties, with residential properties falling under the remit of the National Flood Insurance Program (NFIP). Many residential homes were uninsured, however, explains ABIR’s Huff. “The NFIP covers just the smallest amount of people — there are only five million policies — and yet you see a substantial event like Harvey which is largely uninsured because (re)insurance companies only cover commercial flood in the U.S.,” he says. “After Harvey you’ll see a realization that the private market is very well-equipped to get back into the private flood business, and there’s a national dialogue going on now.” Is 2017 the New Normal? One question being asked in the aftermath of the 2017 hurricane season is: What is the return period for a loss year like 2017? RMS estimates that, in terms of U.S. and Caribbean industry insured wind, storm surge and flood losses, the 2017 hurricane season corresponds to a return period between 15 and 30 years. However, losses on the scale of 2017 occur more frequently when considering global perils. Adjusted for inflation, it is seven years since the industry paid out a similar level of catastrophe claims — US$110 billion on the Tohoku earthquake and tsunami, Thai floods and New Zealand earthquake in 2011. Six years prior to that, KRW cost the industry in excess of US$75 billion (well over US$100 billion in today’s money). So, does this mean that a US$100 billion-plus (or equivalent in inflation-adjusted terms) loss year like 2017 is now a one-in-six-year event? As wealth and insurance penetration grows in developing parts of the world, will we begin to see more loss years like 2011, where catastrophe claims are not necessarily driven by the U.S. or Japan peak zones? “Increased insurance penetration does mean that on the whole losses will increase, but hopefully this is proportional to the premiums and capital that we are getting in,” says Asta’s Godfray. “The important thing is understanding correlations and how diversification actually works and making sure that is applied within business models. “In the past, people were able to get away with focusing on the world in a relatively binary fashion,” he continues. “The more people move toward diversified books of business, which is excellent for efficient use of capital, the more important it becomes to understand the correlations between different regions.” “You could imagine in the future, a (re)insurer making a mistake with a very sophisticated set of catastrophe and actuarial models,” he adds. “They may perfectly take into account all of the non-modeled elements but get the correlations between them all wrong, ending up with another year like 2011 where the losses across the globe are evenly split, affecting them far more than their models had predicted.” As macro trends including population growth, increasing wealth, climate change and urbanization influence likely losses from natural catastrophes, could this mean a shorter return period for years like last year, where industry losses exceeded US$134 billion? “When we look at the average value of properties along the U.S. coastline — the Gulf Coast and East Coast — there’s a noticeable trend of increasing value at risk,” says Dailey. “That is because people are building in places that are at risk of wind damage from hurricanes and coastal flooding. And these properties are of a higher value because they are more complex, have a larger square footage and have more stories. Which all leads to a higher total insured value. “The second trend that we see would be from climate change whereby the storms that produce damage along the coastline may be increasing in frequency and intensity,” he continues. “That’s a more difficult question to get a handle on but there’s a building consensus that while the frequency of hurricane landfalls may not necessarily be increasing, those that do make landfall are increasing in intensity.” Lloyd’s chief executive Inga Beale has stated her concerns about the impact of climate change, following the market’s £4.5 billion catastrophe claims bill for 2017. “That’s a significant number, more than double 2016; we’re seeing the impact of climate change to a certain extent, particularly on these weather losses, with the rising sea level that impacts and increases the amount of loss,” she said in an interview with Bloomberg. While a warming climate is expected to have significant implications for the level of losses arising from storms and other severe weather events, it is not yet clear exactly how this will manifest, according to Tom Sabbatelli, senior product manager at RMS. “We know the waters have risen several centimeters in the last couple of decades and we can use catastrophe models to quantify what sort of impact that has on coastal flooding, but it’s also unclear what that necessarily means for tropical cyclone strength. “The oceans may be warming, but there’s still an ongoing debate about how that translates into cyclone intensity, and that’s been going on for a long time,” he continues. “The reason for that is we just don’t know until we have the benefit of hindsight. We haven’t had a number of major hurricanes in the last few years, so does that mean that the current climate is quiet in the Atlantic? Is 2017 an anomaly or are we going back to more regular severe activity? It’s not until you’re ten or 20 years down the line and you look back that you know for sure.”
Bringing Clarity to Slab Claims
May 11, 2018How will a new collaboration between a major Texas insurer, RMS, Accenture and Texas Tech University provide the ability to determine with accuracy the source of slab claim loss? The litigation surrounding “slab claims” in the U.S. in the aftermath of a major hurricane has long been an issue within the insurance industry. When nothing is left of a coastal property but the concrete slab on which it was built, how do claims handlers determine whether the damage was predominantly caused by water or wind? The decision that many insurers take can spark protracted litigation, as was the case following Hurricane Ike, a powerful storm that caused widespread damage across the state after it made landfall over Galveston in September 2008. The storm had a very large footprint for a Category 2 hurricane, with sustained wind speeds of 110 mph and a 22-foot storm surge. Five years on, litigation surrounding how slab claim damage had been wrought rumbled on in the courts. Recognizing the extent of the issue, major coastal insurers knew they needed to improve their methodologies. It sparked a new collaboration between RMS, a major Texas insurer, Accenture and Texas Tech University (TTU). And from this year, the insurer will be able to utilize RMS data, hurricane modeling methodologies, and software analyses to track the likelihood of slab claims before a tropical cyclone makes landfall and document the post-landfall wind, storm surge and wave impacts over time. The approach will help determine the source of the property damage with greater accuracy and clarity, reducing the need for litigation post-loss, thus improving the overall claims experience for both the policyholder and insurer. To provide super accurate wind field data, RMS has signed a contract with TTU to expand a network of mobile meteorological stations that are ultimately positioned in areas predicted to experience landfall during a real-time event. “Our contract is focused on Texas, but they could also be deployed anywhere in the southern and eastern U.S.,” says Michael Young, senior director of product management at RMS. “The rapidly deployable weather stations collect peak and mean wind speed characteristics and transmit via the cell network the wind speeds for inclusion into our tropical cyclone data set. This is in addition to a wide range of other data sources, which this year includes 5,000 new data stations from our partner Earth Networks.” The storm surge component of this project utilizes the same hydrodynamic storm surge model methodologies embedded within the RMS North Atlantic Hurricane Models to develop an accurate view of the timing, extent and severity of storm surge and wave-driven hazards post-landfall. Similar to the wind field modeling process, this approach will also be informed by ground-truth terrain and observational data, such as high-resolution bathymetry data, tide and stream gauge sensors and high-water marks. “The whole purpose of our involvement in this project is to help the insurer get those insights into what’s causing the damage,” adds Jeff Waters, senior product manager at RMS. “The first eight hours of the time series at a particular location might involve mostly damaging surge, followed by eight hours of damaging wind and surge. So, we’ll know, for instance, that a lot of that damage that occurred in the first eight hours was probably caused by surge. It’s a very exciting and pretty unique project to be part of.”


Data Flow in a Digital Ecosystem
May 11, 2018There has been much industry focus on the value of digitization at the customer interface, but what is its role in risk management and portfolio optimization? In recent years, the perceived value of digitization to the insurance industry has been increasingly refined on many fronts. It now serves a clear function in areas such as policy administration, customer interaction, policy distribution and claims processing, delivering tangible, measurable benefits. However, the potential role of digitization in supporting the underwriting functions, enhancing the risk management process and facilitating portfolio optimization is sometimes less clear. That this is the case is perhaps a reflection of the fact that risk assessment is by its very nature a more nebulous task, isolated to only a few employees, and clarifying the direct benefits of digitization is therefore challenging. To grasp the potential of digitalization, we must first acknowledge the limitations of existing platforms and processes, and in particular the lack of joined-up data in a consistent format. But connecting data sets and being able to process analytics is just the start. There needs to be clarity in terms of the analytics an underwriter requires, including building or extending core business workflow to deliver insights at the point of impact. Data Limitation For Louise Day, director of operations at the International Underwriting Association (IUA), a major issue is that much of the data generated across the industry is held remotely from the underwriter. “You have data being keyed in at numerous points and from multiple parties in the underwriting process. However, rather than being stored in a format accessible to the underwriter, it is simply transferred to a repository where it becomes part of a huge data lake with limited ability to stream that data back out.” That data is entering the “lake” via multiple different systems and in different formats. These amorphous pools severely limit the potential to extract information in a defined, risk-specific manner, conduct impactful analytics and do so in a timeframe relevant to the underwriting decision-making process. “The underwriter is often disconnected from critical risk data,” believes Shaheen Razzaq, senior product director at RMS. “This creates significant challenges when trying to accurately represent coverage, generate or access meaningful analysis of metrics and grasp the marginal impacts of any underwriting decisions on overall portfolio performance. “Success lies not just in attempting to connect the different data sources together, but to do it in such a way that can generate the right insight within the right context and get this to the underwriter to make smarter decisions.” Without the digital capabilities to connect the various data sets and deliver information in a digestible format to the underwriter, their view of risk can be severely restricted — particularly given that server storage limits often mean their data access only extends as far as current information. Many businesses find themselves suffering from DRIP, being data rich but information poor, without the ability to transform their data into valuable insight. “You need to be able to understand risk in its fullest context,” Razzaq says. “What is the precise location of the risk? What policy history information do we have? How has the risk performed? How have the modeled numbers changed? What other data sources can I tap? What are the wider portfolio implications of binding it? How will it impact my concentration risk? How can I test different contract structures to ensure the client has adequate cover but is still profitable business for me? These are all questions they need answers to in real time at the decision-making point, but often that’s simply not possible.” When extrapolating this lack of data granularity up to the portfolio level and beyond, the potential implications of poor risk management at the point of underwriting can be extreme. With a high-resolution peril like U.S. flood, where two properties meters apart can have very different risk profiles, without granular data at the point of impact, the ability to make accurate risk decisions is restricted. Rolling up that degree of inaccuracy to the line of business and to the portfolio level, and the ramifications are significant. Looking beyond the organization and out to the wider flow of data through the underwriting ecosystem, the lack of format consistency is creating a major data blockage, according to Jamie Garratt, head of innovation at Talbot. “You are talking about trying to transfer data which is often not in any consistent format along a value chain that contains a huge number of different systems and counterparties,” he explains. “And the inability to quickly and inexpensively convert that data into a format that enables that flow, is prohibitive to progress. “You are looking at the formatting of policies, schedules and risk information, which is being passed through a number of counterparties all operating different systems. It then needs to integrate into pricing models, policy administration systems, exposure management systems, payment systems, et cetera. And when you consider this process replicated across a subscription market the inefficiencies are extensive.” A Functioning Ecosystem There are numerous examples of sectors that have transitioned successfully to a digitized data ecosystem that the insurance industry can learn from. One such industry is health care, which over the last decade has successfully adopted digital processes across the value chain and overcome the data formatting challenge. It can be argued that health care has a value chain similar to that in the insurance industry. Data is shared between various stakeholders — including competitors — to create the analytical backbone it needs to function effectively. Data is retained and shared at the individual level and combines multiple health perspectives to gain a holistic view of the patient. The sector has also overcome the data-consistency hurdle by collectively agreeing on a data standard, enabling the effective flow of information across all parties in the chain, from the health care facilities through to the services companies that support them. Garratt draws attention to the way the broader financial markets function. “There are numerous parallels that can be drawn between the financial and the insurance markets, and much that we can learn from how that industry has evolved over the last 10 to 20 years.” “As the capital markets become an increasingly prevalent part of the insurance sector,” he continues, “this will inevitably have a bearing on how we approach data and the need for greater digitization. If you look, for example, at the advances that have been made in how risk is transferred on the insurance-linked securities (ILS) front, what we now have is a fairly homogenous financial product where the potential for data exchange is more straightforward and transaction costs and speed have been greatly reduced. “It is true that pure reinsurance transactions are more complex given the nature of the market, but there are lessons that can be learned to improve transaction execution and the binding of risks.” For Razzaq, it’s also about rebalancing the data extrapolation versus data analysis equation. “By removing data silos and creating straight-through access to detailed, relevant, real-time data, you shift this equation on its axis. At present, some 70 to 80 percent of analysts’ time is spent sourcing data and converting it into a consistent format, with only 20 to 30 percent spent on the critical data analysis. An effective digital infrastructure can switch that equation around, greatly reducing the steps involved, and re-establishing analytics as the core function of the analytics team.” The Analytical Backbone So how does this concept of a functioning digital ecosystem map to the (re)insurance environment? The challenge, of course, is not only to create joined-up, real-time data processes at the organizational level, but also look at how that unified infrastructure can extend out to support improved data interaction at the industry level. An ideal digital scenario from a risk management perspective is where all parties operate on a single analytical framework or backbone built on the same rules, with the same data and using the same financial calculation engines, ensuring that on all risk fronts you are carrying out an ‘apples-to-apples’ comparison. That consistent approach would need to extend from the individual risk decision, to the portfolio, to the line of business, right up to the enterprise-wide level. At the underwriting trenches, it is about enhancing and improving the decision-making process and understanding the portfolio-level implications of those decisions. “A modern pricing and portfolio risk evaluation framework can reduce assessment times, providing direct access to relevant internal and external data in almost real time,” states Ben Canagaretna, managing director at Barbican Insurance Group. “Creating a data flow, designed specifically to support agile decision-making, allows underwriters to price complex business in a much shorter time period.” “It’s about creating a data flow designed specifically to support decision-making” Ben Canagaretna Barbican Insurance Group “The feedback loop around decisions surrounding overall reinsurance costs and investor capital exposure is paramount in order to maximize returns on capital for shareholders that are commensurate to risk appetite. At the heart of this is the portfolio marginal impact analysis – the ability to assess the impact of each risk on the overall portfolio in terms of exceedance probability curves, realistic disaster scenarios and regional exposures. Integrated historical loss information is a must in order to quickly assess the profitability of relevant brokers, trade groups and specific policies.” There is, of course, the risk of data overload in such an environment, with multiple information streams threatening to swamp the process if not channeled effectively. “It’s about giving the underwriter much better visibility of the risk,” says Garratt, “but to do that the information must be filtered precisely to ensure that the most relevant data is prioritized, so it can then inform underwriters about a specific risk or feed directly into pricing models.” Making the Transition There are no organizations in today’s (re)insurance market that cannot perceive at least a marginal benefit from integrating digital capabilities into their current underwriting processes. And for those that have started on the route, tangible benefits are already emerging. Yet making the transition, particularly given the clear scale of the challenge, is daunting. “You can’t simply unplug all of your legacy systems and reconnect a new digital infrastructure,” says IUA’s Day. “You have to find a way of integrating current processes into a data ecosystem in a manageable and controlled manner. From a data-gathering perspective, that process could start with adopting a standard electronic template to collect quote data and storing that data in a way that can be easily accessed and transferred.” “There are tangible short-term benefits of making the transition,” adds Razzaq. “Starting small and focusing on certain entities within the group. Only transferring certain use cases and not all at once. Taking a steady step approach rather than simply acknowledging the benefits but being overwhelmed by the potential scale of the challenge.” There is no doubting, however, that the task is significant, particularly integrating multiple data types into a single format. “We recognize that companies have source-data repositories and legacy systems, and the initial aim is not to ‘rip and replace’ those, but rather to create a path to a system that allows all of these data sets to move. For RMS, we have the ability to connect these various data hubs via open APIs to our Risk Intelligence platform to create that information superhighway, with an analytics layer that can turn this data into actionable insights.” Talbot has already ventured further down this path than many other organizations, and its pioneering spirit is already bearing fruit. “We have looked at those areas,” explains Garratt, “where we believe it is more likely we can secure short-term benefits that demonstrate the value of our longer-term strategy. For example, we recently conducted a proof of concept using quite powerful natural-language processing supported by machine-learning capabilities to extract and then analyze historic data in the marine space, and already we are generating some really valuable insights. “I don’t think the transition is reliant on having a clear idea of what the end state is going to look like, but rather taking those initial steps that start moving you in a particular direction. There also has to be an acceptance of the need to fail early and learn fast, which is hard to grasp in a risk-averse industry. Some initiatives will fail — you have to recognize that and be ready to pivot and move in a different direction if they do.”
In the Eye of the Storm
May 10, 2018Advances in data capture are helping to give (re)insurers an unparalleled insight into weather-related activity Weather-related data is now available on a much more localized level than ever before. Rapidly expanding weather station networks are capturing terabytes of data across multiple weather-related variables on an almost real-time basis, creating a “ground-truth” clarity multiple times sharper than that available only a few years ago. In fact, so hyperlocalized has this data become that it is now possible to capture weather information “down to a city street corner in some cases,” according to Earth Networks’ chief meteorologist Mark Hoekzema. “The greater the resolution of the data, the more accurate the damage verification” Mark Hoekzema earth networks This ground-level data is vital to the insurance industry given the potential for significant variations in sustained damage levels from one side of the street to the other during weather-related events, he adds. “Baseball-sized hail can fall on one side of the street while just a block over there might be only pea-sized hail and no damage. Tornados and lightning can decimate a neighborhood and leave a house untouched on the same street. The greater the resolution of the data, the more accurate the damage verification.” High-Resolution Perils This granularity of data is needed to fuel the high-resolution modeling capabilities that have become available over the last five to ten years. “With the continued increase in computational power,” Hoekzema explains, “the ability to run models at very high resolutions has become commonplace. Very high-resolution inputs are needed for these models to get the most out of the computations.” In July 2017, RMS teamed up with Earth Networks, capitalizing on its vast network of stations across North America and the Caribbean and reams of both current and historical data to feed into RMS HWind tropical cyclone wind field data products. “Through our linkup with Earth Networks, RMS has access to data from over 6,000 proprietary weather stations across the Americas and Caribbean, particularly across the U.S.,” explains Jeff Waters, senior product manager of model product management at RMS. “That means we can ingest data on multiple meteorological variables in almost real time: wind speed, wind direction and sea level pressure. “By integrating this ground-level data from Earth Networks into the HWind framework, we can generate a much more comprehensive, objective and accurate view of a tropical cyclone’s wind field as it progresses and evolves throughout the Atlantic Basin.” Another key advantage of the specific data the firm provides is that many of the stations are situated in highly built-up areas. “This helps us get a much more accurate depiction of wind speeds and hazards in areas where there are significant amounts of exposure,” Waters points out. According to Hoekzema, this data helps RMS gain a much more defined picture of how tropical cyclone events are evolving. “Earth Networks has thousands of unique observation points that are available to RMS for their proprietary analysis. The network provides unique locations along the U.S. coasts and across the Caribbean. These locations are live observation points, so data can be ingested at high temporal resolutions.” Across the Network Earth Networks operates the world’s largest weather network, with more than 12,000 neighborhood-level sensors installed at locations such as schools, businesses and government buildings. “Our stations are positioned on sturdy structures and able to withstand the worst weather a hurricane can deliver,” explains Hoekzema. Being positioned at such sites also means that the stations benefit from more reliable power sources and can capitalize on high-speed Internet connectivity to ensure the flow of data is maintained during extreme events. In September 2017, an Earth Networks weather station located at the Naples Airport in Florida was the source for one of the highest-recorded wind gusts from Hurricane Irma, registering 131 miles per hour. “The station operated through the entire storm,” he adds. “Through our linkup with Earth Networks … we can ingest data on multiple meteorological variables in almost real time” Jeff waters RMS This network of stations collates a colossal amount of data, with Earth Networks processing some 25 terabytes of data relating to over 25 weather variables on a daily basis, with information refreshed every few minutes. “The weather stations record many data elements,” he says, “including temperature, wind speed, wind gust, wind direction, humidity, dew point and many others. Because the stations are sending data in real time, Earth Networks stations also send very reliable rate information — or how the values are changing in real time. Real-time rate information provides valuable data on how a storm is developing and moving and what extreme changes could be happening on the ground.” Looking Further Ahead For RMS, such pinpoint data is not only helping ensure a continuous data feed during major tropical cyclone events but will also contribute to efforts to enhance the quality of insights delivered prior to landfall. “We’re currently working on the forecasting component of our HWind product suite,” says Waters. “Harnessing this hyperlocal data alongside weather forecast models will help us gain a more accurate picture of possible track and intensity scenarios leading up to landfall, and allow users to quantify the potential impacts to their book of business should some of these scenarios pan out.” RMS is also looking at the possibility of capitalizing on Earth Networks’ data for other perils, including flooding and wildfire, with the company set to release its North America Wildfire HD Models in the fall. For Earth Networks, the firm is capitalizing on new technologies to expand its data reach. “Weather data is being captured by autonomous vehicles such as self-driving cars and drones,” explains Hoekzema. “More and more sensors are going to be sampling areas of the globe and levels of the atmosphere that have never been measured,” he concludes. “As a broader variety of data is made available, AI-based models will be used to drive a broader array of decisions within weather-influenced industries.”


Brazil: Modeling the World's Future Breadbasket
May 10, 2018How a crop modeling collaboration with IRB Brasil Re could help bridge the protection gap and build a more resilient agricultural base for the future in Brazil Brazil is currently the world’s second largest corn exporter, and is set to overtake the U.S. as the globe’s biggest soybean exporter, with the U.S. Department of Agriculture (USDA) predicting a record Brazilian soybean crop of 115 million metric tons in its outlook for 2018. Yet this agricultural powerhouse — responsible for around a quarter of Brazil’s GDP — remains largely underinsured, according to Victor Roldán, vice president and head of Caribbean and Latin America at RMS. A situation that must be addressed given the importance of the sector for the country’s economy and growing weather extremes farmers must contend with under climate change conditions. The effects of climate change over the next 25 years could lead to further heavy crop losses “Natural perils are identified as the industry’s main risk,” he says. “Major droughts or excess of rain have been big drivers of losses for the sector, and their frequency and severity shall increase under future climate change conditions. During 2014 to 2017, El Niño affected Brazil with some of the largest droughts in some areas of the country and excess of rain in others. “There is a need to structure more effective and attractive insurance products to protect the farmers,” he continues. “For this we need better analytics, a better understanding of the perils, exposure and vulnerability.” Worst Drought in 80 Years The worst drought in 80 years reached its height in 2015, with farmers in Sao Paulo losing up to a third of their crops due to the dry weather. Production of soy shrank by 17 percent between 2013 and 2014 while around a fifth of the state’s citrus crops died. Meanwhile, heavy rain and flash floods in the south of the country also detrimentally impacted agricultural output. The effects of climate change over the next 25 years could lead to further heavy crop losses, according to a study carried out by Brazil’s Secretariat of Strategic Issues (SAE). It found that some of the country’s main crops could suffer a serious decline in the areas already under cultivation, anticipating a decline of up to 39 percent in the soybean crop. This could translate into significant financial losses, since the soybean crop currently brings in around US$20 billion in export earnings annually. IRB Brasil Re has been the leader in the agricultural reinsurance sector of the country for decades and has more than 70 years of agricultural claims data. Today agricultural risks represent its second-largest business line after property. However, insurance penetration remains low in the agricultural sector, and IRB has been seeking ways in which to encourage take-up among farmers. The 2015 drought was a turning point, explains Roldán. “As the largest reinsurance player in Brazil, IRB needed to address in a more systematic way the recorded 16.3 percent increase in claims. The increase was due to the drought in the Midwestern region, which adversely affected corn, soybean and coffee crops and, separately an increase in the historical average rainfall level in the Southern region, which caused damage to the crops.” Building a Probabilistic Crop Model A better crop-weather modeling approach and risk analytics of crop perils will help the market to better understand their risks and drive growth in crop insurance penetration. IRB is partnering with RMS to develop the first fully probabilistic hybrid crop model for the agricultural insurance sector in Brazil, which it is planning to roll out to its cedants. The model will assess crop risks linked with weather drivers, such as drought, excess rainfall, temperature variation, hail events, strong wind and other natural hazards that impact crop yield variability. The model will be suited for different crop insurance products such as named perils (hail, frost, etc.), Multiple-Peril Crop Insurance (MPCI) and revenue covers, and will also include livestock and forestry. “Major droughts or excess of rain have been big drivers of losses for the sector, but also climate change is a worrying trend” Victor Roldán RMS “Weather-driven impacts on crop production are complex perils to model given the natural variability in space and time, the localized nature of the hazards and the complex vulnerability response depending on the intensity, but also on the timing of occurrence,” explains Olivier Bode, manager, global agricultural risk at RMS. “For instance, plant vulnerability not only depends on the intensity of the stress but also on the timing of the occurrence, and the crop phenology or growth stage, which in turn depends on the planting date and the selected variety along with the local weather and soil conditions,” he continues. “Thus, exposure information is critical as you need to know which variety the farmer is selecting and its corresponding planting date to make sure you’re representing correctly the impacts that might occur during a growing season. The hybrid crop model developed by RMS for IRB has explicit modules that account for variety specific responses and dynamic representation of crop growth stages.” The model will rely on more than historical data. “That’s the major advantage of using a probabilistic crop-weather modeling approach,” says Bode. “Typically, insurers are looking at historical yield data to compute actuarial losses and they don’t go beyond that. A probabilistic framework allows insurers to go beyond the short historical yield record, adding value by coupling longer weather time series with crop models. They also allow you to capture future possible events that are not recorded in past weather data, for example, drought events that might span over several years, flood occurrences extending over larger or new areas as well as climate change related impacts. This allows you to calculate exceedance probability losses at different return periods for each crop and for specific scenarios.” There is also significant potential to roll out the model to other geographies in the future, with Colombia currently looking like the obvious next step and opportunity. “The El Niño weather phenomenon affects all of Latin America; it decreases rains by more than 60 percent during the rainy seasons in many countries,” explains Roldán. “Like Brazil, Colombia is a very biologically diverse country and features a variety of ecosystems. Currently, most of the country has under-utilized agricultural land.” Colombia is already a key player worldwide in two products: coffee and cut flowers. But the country signed a number of free trade agreements that will give its producers more access to foreign markets. “So, the expansion of agribusiness insurance is urgently needed in Colombia,” says Roldán.


Capturing the Resilience Dividend
May 10, 2018Incentivizing resilience efforts in vulnerable, low-income countries will require the ‘resilience dividend’ to be monetized and delivered upfront The role of the insurance industry and the wider risk management community is rapidly expanding beyond the scope of indemnifying risk. A growing recognition of shared responsibility is fostering a greater focus on helping reduce loss potential and support risk reduction, while simultaneously providing the post-event recovery funding that is part of the sector’s original remit. “There is now a concerted industrywide effort to better realize the resilience dividend,” believes Ben Brookes, managing director of capital and resilience solutions at RMS, “particularly in disaster-prone, low-income countries — creating that virtuous circle where resilience efforts are recognized in reduced premiums, with the resulting savings helping to fund further resilience efforts.” Acknowledging the Challenge In 2017, RMS conducted a study mapping the role of insurance in managing disaster losses in low- and low-middle-income countries on behalf of the U.K. Department for International Development (DFID). It found that the average annual economic loss across 77 countries directly attributable to natural disasters was US$29 billion. Further, simulations revealed a 10 percent probability that these countries could experience losses on the magnitude of US$47 billion in 2018, affecting 180 million people. Breaking these colossal figures down, RMS showed that of the potential US$47 billion hit, only 12 percent would likely be met by humanitarian aid with a further 5 percent covered by insurance. This leaves a bill of some US$39 billion to be picked up by some of the poorest countries in the world. The U.K. government has long recognized this challenge and to further the need in facilitating effective international collaboration across both public and private sectors to address a shortfall of this magnitude. In July 2017, U.K. Prime Minister Theresa May launched the Centre for Global Disaster Protection. The London-based institution brings together partners including DFID, the World Bank, civil society and the private sector to achieve a shared goal of strengthening the resilience capabilities of developing countries to natural disasters and the impacts of climate change. The Centre aims to provide neutral advice and develop innovative financial tools, incorporating insurance-specific instruments, that will enable better pre-disaster planning and increase the financial resilience of vulnerable regions to natural disasters. Addressing the International Insurance Society shortly after the launch, Lord Bates, the U.K. Government Minister of State for International Development, said that the aim of the Centre was to combine data, research and science to “analyze risk and design systems that work well for the poorest people” and involve those vulnerable people in the dialogue that helps create them. “It is about innovation,” he added, “looking at new ways of working and building new collaborations across the finance and humanitarian communities, to design financial instruments that work for developing countries.” A Lack of Incentive There are, however, multiple barriers to creating an environment in which a resilient infrastructure can be developed. “Resilience comes at a cost,” says Irena Sekulska, engagement manager at Vivid Economics, “and delivers long-term benefits that are difficult to quantify. This makes the development of any form of resilient infrastructure extremely challenging, particularly in developing countries where natural disasters hit disproportionally harder as a percentage of GDP.” The potential scale of the undertaking is considerable, especially when one considers that the direct economic impact of a natural catastrophe in a vulnerable, low-income country can be multiples of its GDP. This was strikingly demonstrated by the economic losses dealt out by Hurricanes Irma and Harvey across the Caribbean and the 2010 Haiti Earthquake, a one-in-ten-year loss that wiped out 120 percent of the country’s GDP. Funding is, of course, a major issue, due to the lack of fiscal capacity in many of these regions. In addition, other existing projects may be deemed more urgent or deserving of funding measures to support disaster preparedness or mitigate potential impacts. Limited on-the-ground institutional and technical capacity to deliver on resilience objectives is also a hindering factor, while the lack of a functioning insurance sector in many territories is a further stumbling block. “Another issue you often face,” explains Charlotte Acton, director of capital and resilience solutions at RMS, “is the misalignment between political cycles and the long-term benefits of investment in resilience. The reason is that the benefits of that investment are only demonstrated during a disaster, which might only occur once every 10, 20 or even 100 years — or longer.” Another problem is that the success of any resilience strategy is largely unobservable. A storm surge hits, but the communities in its path are not flooded. The winds tear through a built-up area, but the buildings stand firm. “The challenge is that by attempting to capture resilience success you are effectively trying to predict, monitor and monetize an avoided loss,” explains Shalini Vajjhala, founder and CEO of re:focus, “and that is a very challenging thing to do.” A Tangible Benefit “The question,” states Acton, “is whether we can find a way to monetize some of the future benefit from building a more resilient infrastructure and realize it upfront, so that it can actually be used in part to finance the resilience project itself. “In theory, if you are insuring a school against hurricane-related damage, then your premiums should be lower if you have built in a more resilient manner. Catastrophe models are able to quantify these savings in expected future losses, and this can be used to inform pricing. But is there a way we can bring that premium saving forward, so it can support the funding of the resilient infrastructure that will create it?” It is also about making the resilience dividend tangible, converting it into a return that potential investors or funding bodies can grasp. “The resilience dividend looks a lot like energy efficiency,” explains Vajjhala, “where you make a change that creates a saving rather than requires a payment. The key is to find a way to define and capture that saving in a way where the value is clear and trusted. Then the resilience dividend becomes a meaningful financial concept — otherwise it’s too abstract.” The dividend must also be viewed in its broadest context, demonstrating its value not only at a financial level in the context of physical assets, but in a much wider societal context, believes Sekulska. “Viewing the resilience dividend through a narrow, physical-damage-focused lens misses the full picture. There are multiple benefits beyond this that must be recognized and monetized. The ability to stimulate innovation and drive growth; the economic boost through job creation to build the resilient infrastructure; the social and environmental benefits of more resilient communities. It is about the broader service the resilient infrastructure provides rather than simply the physical assets themselves.” Work is being done to link traditional modeled physical asset damage to broader macroeconomic effects, which will go some way to starting to tackle this issue. Future innovation may allow the resilience dividend to be harnessed in other creative ways, including the potential increase in land values arising from reduced risk exposure. The Innovation Lab It is in this context that the Centre for Global Disaster Protection, in partnership with Lloyd’s of London, launched the Innovation Lab. The first lab of its kind run by the Centre, held on January 31, 2018, provided an open forum to stimulate cross-specialty dialogue and catalyze innovative ideas on how financial instruments could incentivize the development of resilient infrastructure and encourage building back better after disasters. Co-sponsored by Lloyd’s and facilitated by re:focus, RMS and Vivid Economics, the Lab provided an environment in which experts from across the humanitarian, financial and insurance spectrum could come together to promote new thinking and stimulate innovation around this long-standing issue. “The ideas that emerged from the Lab combined multiple different instruments,” explains Sekulska, “because we realized that no single financial mechanism could effectively monetize the resilience dividend and bring it far enough upfront to sufficiently stimulate resilience efforts. Each potential solution also combined a funding component and a risk transfer component.” “The solutions generated by the participants ranged from the incremental to the radical,” adds Vajjhala. “They included interventions that could be undertaken relatively quickly to capture the resilience dividend and those that would require major structural changes and significant government intervention to set up the required entities or institutions to manage the proposed projects.” Trevor Maynard, head of innovation at Lloyd’s, concluded that the use of models was invaluable in exploring the value of resilience compared to the cost of disasters, adding “Lloyd’s is committed to reducing the insurance gap and we hope that risk transfer will become embedded in the development process going forward so that communities and their hard work on development can be protected against disasters.” Monetizing the Resilience Dividend: Proposed Solutions “Each proposed solution, to a greater or lesser extent, meets the requirements of the resilience brief,” says Acton. “They each encourage the development of resilient infrastructure, serve to monetize a portion of the resilience dividend, deliver the resilience dividend upfront and involve some form of risk transfer.” Yet, they each have limitations that must be addressed collectively. For example, initial model analysis by RMS suggests that the potential payback period for a RESCO-based solution could be 10 years or longer. Is this beyond an acceptable period for investors? Could the development impact bond be scaled-up sufficiently to tackle the financial scope of the challenge? Given the donor support requirement of the insurance-linked loan package, is this a viable long-term solution? Would the complex incentive structure and multiple stakeholders required by a resilience bond scuttle its development? Will insurance pricing fully recognize the investments in resilience that have been made, an assumption underlying each of these ideas? RMS, Vivid Economics and re:focus are working together with Lloyd’s and the Centre to further develop these ideas, adding more analytics to assess the cost-benefit of those considered to be the most viable in the near term, ahead of publication of a final report in June. “The purpose of the Lab,” explains Vajjhala, “is not to agree upon a single solution, but rather to put forward workable solutions to those individuals and institutions that took part in the dialogue and who will ultimately be responsible for its implementation should they choose to move the idea forward.” And as Sekulska makes clear, evolving these embryonic ideas into full-fledged, effective financial instruments will take significant effort and collective will on multiple fronts. “There will need to be concerted effort across the board to convert these innovative ideas into working solutions. This will require pricing it fully, having someone pioneer it and take it forward, putting together a consortium of stakeholders to implement it.”


Getting Wildfire Under Control
May 10, 2018The extreme conditions of 2017 demonstrated the need for much greater data resolution on wildfire in North America The 2017 California wildfire season was record-breaking on virtually every front. Some 1.25 million acres were torched by over 9,000 wildfire events during the period, with October to December seeing some of the most devastating fires ever recorded in the region*. From an insurance perspective, according to the California Department of Insurance, as of January 31, 2018, insurers had received almost 45,000 claims relating to losses in the region of US$11.8 billion. These losses included damage or total loss to over 30,000 homes and 4,300 businesses. On a countrywide level, the total was over 66,000 wildfires that burned some 9.8 million acres across North America, according to the National Interagency Fire Center. This compares to 2016 when there were 65,575 wildfires and 5.4 million acres burned. Caught off Guard “2017 took us by surprise,” says Tania Schoennagel, research scientist at the University of Colorado, Boulder. “Unlike conditions now [March 2018], 2017 winter and early spring were moist with decent snowpack and no significant drought recorded.” Yet despite seemingly benign conditions, it rapidly became the third-largest wildfire year since 1960, she explains. “This was primarily due to rapid warming and drying in the late spring and summer of 2017, with parts of the West witnessing some of the driest and warmest periods on record during the summer and remarkably into the late fall. “Additionally, moist conditions in early spring promoted build-up of fine fuels which burn more easily when hot and dry,” continues Schoennagel. “This combination rapidly set up conditions conducive to burning that continued longer than usual, making for a big fire year.” While Southern California has experienced major wildfire activity in recent years, until 2017 Northern California had only experienced “minor-to-moderate” events, according to Mark Bove, research meteorologist, risk accumulation, Munich Reinsurance America, Inc. “In fact, the region had not seen a major, damaging fire outbreak since the Oakland Hills firestorm in 1991, a US$1.7 billion loss at the time,” he explains. “Since then, large damaging fires have repeatedly scorched parts of Southern California, and as a result much of the industry has focused on wildfire risk in that region due to the higher frequency and due to the severity of recent events. “Although the frequency of large, damaging fires may be lower in Northern California than in the southern half of the state,” he adds, “the Wine Country fires vividly illustrated not only that extreme loss events are possible in both locales, but that loss magnitudes can be larger in Northern California. A US$11 billion wildfire loss in Napa and Sonoma counties may not have been on the radar screen for the insurance industry prior to 2017, but such losses are now.” Smoke on the Horizon Looking ahead, it seems increasingly likely that such events will grow in severity and frequency as climate-related conditions create drier, more fire-conducive environments in North America. “Since 1985, more than 50 percent of the increase in the area burned by wildfire in the forests of the Western U.S. has been attributed to anthropogenic climate change,” states Schoennagel. “Further warming is expected, in the range of 2 to 4 degrees Fahrenheit in the next few decades, which will spark ever more wildfires, perhaps beyond the ability of many Western communities to cope.” “Climate change is causing California and the American Southwest to be warmer and drier, leading to an expansion of the fire season in the region,” says Bove. “In addition, warmer temperatures increase the rate of evapotranspiration in plants and evaporation of soil moisture. This means that drought conditions return to California faster today than in the past, increasing the fire risk.” “Even though there is data on thousands of historical fires … it is of insufficient quantity and resolution to reliably determine the frequency of fires” Mark Bove Munich Reinsurance America While he believes there is still a degree of uncertainty as to whether the frequency and severity of wildfires in North America has actually changed over the past few decades, there is no doubt that exposure levels are increasing and will continue to do so. “The risk of a wildfire impacting a densely populated area has increased dramatically,” states Bove. “Most of the increase in wildfire risk comes from socioeconomic factors, like the continued development of residential communities along the wildland-urban interface and the increasing value and quantity of both real estate and personal property.” Breaches in the Data Yet while the threat of wildfire is increasing, the ability to accurately quantify that increased exposure potential is limited by a lack of granular historical data, both on a countrywide basis and even in highly exposed fire regions such as California, to accurately determine the probability of an event occurring. “Even though there is data on thousands of historical fires over the past half-century,” says Bove, “it is of insufficient quantity and resolution to reliably determine the frequency of fires at all locations across the U.S. “This is particularly true in states and regions where wildfires are less common, but still holds true in high-risk states like California,” he continues. “This lack of data, as well as the fact that the wildfire risk can be dramatically different on the opposite ends of a city, postcode or even a single street, makes it difficult to determine risk-adequate rates.” According to Max Moritz, Cooperative Extension specialist in fire at the University of California, current approaches to fire mapping and modeling are also based too much on fire-specific data. “A lot of the risk data we have comes from a bottom-up view of the fire risk itself. Methodologies are usually based on the Rothermel Fire Spread equation, which looks at spread rates, flame length, heat release, et cetera. But often we’re ignoring critical data such as wind patterns, ignition loads, vulnerability characteristics, spatial relationships, as well as longer-term climate patterns, the length of the fire season and the emergence of fire-weather corridors.” Ground-level data is also lacking, he believes. “Without very localized data you’re not factoring in things like the unique landscape characteristics of particular areas that can make them less prone to fire risk even in high-risk areas.” Further, data on mitigation measures at the individual community and property level is in short supply. “Currently, (re)insurers commonly receive data around the construction, occupancy and age of a given risk,” explains Bove, “information that is critical for the assessment of a wind or earthquake risk.” However, the information needed to properly assess wildfire risk is typically not captured. For example, whether roof covering or siding is combustible. Bove says it is important to know if soffits and vents are open-air or protected by a metal covering, for instance. “Information about a home’s upkeep and surrounding environment is critical as well,” he adds. At Ground Level While wildfire may not be as data intensive as a peril such as flood, it is almost as demanding, especially on computational capacity. It requires simulating stochastic or scenario events all the way from ignition through to spread, creating realistic footprints that can capture what the risk is and the physical mechanisms that contribute to its spread into populated environments. The RMS®North America Wildfire HD Model capitalize on this expanded computational capacity and improved data sets to bring probabilistic capabilities to bear on the peril for the first time across the entirety of the contiguous U.S. and Canada. Using a high-resolution simulation grid, the model provides a clear understanding of factors such as the vegetation levels, the density of buildings, the vulnerability of individual structures and the extent of defensible space. The model also utilizes weather data based on re-analysis of historical weather observations to create a distribution of conditions from which to simulate stochastic years. That means that for a given location, the model can generate a weather time series that includes wind speed and direction, temperature, moisture levels, et cetera. As wildfire risk is set to increase in frequency and severity due to a number of factors ranging from climate change to expansions of the wildland-urban interface caused by urban development in fire-prone areas, the industry now has to be able to live with that and understand how it alters the risk landscape. On the Wind Embers have long been recognized as a key factor in fire spread, either advancing the main burn or igniting spot fires some distance from the originating source. Yet despite this, current wildfire models do not effectively factor in ember travel, according to Max Moritz, from the University of California. “Post-fire studies show that the vast majority of buildings in the U.S. burn from the inside out due to embers entering the property through exposed vents and other entry points,” he says. “However, most of the fire spread models available today struggle to precisely recreate the fire parameters and are ineffective at modeling ember travel.” During the Tubbs Fire, the most destructive wildfire event in California’s history, embers carried on extreme ‘Diablo’ winds sparked ignitions up to two kilometers from the flame front. The rapid transport of embers not only created a more fast-moving fire, with Tubbs covering some 30 to 40 kilometers within hours of initial ignition, but also sparked devastating ignitions in areas believed to be at zero risk of fire, such as Coffey Park, Santa Rosa. This highly built-up area experienced an urban conflagration due to ember-fueled ignitions. “Embers can fly long distances and ignite fires far away from its source,” explains Markus Steuer, consultant, corporate underwriting at Munich Re. “In the case of the Tubbs Fire they jumped over a freeway and ignited the fire in Coffey Park, where more than 1,000 homes were destroyed. This spot fire was not connected to the main fire. In risk models or hazard maps this has to be considered. Firebrands can fly over natural or man-made fire breaks and damage can occur at some distance away from the densely vegetated areas.” For the first time, the RMS North America Wildfire HD Model enables the explicit simulation of ember transport and accumulation, allowing users to detail the impact of embers beyond the fire perimeters. The simulation capabilities extend beyond the traditional fuel-based fire simulations, and enable users to capture the extent to which large accumulations of firebrands and embers can be lofted beyond the perimeters of the fire itself and spark ignitions in dense residential and commercial areas. As was shown in the Tubbs Fire, areas not previously considered at threat of wildfire were exposed by the ember transport. The introduction of ember simulation capability allows the industry to quantify the complete wildfire risk appropriately across North America wildfire portfolios.
