
EXPOSURE
The Moody's insurance solutions magazine with a unique perspective and clear mission “... to provide insight and analysis to help insurance and risk professionals innovate, adapt, and deliver.”

Insurance: The next 10 years
Mohsen Rahnama, Cihan Biyikoglu and Moe Khosravy of RMS look to 2029, consider the…
Times Square, New York City
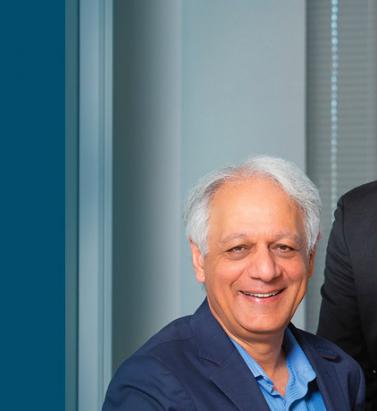
Tag: Mohsen Rahnama


Insurance: The next 10 years
September 06, 2019Mohsen Rahnama, Cihan Biyikoglu and Moe Khosravy of RMS look to 2029, consider the changes the (re)insurance industry will have undergone and explain why all roads lead to a platform Over the last 30 years, catastrophe models have become an integral part of the insurance industry for portfolio risk management. During this time, the RMS model suite has evolved and expanded from the initial IRAS model — which covered California earthquake — to a comprehensive and diverse set of models covering over 100 peril-country combinations all over the world. RMS Risk Intelligence™, an open and flexible platform, was recently launched, and it was built to enable better risk management and support profitable risk selection. Since the earliest versions of catastrophe models, significant advances have been made in both technology and computing power. These advances allow for a more comprehensive application of new science in risk modeling and make it possible for modelers to address key sources of model and loss uncertainty in a more systematic way. These and other significant changes over the last decade are shaping the future of insurance. By 2029, the industry will be fully digitized, presenting even more opportunity for disruption in an era of technological advances. In what is likely to remain a highly competitive environment, market participants will need to differentiate based on the power of computing speed and the ability to mine and extract value from data to inform quick, risk-based decisions. Laying the Foundations So how did we get here? Over the past few decades we have witnessed several major natural catastrophes including Hurricanes Andrew, Katrina and Sandy; the Northridge, Kobe, Maule, Tōhoku and Christchurch Earthquakes; and costly hurricanes and California wildfires in 2017 and 2018. Further, human-made catastrophes have included the terrorist attacks of 9/11 and major cyberattacks, such as WannaCry and NotPetya. Each of these events has changed the landscape of risk assessment, underwriting and portfolio management. Combining the lessons learned from past events, including billions of dollars of loss data, with new technology has enhanced the risk modeling methodology, resulting in more robust models and a more effective way to quantify risk across diverse regions and perils. The sophistication of catastrophe models has increased as technology has enabled a better understanding of root causes and behavior of events, and it has improved analysis of their impact. Technology has also equipped the industry with more sophisticated tools to harness larger datasets and run more computationally intensive analytics. These new models are designed to translate finer-grained data into deeper and more detailed insights. Consequently, we are creating better models while also ensuring model users can make better use of model results through more sophisticated tools and applications. A Collaborative Approach In the last decade, the pace at which technology has advanced is compelling. Emerging technology has caused the insurance industry to question if it is responding quickly and effectively to take advantage of new opportunities. In today’s digital world, many segments of the industry are leveraging the power and capacity enabled by Cloud-computing environments to conduct intensive data analysis using robust analytics. Technology has also equipped the industry with more sophisticated tools to harness larger datasets Such an approach empowers the industry by allowing information to be accessed quickly, whenever it is needed, to make effective, fully informed decisions. The development of a standardized, open platform creates smooth workflows and allows for rapid advancement, information sharing and collaboration in growing common applications. The future of communication between various parties across the insurance value chain — insurers, brokers, reinsurers, supervisors and capital markets — will be vastly different from what it is today. By 2029, we anticipate the transfer of data, use of analytics and other collaborations will be taking place across a common platform. The benefits will include increased efficiency, more accurate data collection and improvements in underwriting workflow. A collaborative platform will also enable more robust and informed risk assessments, portfolio rollout processes and risk transfers. Further, as data is exchanged it will be enriched and augmented using new machine learning and AI techniques. An Elastic Platform We continue to see technology evolve at a very rapid pace. Infrastructure continues to improve as the cost of storage declines and computational speed increases. Across the board, the incremental cost of computing technology has come down. Software tools have evolved accordingly, with modern big data systems now capable of handling hundreds if not thousands of terabytes of data. Improved programming frameworks allow for more seamless parallel programming. User-interface components reveal data in ways that were not possible in the past. Furthermore, this collection of phenomenal advances is now available in the Cloud, with the added benefit that it is continuously self-improving to support growing commercial demands. In addition to helping avoid built-in obsolescence, the Cloud offers “elasticity.” Elasticity means accessing many machines when you need them and fewer when you don’t. It means storage that can dynamically grow and shrink, and computing capacity that can follow the ebb and flow of demand. In our world of insurance and data analytics, the macro cycles of renewal seasons and micromodeling demand bursts can both be accommodated through the elastic nature of the Cloud. In an elastic world, the actual cost of supercomputing goes down, and we can confidently guarantee fast response times. Empowering Underwriters A decade from now, the industry will look very different, not least due to changes within the workforce and the risk landscape. First-movers and fast-followers will be in a position of competitive advantage come 2029 in an industry where large incumbents are already partnering with more agile “insurtech” startups. The role of the intermediary will continue to evolve, and at every stage of risk transfer — from insured to primary insurer, reinsurer and into the capital markets — data sharing and standardization will become key success factors. Over the next 10 years, as data becomes more standardized and more widely shared, the concept of blockchain, or distributed ledger technology, will move closer to becoming a reality. This standardization, collaboration and use of advanced analytics are essential to the future of the industry. Machine learning and AI, highly sophisticated models and enhanced computational power will enable underwriters to improve their risk selection and make quick, highly informed decisions. And this ability will enhance the role of the insurance industry in society, in a changing and altogether riskier world. The tremendous protection gap can only be tackled when there is more detailed insight and differentiation around each individual risk. When there is greater insight into the underlying risk, there is less need for conservatism, risks become more accurately and competitively priced, and (re)insurers are able to innovate to provide products and solutions for new and emerging exposures. Over the coming decade, models will require advanced computing technology to fully harness the power of big data. Underwater robots are now probing previously unmapped ocean waters to detect changes in temperatures, currents, sea level and coastal flooding. Drones are surveying our built-up environment in fine detail. Artificial intelligence and machine learning algorithms are searching for patterns of climate change in these new datasets, and climate models are reconstructing the past and predicting the future at a resolution never before possible. These emerging technologies and datasets will help meet our industry’s insatiable demand for more robust risk assessment at the level of an individual asset. This explosion of data will fundamentally change the way we think about model execution and development, as well as the end-to-end software infrastructure. Platforms will need to be dynamic and forward-looking verses static and historic in the way they acquire, train, and execute on data. The industry has already transformed considerably over the past five years, despite traditionally being considered a laggard in terms of its technology adoption. The foundation is firmly in place for a further shift over the next decade where all roads are leading to a common, collaborative industry platform, where participants are willing to share data and insights and, as they do so, open up new markets and opportunities. RMS Risk Intelligence The analytical and computational power of the Risk Intelligence (RI) platform enables the RMS model development team to bring the latest science and research to the RMS catastrophe peril model suite and build the next generation of high-definition models. The functionality and high performance of RI allows the RMS team to assess elements of model and loss uncertainty in a more robust way than before. The framework of RI is flexible, modular and scalable, allowing the rapid integration of future knowledge with a swifter implementation and update cycle. The open modeling platform allows model users to extract more value from their claims experience to develop vulnerability functions that represent a view of risk specific to their data or to use custom-built alternatives. This enables users to perform a wide range of sensitivity tests and take ownership of their view of risk. Mohsen Rahnama is chief risk modeling officer and executive vice president, models and data, Cihan Biyikoglu is executive vice president, product and Moe Khosravy is executive vice president, software and platform at RMS
Living in a World of Constant Catastrophes
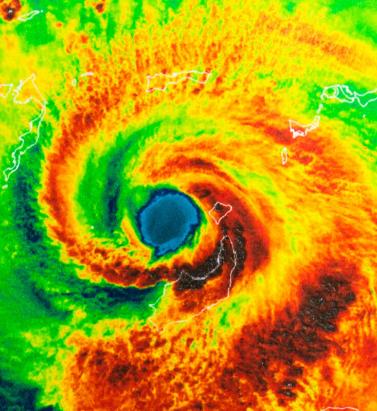
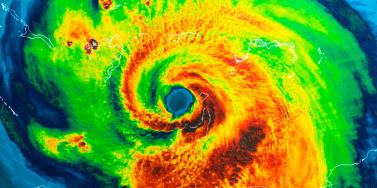
May 20, 2019(Re)insurance companies are waking up to the reality that we are in a riskier world and the prospect of ‘constant catastrophes’ has arrived, with climate change a significant driver In his hotly anticipated annual letter to shareholders in February 2019, Warren Buffett, the CEO of Berkshire Hathaway and acclaimed “Oracle of Omaha,” warned about the prospect of “The Big One” — a major hurricane, earthquake or cyberattack that he predicted would “dwarf Hurricanes Katrina and Michael.” He warned that “when such a mega-catastrophe strikes, we will get our share of the losses and they will be big — very big.” The use of new technology, data and analytics will help us prepare for unpredicted ‘black swan’ events and minimize the catastrophic losses Mohsen Rahnama RMS The question insurance and reinsurance companies need to ask themselves is whether they are prepared for the potential of an intense U.S. landfalling hurricane, a Tōhoku-size earthquake event and a major cyber incident if these types of combined losses hit their portfolio each and every year, says Mohsen Rahnama, chief risk modeling officer at RMS. “We are living in a world of constant catastrophes,” he says. “The risk is changing, and carriers need to make an educated decision about managing the risk. “So how are (re)insurers going to respond to that? The broader perspective should be on managing and diversifying the risk in order to balance your portfolio and survive major claims each year,” he continues. “Technology, data and models can help balance a complex global portfolio across all perils while also finding the areas of opportunity.” A Barrage of Weather Extremes How often, for instance, should insurers and reinsurers expect an extreme weather loss year like 2017 or 2018? The combined insurance losses from natural disasters in 2017 and 2018 according to Swiss Re sigma were US$219 billion, which is the highest-ever total over a two-year period. Hurricanes Harvey, Irma and Maria delivered the costliest hurricane loss for one hurricane season in 2017. Contributing to the total annual insurance loss in 2018 was a combination of natural hazard extremes, including Hurricanes Michael and Florence, Typhoons Jebi, Trami and Mangkhut, as well as heatwaves, droughts, wildfires, floods and convective storms. While it is no surprise that weather extremes like hurricanes and floods occur every year, (re)insurers must remain diligent about how such risks are changing with respect to their unique portfolios. Looking at the trend in U.S. insured losses from 1980–2018, the data clearly shows losses are increasing every year, with climate-related losses being the primary drivers of loss, especially in the last four decades (even allowing for the fact that the completeness of the loss data over the years has improved). Measuring Climate Change With many non-life insurers and reinsurers feeling bombarded by the aggregate losses hitting their portfolios each year, insurance and reinsurance companies have started looking more closely at the impact that climate change is having on their books of business, as the costs associated with weather-related disasters increase. The ability to quantify the impact of climate change risk has improved considerably, both at a macro level and through attribution research, which considers the impact of climate change on the likelihood of individual events. The application of this research will help (re)insurers reserve appropriately and gain more insight as they build diversified books of business. Take Hurricane Harvey as an example. Two independent attribution studies agree that the anthropogenic warming of Earth’s atmosphere made a substantial difference to the storm’s record-breaking rainfall, which inundated Houston, Texas, in August 2017, leading to unprecedented flooding. In a warmer climate, such storms may hold more water volume and move more slowly, both of which lead to heavier rainfall accumulations over land. Attribution studies can also be used to predict the impact of climate change on the return-period of such an event, explains Pete Dailey, vice president of model development at RMS. “You can look at a catastrophic event, like Hurricane Harvey, and estimate its likelihood of recurring from either a hazard or loss point of view. For example, we might estimate that an event like Harvey would recur on average say once every 250 years, but in today’s climate, given the influence of climate change on tropical precipitation and slower moving storms, its likelihood has increased to say a 1-in-100-year event,” he explains. We can observe an incremental rise in sea level annually — it’s something that is happening right in front of our eyes Pete Dailey RMS “This would mean the annual probability of a storm like Harvey recurring has increased more than twofold from 0.4 percent to 1 percent, which to an insurer can have a dramatic effect on their risk management strategy.” Climate change studies can help carriers understand its impact on the frequency and severity of various perils and throw light on correlations between perils and/or regions, explains Dailey. “For a global (re)insurance company with a book of business spanning diverse perils and regions, they want to get a handle on the overall effect of climate change, but they must also pay close attention to the potential impact on correlated events. “For instance, consider the well-known correlation between the hurricane season in the North Atlantic and North Pacific,” he continues. “Active Atlantic seasons are associated with quieter Pacific seasons and vice versa. So, as climate change affects an individual peril, is it also having an impact on activity levels for another peril? Maybe in the same direction or in the opposite direction?” Understanding these “teleconnections” is just as important to an insurer as the more direct relationship of climate to hurricane activity in general, thinks Dailey. “Even though it’s hard to attribute the impact of climate change to a particular location, if we look at the impact on a large book of business, that’s actually easier to do in a scientifically credible way,” he adds. “We can quantify that and put uncertainty around that quantification, thus allowing our clients to develop a robust and objective view of those factors as a part of a holistic risk management approach.” Of course, the influence of climate change is easier to understand and measure for some perils than others. “For example, we can observe an incremental rise in sea level annually — it’s something that is happening right in front of our eyes,” says Dailey. “So, sea-level rise is very tangible in that we can observe the change year over year. And we can also quantify how the rise of sea levels is accelerating over time and then combine that with our hurricane model, measuring the impact of sea-level rise on the risk of coastal storm surge, for instance.” Each peril has a unique risk signature with respect to climate change, explains Dailey. “When it comes to a peril like severe convective storms — tornadoes and hail storms for instance — they are so localized that it’s difficult to attribute climate change to the future likelihood of such an event. But for wildfire risk, there’s high correlation with climate change because the fuel for wildfires is dry vegetation, which in turn is highly influenced by the precipitation cycle.” Satellite data from 1993 through to the present shows there is an upward trend in the rate of sea-level rise, for instance, with the current rate of change averaging about 3.2 millimeters per year. Sea-level rise, combined with increasing exposures at risk near the coastline, means that storm surge losses are likely to increase as sea levels rise more quickly. “In 2010, we estimated the amount of exposure within 1 meter above the sea level, which was US$1 trillion, including power plants, ports, airports and so forth,” says Rahnama. “Ten years later, the exact same exposure was US$2 trillion. This dramatic exposure change reflects the fact that every centimeter of sea-level rise is subjected to a US$2 billion loss due to coastal flooding and storm surge as a result of even small hurricanes. “And it’s not only the climate that is changing,” he adds. “It’s the fact that so much building is taking place along the high-risk coastline. As a result of that, we have created a built-up environment that is actually exposed to much of the risk.” Rahnama highlighted that because of an increase in the frequency and severity of events, it is essential to implement prevention measures by promoting mitigation credits to minimize the risk. He says: “How can the market respond to the significant losses year after year. It is essential to think holistically to manage and transfer the risk to the insurance chain from primary to reinsurance, capital market, ILS, etc.,” he continues. “The art of risk management, lessons learned from past events and use of new technology, data and analytics will help to prepare for responding to unpredicted ‘black swan’ type of events and being able to survive and minimize the catastrophic losses.” Strategically, risk carriers need to understand the influence of climate change whether they are global reinsurers or local primary insurers, particularly as they seek to grow their business and plan for the future. Mergers and acquisitions and/or organic growth into new regions and perils will require an understanding of the risks they are taking on and how these perils might evolve in the future. There is potential for catastrophe models to be used on both sides of the balance sheet as the influence of climate change grows. Dailey points out that many insurance and reinsurance companies invest heavily in real estate assets. “You still need to account for the risk of climate change on the portfolio, whether you’re insuring properties or whether you actually own them, there’s no real difference.” In fact, asset managers are more inclined to a longer-term view of risk when real estate is part of a long-term investment strategy. Here, climate change is becoming a critical part of that strategy. “What we have found is that often the team that handles asset management within a (re)insurance company is an entirely different team to the one that handles catastrophe modeling,” he continues. “But the same modeling tools that we develop at RMS can be applied to both of these problems of managing risk at the enterprise level. “In some cases, a primary insurer may have a one-to-three-year plan, while a major reinsurer may have a five-to-10-year view because they’re looking at a longer risk horizon,” he adds. “Every time I go to speak to a client — whether it be about our U.S. Inland Flood HD Model or our North America Hurricane Models — the question of climate change inevitably comes up. So, it’s become apparent this is no longer an academic question, it’s actually playing into critical business decisions on a daily basis.” Preparing for a Low-carbon Economy Regulation also has an important role in pushing both (re)insurers and large corporates to map and report on the likely impact of climate change on their business, as well as explain what steps they have taken to become more resilient. In the U.K., the Prudential Regulation Authority (PRA) and Bank of England have set out their expectations regarding firms’ approaches to managing the financial risks from climate change. Meanwhile, a survey carried out by the PRA found that 70 percent of U.K. banks recognize the risk climate change poses to their business. Among their concerns are the immediate physical risks to their business models — such as the exposure to mortgages on properties at risk of flood and exposure to countries likely to be impacted by increasing weather extremes. Many have also started to assess how the transition to a low-carbon economy will impact their business models and, in many cases, their investment and growth strategy. “Financial policymakers will not drive the transition to a low-carbon economy, but we will expect our regulated firms to anticipate and manage the risks associated with that transition,” said Bank of England Governor Mark Carney, in a statement. The transition to a low-carbon economy is a reality that (re)insurance industry players will need to prepare for, with the impact already being felt in some markets. In Australia, for instance, there is pressure on financial institutions to withdraw their support from major coal projects. In the aftermath of the Townsville floods in February 2019 and widespread drought across Queensland, there have been renewed calls to boycott plans for Australia’s largest thermal coal mine. To date, 10 of the world’s largest (re)insurers have stated they will not provide property or construction cover for the US$15.5 billion Carmichael mine and rail project. And in its “Mining Risk Review 2018,” broker Willis Towers Watson warned that finding insurance for coal “is likely to become increasingly challenging — especially if North American insurers begin to follow the European lead.”
In Total Harmony
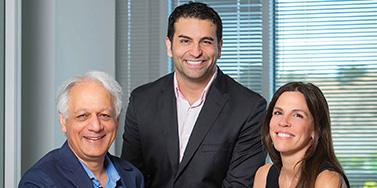
September 05, 2018Karen White joined RMS as CEO in March 2018, followed closely by Moe Khosravy, general manager of software and platform activities. EXPOSURE talks to both, along with Mohsen Rahnama, chief risk modeling officer and one of the firm’s most long-standing team members, about their collective vision for the company, innovation, transformation and technology in risk management Karen and Moe, what was it that sparked your interest in joining RMS? Karen: What initially got me excited was the strength of the hand we have to play here and the fact that the insurance sector is at a very interesting time in its evolution. The team is fantastic — one of the most extraordinary groups of talent I have come across. At our core, we have hundreds of Ph.D.s, superb modelers and scientists, surrounded by top engineers, and computer and data scientists. I firmly believe no other modeling firm holds a candle to the quality of leadership and depth and breadth of intellectual property at RMS. We are years ahead of our competitors in terms of the products we deliver. Moe: For me, what can I say? When Karen calls with an idea it’s very hard to say no! However, when she called about the RMS opportunity, I hadn’t ever considered working in the insurance sector. My eureka moment came when I looked at the industry’s challenges and the technology available to tackle them. I realized that this wasn’t simply a cat modeling property insurance play, but was much more expansive. If you generalize the notion of risk and loss, the potential of what we are working on and the value to the insurance sector becomes much greater. I thought about the technologies entering the sector and how new developments on the AI [artificial intelligence] and machine learning front could vastly expand current analytical capabilities. I also began to consider how such technologies could transform the sector’s cost base. In the end, the decision to join RMS was pretty straightforward. “Developments such as AI and machine learning are not fairy dust to sprinkle on the industry’s problems” Karen White CEO, RMS Karen: The industry itself is reaching a eureka moment, which is precisely where I love to be. It is at a transformational tipping point — the technology is available to enable this transformation and the industry is compelled to undertake it. I’ve always sought to enter markets at this critical point. When I joined Oracle in the 1990s, the business world was at a transformational point — moving from client-server computing to Internet computing. This has brought about many of the huge changes we have seen in business infrastructure since, so I had a bird’s-eye view of what was a truly extraordinary market shift coupled with a technology shift. That experience made me realize how an architectural shift coupled with a market shift can create immense forward momentum. If the technology can’t support the vision, or if the challenges or opportunities aren’t compelling enough, then you won’t see that level of change occur. Do (re)insurers recognize the need to change and are they willing to make the digital transition required? Karen: I absolutely think so. There are incredible market pressures to become more efficient, assess risks more effectively, improve loss ratios, achieve better business outcomes and introduce more beneficial ways of capitalizing risk. You also have numerous new opportunities emerging. New perils, new products and new ways of delivering those products that have huge potential to fuel growth. These can be accelerated not just by market dynamics but also by a smart embrace of new technologies and digital transformation. Mohsen: Twenty-five years ago when we began building models at RMS, practitioners simply had no effective means of assessing risk. So, the adoption of model technology was a relatively simple step. Today, the extreme levels of competition are making the ability to differentiate risk at a much more granular level a critical factor, and our model advances are enabling that. In tandem, many of the Silicon Valley technologies have the potential to greatly enhance efficiency, improve processing power, minimize cost, boost speed to market, enable the development of new products, and positively impact every part of the insurance workflow. Data is the primary asset of our industry — it is the source of every risk decision, and every risk is itself an opportunity. The amount of data is increasing exponentially, and we can now capture more information much faster than ever before, and analyze it with much greater accuracy to enable better decisions. It is clear that the potential is there to change our industry in a positive way. The industry is renowned for being risk averse. Is it ready to adopt the new technologies that this transformation requires? Karen: The risk of doing nothing given current market and technology developments is far greater than that of embracing emerging tech to enable new opportunities and improve cost structures, even though there are bound to be some bumps in the road. I understand the change management can be daunting. But many of the technologies RMS is leveraging to help clients improve price performance and model execution are not new. AI, the Cloud and machine learning are already tried and trusted, and the insurance market will benefit from the lessons other industries have learned as it integrates these technologies. “The sector is not yet attracting the kind of talent that is attracted to firms such as Google, Microsoft or Amazon — and it needs to” Moe Khosravy EVP, Software and Platform, RMS Moe: Making the necessary changes will challenge the perceived risk-averse nature of the insurance market as it will require new ground to be broken. However, if we can clearly show how these capabilities can help companies be measurably more productive and achieve demonstrable business gains, then the market will be more receptive to new user experiences. Mohsen: The performance gains that technology is introducing are immense. A few years ago, we were using computation fluid dynamics to model storm surge. We were conducting the analysis through CPU [central processing unit] microprocessors, which was taking weeks. With the advent of GPU [graphics processing unit] microprocessors, we can carry out the same level of analysis in hours. When you add the supercomputing capabilities possible in the Cloud, which has enabled us to deliver HD-resolution models to our clients — in particular for flood, which requires a high-gradient hazard model to differentiate risk effectively — it has enhanced productivity significantly and in tandem price performance. Is an industry used to incremental change able to accept the stepwise change technology can introduce? Karen: Radical change often happens in increments. The change from client-server to Internet computing did not happen overnight, but was an incremental change that came in waves and enabled powerful market shifts. Amazon is a good example of market leadership out of digital transformation. It launched in 1994 as an online bookstore in a mature, relatively sleepy industry. It evolved into broad e-commerce and again with the introduction of Cloud services when it launched AWS [Amazon Web Services] 12 years ago — now a US$17 billion business that has disrupted the computer industry and is a huge portion of its profit. Amazon has total revenue of US$178 billion from nothing over 25 years, having disrupted the retail sector. Retail consumption has changed dramatically, but I can still go shopping on London’s Oxford Street and about 90 percent of retail is still offline. My point is, things do change incrementally but standing still is not a great option when technology-fueled market dynamics are underway. Getting out in front can be enormously rewarding and create new leadership. However, we must recognize that how we introduce technology must be driven by the challenges it is being introduced to address. I am already hearing people talk about developments such as AI, machine learning and neural networks as if they are fairy dust to sprinkle on the industry’s problems. That is not how this transformation process works. How are you approaching the challenges that this transformation poses? Karen: At RMS, we start by understanding the challenges and opportunities from our customers’ perspectives and then look at what value we can bring that we have not brought before. Only then can we look at how we deliver the required solution. Moe: It’s about having an “outward-in” perspective. We have amazing technology expertise across modeling, computer science and data science, but to deploy that effectively we must listen to what the market wants. We know that many companies are operating multiple disparate systems within their networks that have simply been built upon again and again. So, we must look at harnessing technology to change that, because where you have islands of data, applications and analysis, you lose fidelity, time and insight and costs rise. Moe: While there is a commonality of purpose spanning insurers, reinsurers and brokers, every organization is different. At RMS, we must incorporate that into our software and our platforms. There is no one-size-fits-all and we can’t force everyone to go down the same analytical path. That’s why we are adopting a more modular approach in terms of our software. Whether the focus is portfolio management or underwriting decision-making, it’s about choosing those modules that best meet your needs. “Data is the primary asset of our industry — it is the source of every risk decision, and every risk is itself an opportunity” Mohsen Rahmana, PhD Chief Risk Modeling Officer, RMS Mohsen: When constructing models, we focus on how we can bring the right technology to solve the specific problems our clients have. This requires a huge amount of critical thinking to bring the best solution to market. How strong is the talent base that is helping to deliver this level of capability? Mohsen: RMS is extremely fortunate to have such a fantastic array of talent. This caliber of expertise is what helps set us apart from competitors, enabling us to push boundaries and advance our modeling capabilities at the speed we are. Recently, we have set up teams of modelers and data and computer scientists tasked with developing a range of innovations. It’s fantastic having this depth of talent, and when you create an environment in which innovative minds can thrive you quickly reap the rewards — and that is what we are seeing. In fact, I have seen more innovation at RMS in the last six months than over the past several years. Moe: I would add though that the sector is not yet attracting the kind of talent seen at firms such as Google, Microsoft or Amazon, and it needs to. These companies are either large-scale customer-service providers capitalizing on big data platforms and leading-edge machine-learning techniques to achieve the scale, simplicity and flexibility their customers demand, or enterprises actually building these core platforms themselves. When you bring new blood into an organization or industry, you generate new ideas that challenge current thinking and practices, from the user interface to the underlying platform or the cost of performance. We need to do a better PR job as a technology sector. The best and brightest people in most cases just want the greatest problems to tackle — and we have a ton of those in our industry. Karen: The critical component of any successful team is a balance of complementary skills and capabilities focused on having a high impact on an interesting set of challenges. If you get that dynamic right, then that combination of different lenses correctly aligned brings real clarity to what you are trying to achieve and how to achieve it. I firmly believe at RMS we have that balance. If you look at the skills, experience and backgrounds of Moe, Mohsen and myself, for example, they couldn’t be more different. Bringing Moe and Mohsen together, however, has quickly sparked great and different thinking. They work incredibly well together despite their vastly different technical focus and career paths. In fact, we refer to them as the “Moe-Moes” and made them matching inscribed giant chain necklaces and presented them at an all-hands meeting recently. Moe: Some of the ideas we generate during our discussions and with other members of the modeling team are incredibly powerful. What’s possible here at RMS we would never have been able to even consider before we started working together. Mohsen: Moe’s vast experience of building platforms at companies such as HP, Intel and Microsoft is a great addition to our capabilities. Karen brings a history of innovation and building market platforms with the discipline and the focus we need to deliver on the vision we are creating. If you look at the huge amount we have been able to achieve in the months that she has been at RMS, that is a testament to the clear direction we now have. Karen: While we do come from very different backgrounds, we share a very well-defined culture. We care deeply about our clients and their needs. We challenge ourselves every day to innovate to meet those needs, while at the same time maintaining a hell-bent pragmatism to ensure we deliver. Mohsen: To achieve what we have set out to achieve requires harmony. It requires a clear vision, the scientific know-how, the drive to learn more, the ability to innovate and the technology to deliver — all working in harmony. Career Highlights Karen White is an accomplished leader in the technology industry, with a 25-year track record of leading, innovating and scaling global technology businesses. She started her career in Silicon Valley in 1993 as a senior executive at Oracle. Most recently, Karen was president and COO at Addepar, a leading fintech company serving the investment management industry with data and analytics solutions. Moe Khosravy (center) has over 20 years of software innovation experience delivering enterprise-grade products and platforms differentiated by data science, powerful analytics and applied machine learning to help transform industries. Most recently he was vice president of software at HP Inc., supporting hundreds of millions of connected devices and clients. Mohsen Rahnama leads a global team of accomplished scientists, engineers and product managers responsible for the development and delivery of all RMS catastrophe models and data. During his 20 years at RMS, he has been a dedicated, hands-on leader of the largest team of catastrophe modeling professionals in the industry.
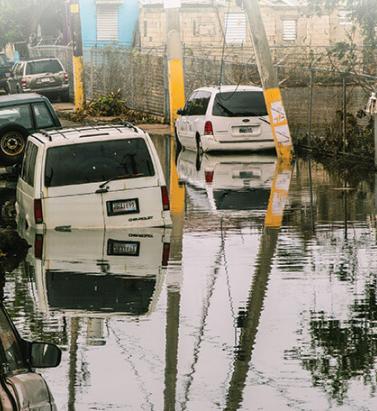

When the Lights Went Out
September 05, 2018How poor infrastructure, grid blackouts and runaway business interruption has hampered Puerto Rico’s recovery in the aftermath of Hurricane Maria As the 2018 North Atlantic hurricane season continues, Puerto Rico has yet to recover from destructive events of the previous year. In September 2017, Category 4 Hurricane Maria devastated several Caribbean islands, including Puerto Rico, and left a trail of destruction in its path. For many, Maria was one of the worst natural catastrophes to hit a U.S. territory, causing an estimated US$65 billion to US$115 billion in damage and claiming as many as 4,500 to 5,000 lives. The damage wrought has further strained the island’s sluggish economy. Puerto Rico had over US$70 billion in public debt when Maria hit. Economic forecasts for 2018 to 2020, considering the impact of Hurricane Maria, suggest Puerto Rico’s GDP will decline by 7 to 8 percent in 2018 and likely remain in a negative range of 5 to 7 percent for the next few years. “Resilience is also about the financial capacity to come back and do the reconstruction work” Pooya Sarabandi RMS Power outages, business interruption (BI) and contingent BI (CBI) — including supply chain disruption — have hampered the economy’s recovery. “Resilience is also about the financial capacity to come back and do the reconstruction work,” explains Pooya Sarabandi, global head of data analy- tics at RMS. “You’re now into this chicken- and-egg situation where the Puerto Rican government already has a lot of public debt and doesn’t have reserves, and meanwhile the federal U.S. government is only willing to provide a certain level of funding.” Maria’s devastating impact on Puerto Rico demonstrates the lasting effect a major catastrophe can have when it affects a small, isolated region with a concentrated industry and lack of resilience in infrastructure and lifelines. Whereas manufacturers based on the U.S. mainland have contingencies to tap into — the workforce, raw materials and components, and infrastructure in other parts of the country during times of need — there is not the same opportunity to do this on an island, explains Sarabandi. Rolling Blackouts Following Maria’s landfall, residences and businesses experienced power outages throughout the island. Severe physical damage to electric power generation plants, transmission and distribution systems — including solar and wind power generation plants — plunged the island into a prolonged period of rolling blackouts. Around 80 percent of utility poles were damaged in the event, leaving most of the island without electricity. Two weeks after the storm, 90 percent of the island was still without power. A month on, roughly 85 percent of customers were not connected to the power grid. Three months later, this figure was reported to be about half of Puerto Ricans. And finally, after six months, about 15 percent of residents did not have electricity. “There’s no real damage on the grid itself,” says Victor Roldan, head of Caribbean and Latin America at RMS. “Most of the damage is on the distribution lines around the island. Where they had the better infrastructure in the capital, San Juan, they were able to get it back up and running in about two weeks. But there are still parts of the island without power due to bad distribution infrastructure. And that’s where the business interruption is mostly coming from. “There are reports that 50 percent of all Maria claims for Puerto Rico will be CBI related,” adds Roldan. “Insurers were very competitive, and CBI was included in commercial policies without much thought to the consequences. Policyholders probably paid a fifth of the premiums they should have, way out of kilter with the risk. The majority of CBI claims will be power related, the businesses didn’t experience physical damage, but the loss of power has hit them financially.” Damage to transportation infrastructure, including railways and roads, only delayed the pace of recovery. The Tren Urbano, the island’s only rail line that serves the San Juan metropolitan area (where roughly 60 percent of Puerto Ricans live), started limited service for the first time almost three months after Hurricane Maria struck. There were over 1,500 reported instances of damage to roads and bridges across the island. San Juan’s main airport, the busiest in the Caribbean, was closed for several weeks. A Concentration of Risk Roughly half of Puerto Rico’s economy is based on manufacturing activities, with around US$50 billion in GDP coming from industries such as pharmaceutical, medical devices, chemical, food, beverages and tobacco. Hurricane Maria had a significant impact on manufacturing output in Puerto Rico, particularly on the pharmaceutical and medical devices industries, which is responsible for 30 percent of the island’s GDP. According to Anthony Phillips, chairman of Willis Re Latin America and Caribbean, the final outcome of the BI loss remains unknown but has exceeded expectations due to the length of time in getting power reinstalled. “It’s hard to model the BI loss when you depend on the efficiency of the power companies,” he says. “We used the models and whilst personal lines appeared to come in within expectations, commercial lines has exceeded them. This is mainly due to BI and the inability of the Puerto Rico Electric Power Authority (PREPA) to get things up and running.” Home to more than 80 pharmaceutical manufacturing facilities, many of which are operated by large multinational companies, Puerto Rico’s pharmaceutical hub was a significant aggregation of risk from a supply chain and insurance perspective. Although only a few of the larger pharmaceutical plants were directly damaged by the storm, operations across the sector were suspended or reduced, in some cases for weeks or even months, due to power outages, lack of access and logistics. “The perception of the Business Interruption insurers anticipated, versus the reality, was a complete mismatch” Mohsen Rahnama RMS “The perception of the BI insurers anticipated, versus the reality, was a complete mismatch,” says Mohsen Rahnama, chief risk modeling officer at RMS. “All the big names in pharmaceuticals have operations in Puerto Rico because it’s more cost- effective for production. And they’re all global companies and have backup processes in place and cover for business interruption. However, if there is no diesel on the island for their generators, and if materials cannot get to the island, then there are implications across the entire chain of supply.” While most of the plants were equipped with backup power generation units, manu- facturers struggled due to long-term lack of connection to the island’s only power grid. The continuous functioning of on-site generators was not only key to resuming production lines, power was also essential for refrigeration and storage of the pharmaceuticals. Five months on, 85 medicines in the U.S. were classified by the Food and Drug Administration (FDA) as “in shortage.” There are several reasons why Puerto Rico’s recovery stalled. Its isolation from the U.S. mainland and poor infrastructure were both key factors, highlighted by comparing the island’s recovery to recovery operations following U.S. mainland storms, such as Hurricane Harvey in Texas last year and 2012’s Superstorm Sandy. Not only did Sandy impact a larger area when it hit New York and New Jersey, it also caused severe damage to all transmission and distribution systems in its path. However, recovery and restoration took weeks, not months. It is essential to incorporate the vulnerabilities created by an aggregation of risk, inadequate infrastructure and lack of contingency options into catastrophe and pricing models, thinks Roldan. “There is only one power company and the power company is facing bankruptcy,” he says. “It hasn’t invested in infrastructure in years. Maria wasn’t even the worst-case scenario because it was not a direct hit to San Juan. So, insurers need to be prepared and underwriting business interruption risks in a more sophisticated manner and not succumbing to market pressures.” CBI Impact on Hospitality and Tourism Large-magnitude, high-consequence events have a lasting impact on local populations. Businesses can face increased levels of disruption and loss of revenue due to unavailability of customers, employees or both. These resourcing issues need to be properly considered in the scenario-planning stage, particularly for sectors such as hospitality and tourism. Puerto Rico’s hospitality and tourism sectors are a significant source of its GDP. While 69 percent of hotels and 61 percent of casinos were operational six weeks after Maria struck, according to the Puerto Rico Tourism Company, other factors continued to deter visitors. It was not until the end of February 2018, five months after the event, that roughly 80 percent of Puerto Rico’s hotels and restaurants were back in business with tourists returning to the island. This suggests a considerable loss of income due to indirect business interruption in the hospitality and tourism industry.
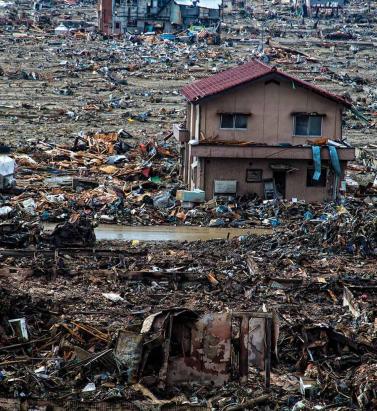
Where Tsunami Warnings Are Etched in Stone
May 10, 2018EXPOSURE looks back at the 2011 Tohoku event and other significant events that have shaped scientific knowledge and understanding of earthquake risk incorporated into the RMS® Japan Earthquake and Tsunami HD Model Hundreds of ancient markers dot the coastline of Japan, some over 600 years old, as a reminder of the danger of tsunami. Today, a new project to construct a 12.5-meter-high seawall stretching nearly 400 kilometers along Japan’s northeast coast is another reminder. Japan is a highly seismically active country and was well prepared for earthquakes and tsunami ahead of the Tohoku Earthquake in 2011. It had strict building codes, protective tsunami barriers, early-warning systems and disaster-response plans. But it was the sheer magnitude, scale and devastation caused by the Tohoku Earthquake and Tsunami that made it stand out from the many thousands of earthquakes that had come before it in modern times. What had not been foreseen in government planning was that an earthquake of this magnitude could occur, nor that it could produce such a sizable tsunami. The Tohoku Earthquake was a magnitude 9.0 event — off the charts as far as the Japanese historical record for earthquakes was concerned. A violent change in the ocean bottom triggered an immense tsunami with waves of up to 40 meters that tore across the northeast coast of the main island of Honshu, traveling up to 10 kilometers inland in the Sendai area. The tsunami breached sea walls and claimed almost everything in its path, taking 16,000 lives (a further 2,000 remain missing, presumed dead) and causing economic losses of US$235 billion. However, while the historical record proved inadequate preparation for the Tohoku event, the geological record shows that events of that magnitude had occurred before records began, explains Mohsen Rahnama, chief risk modeling officer at RMS. “Since the Tohoku event, there’s been a shift … to moving further back in time using a more full consideration of the geological record” Mohsen Rahnama RMS “If you go back in the geological record to 869 in the Tohoku region, there is evidence for a potentially similarly scaled tsunami,” he explains. “Since the Tohoku event, there’s been a shift in the government assessments moving away from a focus on what happened historically to a more full consideration of the geological record.” The geological record, which includes tsunami deposits in coastal lakes and across the Sendai and Ishinomaki plains, shows there were large earthquakes and associated tsunami in A.D. 869, 1611 and 1896. The findings of this research point to the importance of having a fully probabilistic tsunami model at a very high resolution. Rahnama continues: “The Tohoku event really was the ‘perfect’ tsunami hitting the largest exposure concentration at risk to tsunami in Japan. The new RMS tsunami model for Japan includes tsunami events similar to and in a few cases larger than were observed in 2011. Because the exposure in the region is still being rebuilt, the model cannot produce tsunami events with this scale of loss in Tohoku at this time.” Incorporating Secondary Perils RMS has incorporated the lessons from the Tohoku Earthquake and other major earthquakes that have occurred within its model. There have been several large earthquakes around the world, and they all inform thinking about the largest events, particularly how the ground motions they produce are modeled. Crucially, it includes a fully probabilistic tsunami model that is integrated with the earthquake stochastic event set. On understanding strong ground shaking, information across events is utilized. For example, petrochemical facilities around the world are built with relatively consistent construction practices. This means that examination of the damage experienced by these types of facilities in Chile and Japan can inform the understanding of the performance of these facilities in other parts of the world with similar seismic hazard. The Maule Earthquake in Chile in 2010, the Canterbury sequence of earthquakes in New Zealand in 2010 and 2011, and the more recent Kumamoto Earthquakes in Japan in 2016, have added considerably to the data sets. Most notably they have informed scientific understanding of the nature of secondary earthquake perils, including tsunami, fire following earthquake, landslides and liquefaction. The 2016 Kumamoto Earthquake sequence triggered extensive landsliding. The sequence included five events in the range of magnitude 5.5 to 7.0 and caused severe damage in Kumamoto and Oita Prefectures from ground shaking, landsliding, liquefaction and fire following earthquake. “Liquefaction is in the model as a secondary peril. RMS has redesigned and recalibrated the liquefaction model for Japan. The new model directly calculates damage due to vertical deformation due to liquefaction processes,” says Chesley Williams, senior director, product management at RMS. “While the 1964 Niigata Earthquake with its tipped apartment buildings showed that liquefaction damages can be severe in Japan, on a countrywide basis the earthquake risk is driven by the shaking, tsunami and fire following, followed by liquefaction and landslide. For individual exposures, the key driver of the earthquake risk is very site specific, highlighting the importance of high-resolution modeling in Japan.” The RMS model accounts for the clustering of large events on the Nankai Trough. This is an important advancement as an examination of the historical record shows that events on the Nankai Trough have either occurred as full rupturing events (e.g., 1707 Hoei Earthquake) or as pairs of events (e.g., 1944 and 1946 and two events in 1854). This is different from aftershocks, explains Williams. “Clustered events are events on different sources that would have happened in the long-term earthquake record, and the occurrence of one event impacts the timing of the other events. This is a subtle but important distinction. We can model event clustering on the Nankai Trough due to the comprehensive event record informed by both historical events and the geologic record.” The Tohoku event resulted in insurance losses of US$30 billion to US$40 billion, the costliest earthquake event for the insurance industry in history. While the news media focused on the extreme tsunami, the largest proportion of the insurance claims emanated from damage wrought by the strong ground shaking. Interestingly, likely due to cultural constraints, only a relatively low amount of post-event loss amplification was observed. “In general for very large catastrophes, claims costs can exceed the normal cost of settlement due to a unique set of economic, social and operational factors,” says Williams. “Materials and labor become more expensive and claims leakage can be more of an issue, so there are a number of factors that kick in that are captured by the RMS post-event loss amplification modeling. The Japan model explicitly models post-event loss amplification but limits the impacts to be consistent with the observations in recent events in Japan.” Supply chain disruption and contingent business interruption were significant sources of loss following the Tohoku event. This was exacerbated by the level seven meltdown at the Fukushima nuclear power plant that resulted in evacuations, exclusion zones and rolling blackouts. “We sent reconnaissance teams to Japan after the event to understand the characteristics of damage and to undertake case studies for business interruption,” says Williams. “We visited large industrial facilities and talked to them about their downtime, their material requirement and their access to energy sources to better understand what had impacted their ability to get back up and running.” Recent events have re-emphasized that there are significant differences in business interruption by occupancy. “For example, a semiconductor facility is likely going to have a longer downtime than a cement factory,” says Williams. “The recent events have highlighted the impacts on business interruption for certain occupancies by damage to supply sources. These contingent business interruptions are complex, so examination of the case studies investigated in Japan were instrumental for informing the model.” Rebuilding in the seven years since the Tohoku Tsunami struck has been an exercise in resilient infrastructure. With nearly half a million people left homeless, there has been intense rebuilding to restore services, industry and residential property. US$12 billion has been spent on seawalls alone, replacing the 4-meter breakwaters with 12.5-meter-high tsunami barriers. An endless convoy of trucks has been moving topsoil from the hills to the coastline in order to raise the land by over 10 meters in places. Most cities have decided to elevate by several meters, with a focus on rebuilding commercial premises in exposed areas. Some towns have forbidden the construction of homes in flat areas nearest the coasts and relocated residents to higher ground. Tokyo-Yokohama: The World’s Most Exposed Metropolis The Japanese metropolis of Tokyo-Yokohama has the world’s greatest GDP at risk from natural catastrophes. Home to 38 million residents, it has potential for significant economic losses from multiple perils, but particularly earthquakes. According to Swiss Re it is the riskiest metropolitan area in the world. A combination of strict building codes, land use plans and disaster preparedness have significantly reduced the city’s vulnerability in recent decades. Despite the devastation caused by the tsunami, very few casualties (around 100) related to partial or complete building collapse resulting from ground shaking during the magnitude 9.0 Tohoku Earthquake.
