


EXPOSURE
The RMS Magazine with a unique perspective and clear mission “... to provide insight and analysis to help insurance and risk professionals innovate, adapt, and deliver.”

Insurance: The next 10 years
Mohsen Rahnama, Cihan Biyikoglu and Moe Khosravy of RMS look to 2029, consider the…
Times Square, New York City
Tag: CANADA
Data From the Ashes
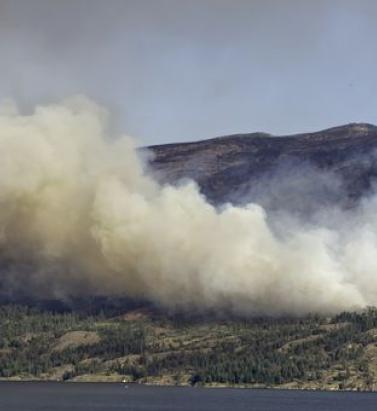
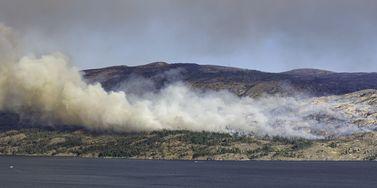
May 05, 2021Five years on from the wildfire that devastated Fort McMurray, the event has proved critical to developing a much deeper understanding of wildfire losses in Canada In May 2016, Fort McMurray, Alberta, became the location of Canada’s costliest wildfire event to date. In total, some 2,400 structures were destroyed by the fire, with a similar number designated as uninhabitable. Fortunately, the evacuation of the 90,000-strong population meant that no lives were lost as a direct result of the fires. From an insurance perspective, the estimated CA$4 billion loss elevated wildfire risk to a whole new level. This was a figure now comparable to the extreme fire losses experienced in wildfire-exposed regions such as California, and established wildfire as a peak natural peril second only to flood in Canada. However, the event also exposed gaps in the market’s understanding of wildfire events and highlighted the lack of actionable exposure data. In the U.S., significant investment had been made in enhancing the scale and granularity of publicly available wildfire data through bodies such as the United States Geological Survey, but the resolution of data available through equivalent parties in Canada was not at the same standard. A Question of Scale Making direct wildfire comparisons between the U.S. and Canada is difficult for multiple reasons. Take, for example, population density. Canada’s total population is approximately 37.6 million, spread over a landmass of 9,985 million square kilometers (3,855 million square miles), while California has a population of around 39.5 million, inhabiting an area of 423,970 square kilometers (163,668 square miles). The potential for wildfire events impacting populated areas is therefore significantly less in Canada. In fact, in the event of a wildfire in Canada—due to the reduced potential exposure—fires are typically allowed to burn for longer and over a wider area, whereas in the U.S. there is a significant focus on fire suppression. This willingness to let fires burn has the benefit of reducing levels of vegetation and fuel buildup. Also, more fires in the country are a result of natural rather than human-caused ignitions and occur in hard-to-access areas with low population exposure. Sixty percent of fires in Canada are attributed to human causes. The challenge for the insurance industry in Canada is therefore more about measuring the potential impact of wildfire on smaller pockets of exposure Michael Young, senior director, product management, at RMS But as Fort McMurray showed, the potential for disaster clearly exists. In fact, the event was one of a series of large-scale fires in recent years that have impacted populated areas in Canada, including the Okanagan Mountain Fire, the McLure Fire, the Slave Lake Fire, and the Williams Lake and Elephant Hills Fire. “The challenge for the insurance industry in Canada,” explains Michael Young, senior director, product management, at RMS, “is therefore more about measuring the potential impact of wildfire on smaller pockets of exposure, rather than the same issues of frequency and severity of event that are prevalent in the U.S.” Regions at Risk What is interesting to note is just how much of the populated territories are potentially exposed to wildfire events in Canada, despite a relatively low population density overall. A 2017 report entitled Mapping Canadian Wildland Fire Interface Areas, published by the Canadian Forest Service, stated that the threat of wildfire impacting populated areas will inevitably increase as a result of the combined impacts of climate change and the development of more interface area “due to changes in human land use.” This includes urban and rural growth, the establishment of new industrial facilities and the building of more second homes. According to the study, the wildland-human interface in Canada spans 116.5 million hectares (288 million acres), which is 13.8 percent of the country’s total land area or 20.7 percent of its total wildland fuel area. In terms of the wildland-urban interface (WUI), this covers 32.3 million hectares (79.8 million acres), which is 3.8 percent of land area or 5.8 percent of fuel area. The WUI for industrial areas (known as WUI-Ind) covers 10.5 million hectares (25.9 million acres), which is 1.3 percent of land area or 1.9 percent of fuel area. In terms of the provinces and territories with the largest interface areas, the report highlighted Quebec, Alberta, Ontario and British Columbia as being most exposed. At a more granular level, it stated that in populated areas such as cities, towns and settlements, 96 percent of locations had “at least some WUI within a five-kilometer buffer,” while 60 percent also had over 500 hectares (1,200 acres) of WUI within a five-kilometer buffer (327 of the total 544 areas). Data: A Closer Look Fort McMurray has, in some ways, become an epicenter for the generation of wildfire-related data in Canada. According to a study by the Institute for Catastrophic Loss Reduction, which looked at why certain homes survived, the Fort McMurray Wildfire “followed a well-recognized pattern known as the wildland/urban interface disaster sequence.” The detailed study, which was conducted in the aftermath of the disaster, showed that 90 percent of properties in the areas affected by the wildfire survived the event. Further, “surviving homes were generally rated with ‘Low’ to ‘Moderate’ hazard levels and exhibited many of the attributes promoted by recommended FireSmart Canada guidelines.” FireSmart Canada is an organization designed to promote greater wildfire resilience across the country. Similar to FireWise in the U.S., it has created a series of hazard factors spanning aspects such as building structure, vegetation/fuel, topography and ignition sites. It also offers a hazard assessment system that considers hazard layers and adoption rates of resilience measures. According to the study: “Tabulation by hazard level shows that 94 percent of paired comparisons of all urban and country residential situations rated as having either ‘Low’ or ‘Moderate’ hazard levels survived the wildfire. Collectively, vegetation/fuel conditions accounted for 49 percent of the total hazard rating at homes that survived and 62 percent of total hazard at homes that failed to survive.” Accessing the Data In many ways, the findings of the Fort McMurray study are reassuring, as they clearly demonstrate the positive impact of structural and topographical risk mitigation measures in enhancing wildfire resilience—essentially proving the underlying scientific data. Further, the data shows that “a strong, positive correlation exists between home destruction during wildfire events and untreated vegetation within 30 meters of homes.” “What the level of survivability in Fort McMurray showed was just how important structural hardening is,” Young explains. “It is not simply about defensible space, managing vegetation and ensuring sufficient distance from the WUI. These are clearly critical components of wildfire resilience, but by factoring in structural mitigation measures you greatly increase levels of survivability, even during urban conflagration events as extreme as Fort McMurray.” What the level of survivability in Fort McMurray showed was just how important structural hardening is Michael Young, senior director, product management, RMS From an insurance perspective, access to these combined datasets is vital to effective exposure analysis and portfolio management. There is a concerted drive on the part of the Canadian insurance industry to adopt a more data-intensive approach to managing wildfire exposure. Enhancing data availability across the region has been a key focus at RMS® in recent years, and efforts have culminated in the launch of the RMS® Canada Wildfire HD Model. It offers the most complete view of the country’s wildfire risk currently available and is the only probabilistic model available to the market that covers all 10 provinces. “The hazard framework that the model is built on spans all of the critical wildfire components, including landscape and fire behavior patterns, fire weather simulations, fire and smoke spread, urban conflagration and ember intensity,” says Young. “In each instance, the hazard component has been precisely calibrated to reflect the dynamics, assumptions and practices that are specific to Canada. “For example, the model’s fire spread component has been adjusted to reflect the fact that fires tend to burn for longer and over a wider area in the country, which reflects the watching brief that is often applied to managing wildfire events, as opposed to the more suppression-focused approach in the U.S.,” he continues. “Also, the urban conflagration component helps insurers address the issue of extreme tail-risk events such as Fort McMurray.” Another key model differentiator is the wildfire vulnerability function, which automatically determines key risk parameters based on high-resolution data. In fact, RMS has put considerable efforts into building out the underlying datasets by blending multiple different information sources to generate fire, smoke and ember footprints at 50-meter resolution, as opposed to the standard 250-meter resolution of the publicly available data. Critical site hazard data such as slope, distance to vegetation, and fuel types can be set against primary building modifiers such as construction, number of stories and year built. A further secondary modifier layer enables insurers to apply building-specific mitigation measures such as roof characteristics, ember accumulators and whether the property has cladding or a deck. Given the influence of such components on building survivability during the Fort McMurray Fire, such data is vital to exposure analysis at the local level. A Changing Market “The market has long recognized that greater data resolution is vital to adopting a more sophisticated approach to wildfire risk,” Young says. “As we worked to develop this new model, it was clear from our discussions with clients that there was an unmet need to have access to hard data that they could ‘hang numbers from.’ There was simply too little data to enable insurers to address issues such as potential return periods, accumulation risk and countrywide portfolio management.” The ability to access more granular data might also be well timed in response to a growing shift in the information required during the insurance process. There is a concerted effort taking place across the Canadian insurance market to reduce the information burden on policyholders during the submission process. At the same time, there is a shift toward risk-based pricing. “As we see this dynamic evolve,” Young says, “the reduced amount of risk information sourced from the insured will place greater importance on the need to apply modeled data to how insurance companies manage and price risk accurately. Companies are also increasingly looking at the potential to adopt risk-based pricing, a process that is dependent on the ability to apply exposure analysis at the individual location level. So, it is clear from the coming together of these multiple market shifts that access to granular data is more important to the Canadian wildfire market than ever.”
Severe Convective Storms: Experience Cannot Tell the Whole Story
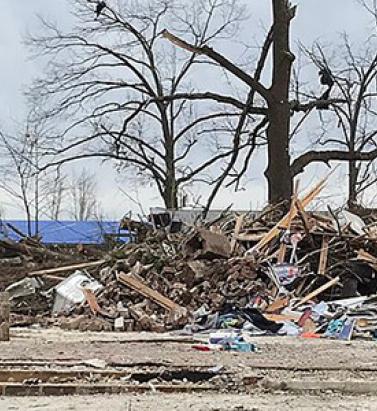
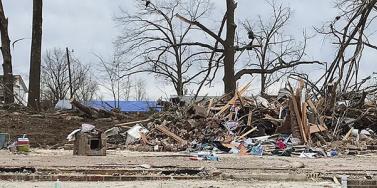
May 05, 2020Severe convective storms can strike with little warning across vast areas of the planet, yet some insurers still rely solely on historical records that do not capture the full spectrum of risk at given locations. EXPOSURE explores the limitations of this approach and how they can be overcome with cat modeling Attritional and high-severity claims from severe convective storms (SCS) — tornadoes, hail, straight-line winds and lightning — are on the rise. In fact, in the U.S., average annual insured losses (AAL) from SCS now rival even those from hurricanes, at around US$17 billion, according to the latest RMS U.S. SCS Industry Loss Curve from 2018. In Canada, SCS cost insurers more than any other natural peril on average each year. Despite the scale of the threat, it is often overlooked as a low volatility, attritional peril Christopher Allen RMS “Despite the scale of the threat, it is often overlooked as a low volatility, attritional peril,” says Christopher Allen, product manager for the North American SCS and winterstorm models at RMS. But losses can be very volatile, particularly when considering individual geographic regions or portfolios (see Figure 1). Moreover, they can be very high. “The U.S. experiences higher insured losses from SCS than any other country. According to the National Weather Service Storm Prediction Center, there over 1,000 tornadoes every year on average. But while a powerful tornado does not cause the same total damage as a major earthquake or hurricane, these events are still capable of causing catastrophic losses that run into the billions.” Figure 1: Insured losses from U.S. SCS in the Northeast (New York, Connecticut, Rhode Island, Massachusetts, New Hampshire, Vermont, Maine), Great Plains (North Dakota, South Dakota, Nebraska, Kansas, Oklahoma) and Southeast (Alabama, Mississippi, Louisiana, Georgia). Losses are trended to 2020 and then scaled separately for each region so the mean loss in each region becomes 100. Source: Industry Loss Data Two of the costliest SCS outbreaks to date hit the U.S. in spring 2011. In late April, large hail, straight-line winds and over 350 tornadoes spawned across wide areas of the South and Midwest, including over the cities of Tuscaloosa and Birmingham, Alabama, which were hit by a tornado rating EF-4 on the Enhanced Fujita (EF) scale. In late May, an outbreak of several hundred more tornadoes occurred over a similarly wide area, including an EF-5 tornado in Joplin, Missouri, that killed over 150 people. If the two outbreaks occurred again today, according to an RMS estimate based on trending industry loss data, each would easily cause over US$10 billion of insured loss. However, extreme losses from SCS do not just occur in the U.S. In April 1999, a hailstorm in Sydney dropped hailstones of up to 3.5 inches (9 centimeters) in diameter over the city, causing insured losses of AU$5.6 billion according to the Insurance Council of Australia (ICA), currently the most costly insurance event in Australia’s history [1]. “It is entirely possible we will soon see claims in excess of US$10 billion from a single SCS event,” Allen says, warning that relying on historical data alone to quantify SCS (re)insurance risk leaves carriers underprepared and overexposed. Historical Records are Short and Biased According to Allen, the rarity of SCS at a local level means historical weather and loss data fall short of fully characterizing SCS hazard. In the U.S., the Storm Prediction Center’s national record of hail and straight-line wind reports goes back to 1955, and tornado reports date back to 1950. In Canada, routine tornado reports go back to 1980. “These may seem like adequate records, but they only scratch the surface of the many SCS scenarios nature can throw at us,” Allen says. “To capture full SCS variability at a given location, records should be simulated over thousands, not tens, of years,” he explains. “This is only possible using a cat model that simulates a very wide range of possible storms to give a fuller representation of the risk at that location. Observed over tens of thousands of years, most locations would have been hit by SCS just as frequently as their neighbors, but this will never be reflected in the historical records. Just because a town or city has not been hit by a tornado in recent years doesn’t mean it can’t be.” To capture full SCS variability at a given location, records should be simulated over thousands, not tens, of years Shorter historical records could also misrepresent the severity of SCS possible at a given location. Total insured catastrophe losses in Phoenix, Arizona, for example, were typically negligible between 1990 and 2009, but on October 5, 2010, Phoenix was hit by its largest-ever tornado and hail outbreak, causing economic losses of US$4.5 billion. (Source: NOAA National Centers for Environmental Information) Just like the national observations, insurers’ own claims histories, or industry data such as presented in Figure 1, are also too short to capture the full extent of SCS volatility, Allen warns. “Some primary insurers write very large volumes of natural catastrophe business and have comprehensive claims records dating back 20 or so years, which are sometimes seen as good enough datasets on which to evaluate the risk at their insured locations. However, underwriting based solely on this length of experience could lead to more surprises and greater earnings instability.” If a Tree Falls and No One Hears… Historical SCS records in most countries rely primarily on human observation reports. If a tornado is not seen, it is not reported, which means that unlike a hurricane or large earthquake it is possible to miss SCS in the recent historical record. “While this happens less often in Europe, which has a high population density, missed sightings can distort historical data in Canada, Australia and remote parts of the U.S.,” Allen explains. Another key issue is that the EF scale rates tornado strength based on how much damage is caused, but this does not always reflect the power of the storm. If a strong tornado occurs in a rural area with few buildings, for example, it won’t register high on the EF scale, even though it could have caused major damage to an urban area. “This again makes the historical record very challenging to interpret,” he says. “Catastrophe modelers invest a great deal of time and effort in understanding the strengths and weaknesses of historical data. By using robust aspects of observations in conjunction with other methods, for example numerical weather simulations, they are able to build upon and advance beyond what experience tells us, allowing for more credible evaluation of SCS risk than using experience alone.” Then there is the issue of rising exposures. Urban expansion and rising property prices, in combination with factors such as rising labor costs and aging roofs that are increasingly susceptible to damage, are pushing exposure values upward. “This means that an identical SCS in the same location would most likely result in a higher loss today than 20 years ago, or in some cases may result in an insured loss where previously there would have been none,” Allen explains. Calgary, Alberta, for example, is the hailstorm capital of Canada. On September 7, 1991, a major hailstorm over the city resulted in the country’s largest insured loss to date from a single storm: CA$343 million was paid out at the time. The city has of course expanded significantly since then (see Figure 2), and the value of the exposure in preexisting urban areas has also increased. An identical hailstorm occurring over the city today would therefore cause far larger insured losses, even without considering inflation. Figure 2: Urban expansion in Calgary, Alberta, Canada. European Space Agency. Land Cover CCI Product User Guide Version 2. Tech. Rep. (2017). Available at: maps.elie.ucl.ac.be/CCI/viewer/download/ESACCI-LC-Ph2-PUGv2_2.0.pdf “Probabilistic SCS cat modeling addresses these issues,” Allen says. “Rather than being constrained by historical data, the framework builds upon and beyond it using meteorological, engineering and insurance knowledge to evaluate what is physically possible today. This means claims do not have to be ‘on-leveled’ to account for changing exposures, which may require the user to make some possibly tenuous adjustments and extrapolations; users simply input the exposures they have today and the model outputs today’s risk.” The Catastrophe Modeling Approach In addition to their ability to simulate “synthetic” loss events over thousands of years, Allen argues, cat models make it easier to conduct sensitivity testing by location, varying policy terms or construction classes; to drill into loss-driving properties within portfolios; and to optimize attachment points for reinsurance programs. SCS cat models are commonly used in the reinsurance market, partly because they make it easy to assess tail risk (again, difficult to do using a short historical record alone), but they are currently used less frequently for underwriting primary risks. There are instances of carriers that use catastrophe models for reinsurance business but still rely on historical claims data for direct insurance business. So why do some primary insurers not take advantage of the cat modeling approach? “Though not marketwide, there can be a perception that experience alone represents the full spectrum of SCS risk — and this overlooks the historical record’s limitations, potentially adding unaccounted-for risk to their portfolios,” Allen says. What is more, detailed studies of historical records and claims “on-leveling” to account for changes over time are challenging and very time-consuming. By contrast, insurers who are already familiar with the cat modeling framework (for example, for hurricane) should find that switching to a probabilistic SCS model is relatively simple and requires little additional learning from the user, as the model employs the same framework as for other peril models, he explains. A US$10 billion SCS loss is around the corner, and carriers need to be prepared and have at their disposal the ability to calculate the probability of that occurring for any given location Furthermore, catastrophe model data formats, such as the RMS Exposure and Results Data Modules (EDM and RDM), are already widely exchanged, and now the Risk Data Open Standard™ (RDOS) will have increasing value within the (re)insurance industry. Reinsurance brokers make heavy use of cat modeling submissions when placing reinsurance, for example, while rating agencies increasingly request catastrophe modeling results when determining company credit ratings. Allen argues that with property cat portfolios under pressure and the insurance market now hardening, it is all the more important that insurers select and price risks as accurately as possible to ensure they increase profits and reduce their combined ratios. “A US$10 billion SCS loss is around the corner, and carriers need to be prepared and have at their disposal the ability to calculate the probability of that occurring for any given location,” he says. “To truly understand their exposure, risk must be determined based on all possible tomorrows, in addition to what has happened in the past.” [1] Losses normalized to 2017 Australian dollars and exposure by the ICA. Source: https://www.icadataglobe.com/access-catastrophe-data. To obtain a holistic view of severe weather risk contact the RMS team here
