
EXPOSURE
The Moody's insurance solutions magazine with a unique perspective and clear mission “... to provide insight and analysis to help insurance and risk professionals innovate, adapt, and deliver.”

Insurance: The next 10 years
Mohsen Rahnama, Cihan Biyikoglu and Moe Khosravy of RMS look to 2029, consider the…
Times Square, New York City
Tag: CHESLEY WILLIAMS
Where Tsunami Warnings Are Etched in Stone
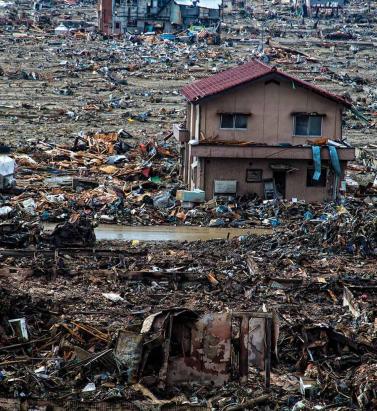
May 10, 2018EXPOSURE looks back at the 2011 Tohoku event and other significant events that have shaped scientific knowledge and understanding of earthquake risk incorporated into the RMS® Japan Earthquake and Tsunami HD Model Hundreds of ancient markers dot the coastline of Japan, some over 600 years old, as a reminder of the danger of tsunami. Today, a new project to construct a 12.5-meter-high seawall stretching nearly 400 kilometers along Japan’s northeast coast is another reminder. Japan is a highly seismically active country and was well prepared for earthquakes and tsunami ahead of the Tohoku Earthquake in 2011. It had strict building codes, protective tsunami barriers, early-warning systems and disaster-response plans. But it was the sheer magnitude, scale and devastation caused by the Tohoku Earthquake and Tsunami that made it stand out from the many thousands of earthquakes that had come before it in modern times. What had not been foreseen in government planning was that an earthquake of this magnitude could occur, nor that it could produce such a sizable tsunami. The Tohoku Earthquake was a magnitude 9.0 event — off the charts as far as the Japanese historical record for earthquakes was concerned. A violent change in the ocean bottom triggered an immense tsunami with waves of up to 40 meters that tore across the northeast coast of the main island of Honshu, traveling up to 10 kilometers inland in the Sendai area. The tsunami breached sea walls and claimed almost everything in its path, taking 16,000 lives (a further 2,000 remain missing, presumed dead) and causing economic losses of US$235 billion. However, while the historical record proved inadequate preparation for the Tohoku event, the geological record shows that events of that magnitude had occurred before records began, explains Mohsen Rahnama, chief risk modeling officer at RMS. “Since the Tohoku event, there’s been a shift … to moving further back in time using a more full consideration of the geological record” Mohsen Rahnama RMS “If you go back in the geological record to 869 in the Tohoku region, there is evidence for a potentially similarly scaled tsunami,” he explains. “Since the Tohoku event, there’s been a shift in the government assessments moving away from a focus on what happened historically to a more full consideration of the geological record.” The geological record, which includes tsunami deposits in coastal lakes and across the Sendai and Ishinomaki plains, shows there were large earthquakes and associated tsunami in A.D. 869, 1611 and 1896. The findings of this research point to the importance of having a fully probabilistic tsunami model at a very high resolution. Rahnama continues: “The Tohoku event really was the ‘perfect’ tsunami hitting the largest exposure concentration at risk to tsunami in Japan. The new RMS tsunami model for Japan includes tsunami events similar to and in a few cases larger than were observed in 2011. Because the exposure in the region is still being rebuilt, the model cannot produce tsunami events with this scale of loss in Tohoku at this time.” Incorporating Secondary Perils RMS has incorporated the lessons from the Tohoku Earthquake and other major earthquakes that have occurred within its model. There have been several large earthquakes around the world, and they all inform thinking about the largest events, particularly how the ground motions they produce are modeled. Crucially, it includes a fully probabilistic tsunami model that is integrated with the earthquake stochastic event set. On understanding strong ground shaking, information across events is utilized. For example, petrochemical facilities around the world are built with relatively consistent construction practices. This means that examination of the damage experienced by these types of facilities in Chile and Japan can inform the understanding of the performance of these facilities in other parts of the world with similar seismic hazard. The Maule Earthquake in Chile in 2010, the Canterbury sequence of earthquakes in New Zealand in 2010 and 2011, and the more recent Kumamoto Earthquakes in Japan in 2016, have added considerably to the data sets. Most notably they have informed scientific understanding of the nature of secondary earthquake perils, including tsunami, fire following earthquake, landslides and liquefaction. The 2016 Kumamoto Earthquake sequence triggered extensive landsliding. The sequence included five events in the range of magnitude 5.5 to 7.0 and caused severe damage in Kumamoto and Oita Prefectures from ground shaking, landsliding, liquefaction and fire following earthquake. “Liquefaction is in the model as a secondary peril. RMS has redesigned and recalibrated the liquefaction model for Japan. The new model directly calculates damage due to vertical deformation due to liquefaction processes,” says Chesley Williams, senior director, product management at RMS. “While the 1964 Niigata Earthquake with its tipped apartment buildings showed that liquefaction damages can be severe in Japan, on a countrywide basis the earthquake risk is driven by the shaking, tsunami and fire following, followed by liquefaction and landslide. For individual exposures, the key driver of the earthquake risk is very site specific, highlighting the importance of high-resolution modeling in Japan.” The RMS model accounts for the clustering of large events on the Nankai Trough. This is an important advancement as an examination of the historical record shows that events on the Nankai Trough have either occurred as full rupturing events (e.g., 1707 Hoei Earthquake) or as pairs of events (e.g., 1944 and 1946 and two events in 1854). This is different from aftershocks, explains Williams. “Clustered events are events on different sources that would have happened in the long-term earthquake record, and the occurrence of one event impacts the timing of the other events. This is a subtle but important distinction. We can model event clustering on the Nankai Trough due to the comprehensive event record informed by both historical events and the geologic record.” The Tohoku event resulted in insurance losses of US$30 billion to US$40 billion, the costliest earthquake event for the insurance industry in history. While the news media focused on the extreme tsunami, the largest proportion of the insurance claims emanated from damage wrought by the strong ground shaking. Interestingly, likely due to cultural constraints, only a relatively low amount of post-event loss amplification was observed. “In general for very large catastrophes, claims costs can exceed the normal cost of settlement due to a unique set of economic, social and operational factors,” says Williams. “Materials and labor become more expensive and claims leakage can be more of an issue, so there are a number of factors that kick in that are captured by the RMS post-event loss amplification modeling. The Japan model explicitly models post-event loss amplification but limits the impacts to be consistent with the observations in recent events in Japan.” Supply chain disruption and contingent business interruption were significant sources of loss following the Tohoku event. This was exacerbated by the level seven meltdown at the Fukushima nuclear power plant that resulted in evacuations, exclusion zones and rolling blackouts. “We sent reconnaissance teams to Japan after the event to understand the characteristics of damage and to undertake case studies for business interruption,” says Williams. “We visited large industrial facilities and talked to them about their downtime, their material requirement and their access to energy sources to better understand what had impacted their ability to get back up and running.” Recent events have re-emphasized that there are significant differences in business interruption by occupancy. “For example, a semiconductor facility is likely going to have a longer downtime than a cement factory,” says Williams. “The recent events have highlighted the impacts on business interruption for certain occupancies by damage to supply sources. These contingent business interruptions are complex, so examination of the case studies investigated in Japan were instrumental for informing the model.” Rebuilding in the seven years since the Tohoku Tsunami struck has been an exercise in resilient infrastructure. With nearly half a million people left homeless, there has been intense rebuilding to restore services, industry and residential property. US$12 billion has been spent on seawalls alone, replacing the 4-meter breakwaters with 12.5-meter-high tsunami barriers. An endless convoy of trucks has been moving topsoil from the hills to the coastline in order to raise the land by over 10 meters in places. Most cities have decided to elevate by several meters, with a focus on rebuilding commercial premises in exposed areas. Some towns have forbidden the construction of homes in flat areas nearest the coasts and relocated residents to higher ground. Tokyo-Yokohama: The World’s Most Exposed Metropolis The Japanese metropolis of Tokyo-Yokohama has the world’s greatest GDP at risk from natural catastrophes. Home to 38 million residents, it has potential for significant economic losses from multiple perils, but particularly earthquakes. According to Swiss Re it is the riskiest metropolitan area in the world. A combination of strict building codes, land use plans and disaster preparedness have significantly reduced the city’s vulnerability in recent decades. Despite the devastation caused by the tsunami, very few casualties (around 100) related to partial or complete building collapse resulting from ground shaking during the magnitude 9.0 Tohoku Earthquake.
