As COVID-19 has spread across the world and billions of people are on lockdown, EXPOSURE looks at how the latest scientific data can help insurers better model pandemic risk
The coronavirus disease 2019 (COVID-19) was declared a pandemic by the World Health Organization (WHO) on March 11, 2020. In a matter of months, it has expanded from the first reported cases in the city of Wuhan in Hubei province, China, to confirmed cases in over 200 countries around the globe.

At the time of writing, approximately one-third of the world’s population is in some form of lockdown, with movement and activities restricted in an effort to slow the disease’s spread. The transmissibility of COVID-19 is truly global, with even the extreme remoteness of location proving no barrier to its relentless progression as it reaches far-flung locations such as Papua New Guinea and Timor-Leste.
After declaring the event a global pandemic, Dr. Tedros Adhanom Ghebreyesus, WHO director general, said: “We have never before seen a pandemic sparked by a coronavirus. This is the first pandemic caused by a coronavirus. And we have never before seen a pandemic that can be controlled. … This is not just a public health crisis, it is a crisis that will touch every sector — so every sector and every individual must be involved in the fight.”
Ignoring the Near Misses
COVID-19 has been described as the biggest global catastrophe since World War II. Its impact on every part of our lives, from the mundane to the complex, will be profound, and its ramifications will be far-reaching and enduring.
On multiple levels, the coronavirus has caught the world off guard. So rapidly has it spread that initial response strategies, designed to slow its progress, were quickly reevaluated and more restrictive measures have been required to stem the tide. Yet, some are asking why many nations have been so flat-footed in their response.
To find a comparable pandemic event, it is necessary to look back over 100 years to the 1918 flu pandemic, also referred to as Spanish flu. While this is a considerable time gap, the interim period has witnessed multiple near misses that should have ensured countries remained primed for a potential pandemic.
“For very good reasons, people are categorizing COVID-19 as a game-changer. However, SARS in 2003 should have been a game-changer, MERS in 2012 should have been a game-changer, Ebola in 2014 should have been a game-changer. If you look back over the last decade alone, we have seen multiple near misses.”
Dr. Gordon Woo
RMS
However, as Dr. Gordon Woo, catastrophist at RMS, explains, such events have gone largely ignored. “For very good reasons, people are categorizing COVID-19 as a game-changer. However, SARS in 2003 should have been a game-changer, MERS in 2012 should have been a game-changer, Ebola in 2014 should have been a game-changer. If you look back over the last decade alone, we have seen multiple near misses.
“If you examine MERS, this had a mortality rate of approximately 30 percent — much greater than COVID-19 — yet fortunately it was not a highly transmissible virus. However, in South Korea a mutation saw its transmissibility rate surge to four chains of infection, which is why it had such a considerable impact on the country.”
While COVID-19 is caused by a novel virus and there is no preexisting immunity within the population, its genetic makeup shares 80 percent of the coronavirus genes that sparked the 2003 SARS outbreak. In fact, the virus is officially titled “severe acute respiratory syndrome coronavirus 2,” or “SARS-CoV-2.” However, the WHO refers to it by the name of the disease it causes, COVID-19, as calling it SARS could have “unintended consequences in terms of creating unnecessary fear for some populations, especially in Asia which was worst affected by the SARS outbreak in 2003.”
“Unfortunately, people do not respond to near misses,” Woo adds, “they only respond to events. And perhaps that is why we are where we are with this pandemic. The current event is well within the bounds of catastrophe modeling, or potentially a lot worse if the fatality ratio was in line with that of the SARS outbreak.
“When it comes to infectious diseases, we must learn from history. So, if we take SARS, rather than describing it as a unique event, we need to consider all the possible variants that could occur to ensure we are better able to forecast the type of event we are experiencing now.”
Within Model Parameters
A COVID-19-type event scenario is well within risk model parameters. The RMS® Infectious Diseases Model within its LifeRisks®platform incorporates a range of possible source infections, which includes coronavirus, and the company has been applying model analytics to forecast the potential development tracks of the current outbreak.
Launched in 2007, the Infectious Diseases Model was developed in response to the H5N1 virus. This pathogen exhibited a mortality rate of approximately 60 percent, triggering alarm bells across the life insurance sector and sparking demand for a means of modeling its potential portfolio impact. The model was designed to produce outputs specific to mortality and morbidity losses resulting from a major outbreak.
In 2006, H5N1 exhibited a mortality rate of approximately 60 percent, triggering alarm bells across the life insurance sector and sparking demand for a means of modeling its potential portfolio impact
The probabilistic model is built on two critical pillars. The first is modeling that accurately reflects both the science of infectious disease and the fundamental principles of epidemiology. The second is a software platform that allows firms to address questions based on their exposure and experience data.
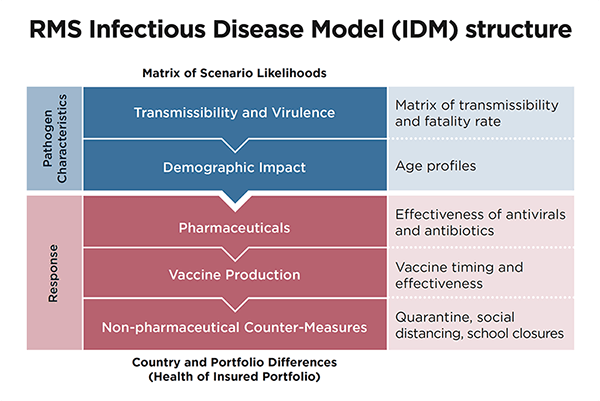
“It uses pathogen characteristics that include transmissibility and virulence to compartmentalize a pathological epidemiological model and estimate an abated mortality and morbidity rate for the outbreak,” explains Dr. Brice Jabo, medical epidemiologist at RMS.
“The next stage is to apply factors including demographics, vaccines and pharmaceutical and non-pharmaceutical interventions to the estimated rate. And finally, we adjust the results to reflect the specific differences in the overall health of the portfolio or the country to generate an accurate estimate of the potential morbidity and mortality losses.”
The model currently spans 59 countries, allowing for differences in government strategy, health care systems, vaccine treatment, demographics and population health to be applied to each territory when estimating pandemic morbidity and mortality losses.
Breaking Down the Virus
In the case of COVID-19, transmissibility — the average number of infections that result from an initial case — has been a critical model parameter. The virus has a relatively high level of transmissibility, with data showing that the average infection rate is in the region of 1.5-3.5 per initial infection.
However, while there is general consensus on this figure, establishing an estimate for the virus severity or virulence is more challenging, as Jabo explains: “Understanding the virulence of the disease enables you to assess the potential burden placed on the health care system. In the model, we therefore track the proportion of mild, severe, critical and fatal cases to establish whether the system will be able to cope with the outbreak. However, the challenge factor is that this figure is very dependent on the number of tests that are carried out in the particular country, as well as the eligibility criteria applied to conducting the tests.”
An effective way of generating more concrete numbers is to have a closed system, where everyone in a particular environment has a similar chance of contracting the disease and all individuals are tested. In the case of COVID-19 these closed systems have come in the form of cruise ships. In these contained environments, it has been possible to test all parties and track the infection and fatality rates accurately.
Another parameter tracked in the model is non-pharmaceutical intervention — those measures introduced in the absence of a vaccine to slow the progression of the disease and prevent health care systems from being overwhelmed. Suppression strategies are currently the most effective form of defense in the case of COVID-19. They are likely to be in place in many countries for a number of months as work continues on a vaccine.
“This is an example of a risk that is hugely dependent on government policy for how it develops,” says Woo. “In the case of China, we have seen how the stringent policies they introduced have worked to contain the first wave, as well as the actions taken in South Korea. There has been concerted effort across many parts of Southeast Asia, a region prone to infectious diseases, to carry out extensive testing, chase contacts and implement quarantine procedures, and these have so far proved successful in reducing the spread. The focus is now on other parts of the world such as Europe and the Americas as they implement measures to tackle the outbreak.”
The Infectious Diseases Model’s vaccine and pharmaceutical modifiers reflect improvements in vaccine production capacity, manufacturing techniques and the potential impact of antibacterial resistance. While an effective treatment is, at time of writing, still in development, this does allow users to conduct “what-if” scenarios.
“Model users can apply vaccine-related assumptions that they feel comfortable with,” Jabo says. “For example, they can predict potential losses based on a vaccine being available within two months that has an 80 percent effectiveness rate, or an antiviral treatment available in one month with a 60 percent rate.”
Data Upgrades
Various pathogens have different mortality and morbidity distributions. In the case of COVID-19, evidence to date suggests that the highest levels of mortality from the virus occur in the 60-plus age range, with fatality levels declining significantly below this point. However, recent advances in data relating to immunity levels has greatly increased our understanding of the specific age range exposed to a particular virus.
“Recent scientific findings from data arising from two major flu viruses, H5N1 and A/H7N9, have had a significant impact on our understanding of vulnerability,” explains Woo. “The studies have revealed that the primary age range of vulnerability to a flu virus is dependent upon the first flu that you were exposed to as a child.
“There are two major flu groups to which everyone would have had some level of exposure at some stage in their childhood. That exposure would depend on which flu virus was dominant at the time they were born, influencing their level of immunity and which type of virus they are more susceptible to in the future. This is critical information in understanding virus spread and we have adapted the age profile vulnerability component of our model to reflect this.”
Recent model upgrades have also allowed for the application of detailed information on population health, as Jabo explains: “Preexisting conditions can increase the risk of infection and death, as COVID-19 is demonstrating. Our model includes a parameter that accounts for the underlying health of the population at the country, state or portfolio level.
“The information to date shows that people with co-morbidities such as hypertension, diabetes and cardiovascular disease are at a higher risk of death from COVID-19. It is possible, based on this data, to apply the distribution of these co-morbidities to a particular geography or portfolio, adjusting the outputs based on where our data shows high levels of these conditions.”
Predictive Analytics
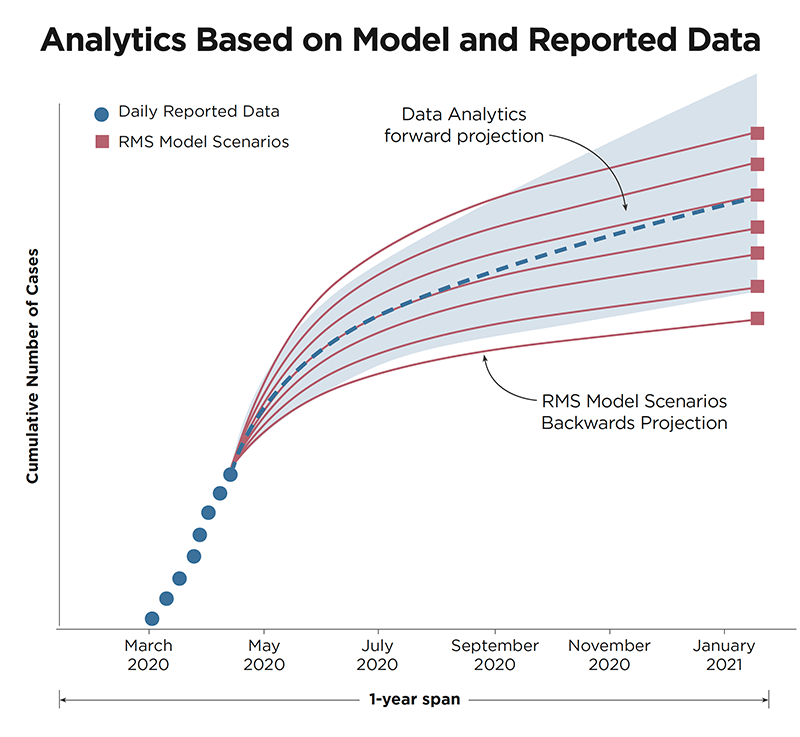
The RMS Infectious Diseases Model is designed to estimate pandemic loss for a 12-month period. However, to enable users to assess the potential impact of the current pandemic in real time, RMS has developed a hybrid version that combines the model pandemic scenarios with the number of cases reported.
“Using the daily cases numbers issued by each country,” says Jabo, “we project forward from that data, while simultaneously projecting backward from the RMS scenarios. Using this hybrid approach, it allows us to provide a time-dependent estimate for COVID-19. In effect, we are creating a holistic alignment of observed data coupled with RMS data to provide our clients with a way to understand how the evolution of the pandemic is progressing in real time.”
Aligning the observed data with the model parameters makes the selection of proper model scenarios more plausible. The forward and backward projections, as illustrated, not only allow for short-term projections, but also forms part of model validation and enables users to derive predictive analytics to support their portfolio analysis.
“Staying up to date with this dynamic event is vital,” Jabo concludes, “because the impact of the myriad government policies and measures in place will result in different potential scenarios, and that is exactly what we are seeing happening.”


