
The Moody's insurance solutions blog
Get expert perspectives as our team weighs in on the latest events, topics, and insights to help you demystify risk and deepen resilience.


Snaefellsnes Peninsula, Iceland
Tag: U.S. flood
Filter by:

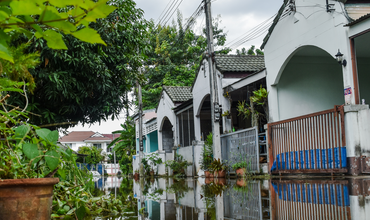
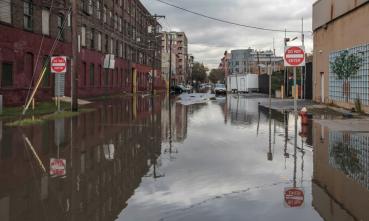
Urbanization Under Pressure: Recent Flood Events...

During an average September, New York City (NYC) gets 4.3 inches (110 millimeters) of rain for the entire month. In just a few hours during…

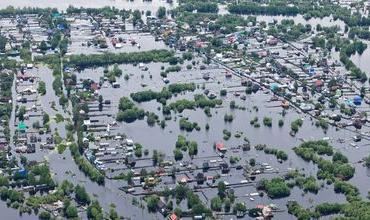
Moody’s RMS Global Flood Data and Maps: Enhancem...

It has long been a Moody’s RMS goal to help clients assess flood risk globally, a goal realized in the fall of 2021 with the first version of…
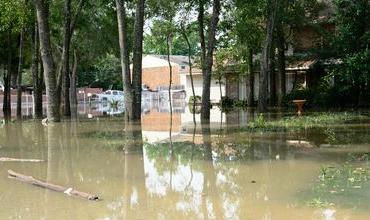
Lessons from Hurricane Ida: How Catastrophe Mode...
Flood remains the most underinsured climate risk in the U.S. Consulting firm Milliman estimates that just 4 percent of U.S. homeowners have…
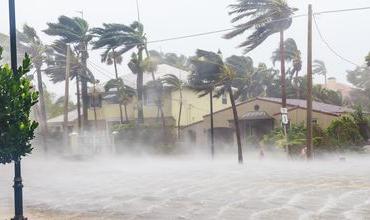
Decrease your Susceptibility to Poor Insured Dec...
Originally appeared in PropertyCasual360 The loss response of a location exposed to a given peril can vary significantly, even when exposed…
Four Influences on the FEMA 1 Percent Probabilit...

Where did the 1 percent probability flood line (100-year flood), the baseline metric for the U.S. flood insurance market, originate from? Why…
A Toe in the Water: Trading Risk Panel Discusses...

With positive changes under way to improve both public and private carrier participation across the U.S. flood market, many are looking to…
