Four Influences on the FEMA 1 Percent Probability Flood Line – and Why the Industry Needs an Independent View
Robert Muir-WoodSeptember 09, 2021
Where did the 1 percent probability flood line (100-year flood), the baseline metric for the U.S. flood insurance market, originate from? Why is it so important?
I encourage you to watch my webinar for the RMS® Season of Flood series as I discuss the history of the 100-year flood event and the importance and influence of this metric. As I detail in this blog, there are many factors that determine how the 100-year flood event line is drawn. In the webinar, I also analyze the key differences between the Federal Emergency Management Agency (FEMA) views and an independent, modeled RMS view, and how these views impact your business now and in the future. But how did it all start?
100-Year Flood and Special Flood Hazard Areas (SFHAs)
In 1968, the National Flood Insurance Program (NFIP) was launched, and it adopted a U.S. Water Resources Council recommendation from 1967 for the “100-year flood” to be the base standard for flood risk. A 100-year flood is a flood event that has a 1 percent probability of occurring or being exceeded in any given year. The special flood hazard areas (SFHAs) defined by FEMA are areas within the 1 percent probability or 100-year flood line.
NFIP insurance became mandatory in 1973 for all those within a SFHA who took out a federally backed mortgage – and policy numbers grew. This saw the location and height of the 100-year flood grow in importance, becoming a dividing line between those who were or were not required to purchase flood insurance. It affected new construction, with a stipulation to have the ground floor above the 1 percent “base flood elevation” to be considered outside of the SFHA.
Locating the 1 percent annual probability flood line, critical for the NFIP and the wider market, can be subject to significant uncertainty. The reasoning behind the definition of SFHAs can be confusing, and the process of revising the flood maps is complex and convoluted. Here are four factors that have been seen to bias the location of the SFHA and reasons why an independent view is beneficial.
1. Many maps are out of date
Updating community flood hazard maps is essential work, providing the technical underpinning for the NFIP. In 1994, Congress mandated that FEMA should update flood insurance rate maps (FIRMs) every five years for the over 22,000 participating jurisdictions. But funding is a battle. Andrew Martin, risk analysis branch chief for FEMA region 2 (covering states such as New York and New Jersey), has claimed it was “financially impossible” to do this, with the latest flood information not being included in many maps.
2. Maps are “actuarial” and backward-looking in a time of climate change
FEMA’s maps are backward-looking, based on historical flooding and development information. They don’t set out to anticipate future trends, nor attempt to include the impact on flooding from the effects of climate change that have already occurred. As a result, one estimate claimed that 41 million people – rather than the 13 million people shown in FEMA flood maps – live within the 100-year floodplain.
3. Revisions to SFHA may overreact to extreme long-return-period storms
Whenever there is a very extreme flood event, FEMA tends to draw the “1 percent flood line” at the height of the latest storm surge. Examples include the storm surges from Hurricane Katrina in 2005 and Superstorm Sandy in 2012, both widely considered to have reached water levels beyond the 1-in-100-year level.
A 2006 report on Hurricane Katrina saw FEMA admit that flood levels had far exceeded the current design flood elevations along a significant proportion of the Gulf Coast of Mississippi, being well beyond the SFHA indicated on the latest FEMA flood maps (FIRMs) by up to 15 feet (4.6 meters). It updated the flood frequency analysis “to include tide and storm surge still water” data for the past 25-plus years, but by far the most important new tail event was the water levels experienced in Katrina.
4) Resistance to revisions in the SFHA
Being located within SFHAs affect home values. One study found that values decrease by more than 11 percent when a property is assigned into an SFHA flood zone and that property values do not rebound when flood zone status is removed.
Shifting the Flood Line
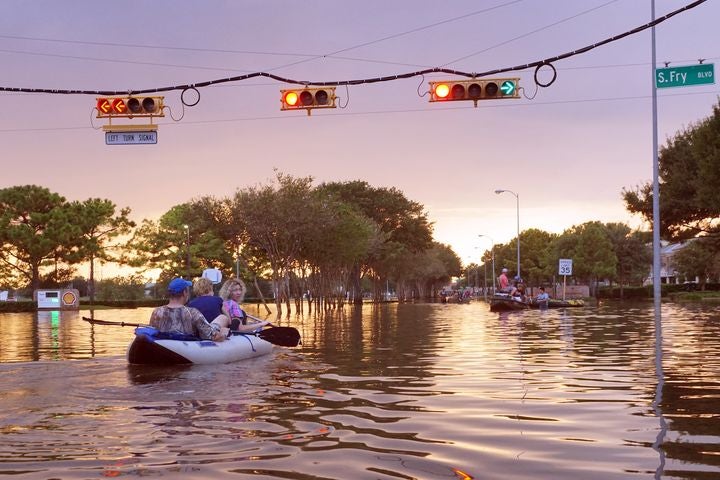
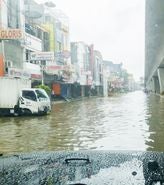
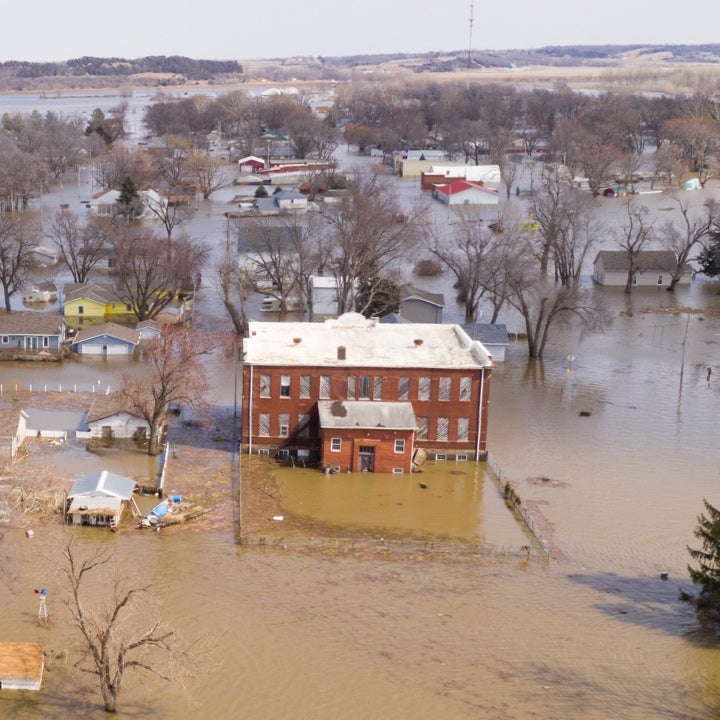
Flooding in Houston after Hurricane Harvey in 2017
In addition to the technical and logistical challenges of establishing the flood line, property owners will challenge new SFHAs. Individuals, businesses, and developers will spend thousands of dollars to hire land surveyors or engineering firms to file a Letter of Map Amendments (LOMA) for their local community. While appeals can be costly, they are also largely successful. FEMA cites an 89 percent success rate for the 30,000 flood map amendments sought annually.
Homeowners due to be rezoned into SFHAs will also appeal. New FEMA flood maps are presented to communities who then have 90 days to make challenges. In a recent study, researchers used FEMA data from 2013–17 for 255 U.S. counties for which there were matching preliminary and initial regulatory maps.
From the preliminary maps to the initial regulatory maps, the net reduction in SFHAs for the study area was 41.3 square miles (107.2 square kilometers) and included losing 21,806 buildings. At the census tract scale, coastal flood zones (“V” zones) were found to be twice as likely to have buildings change their flood hazard status. Non-mortgaged homeowners, those with higher per capita income or in higher home-value areas, were more successful at resisting new zonation into the SFHA, suggesting that communities have greater resources to lodge formal appeals or revisions.
Not everyone within an SFHA must buy insurance, and there is maladaptation because only mortgaged properties are mandated. This tends to impart a false sense of security, says Rob Moore, senior water policy analyst at the Natural Resources Defense Council: “That’s why these flood maps lead to such risky behavior and have such tragic consequences.”
And base flood elevations linked to SFHAs encourage a great concentration of development just above this elevation, leading to criticalities in loss generation. A lot of loss happens to those without insurance, located beyond the FIRMs. Where SFHAs understate the risk, great concentrations of exposure will be impacted more frequently than 1 percent probability each year.
As evidence of this, Hurricane Harvey damaged more than 204,000 homes and apartment buildings in Harris County. Almost three-quarters of them were beyond the SFHA, leaving tens of thousands of homeowners uninsured and unprepared. More than 55 percent of the homes damaged during Houston’s Tax Day Storm in 2016 sat outside FEMA’s 500-year floodplain, as did more than one-third of homes during the Memorial Day Floods in 2015.
Managing Future Flood Risk
The NFIP does not have adequate reserves to fund tail event losses, and planned risk-based pricing – proposed to be introduced in late 2021 – will not correct the problem unless the SFHA is relocated for today’s flood hazard. But with all these highlighted problems in locating the official SFHA, the importance of having a completely independent and scientific perspective on this boundary is clear. It must be uninfluenced by more affluent homeowners disputing map revisions or by FEMA using the opportunity of an extreme storm to maximize the elevation of new buildings.
More than 50 years after the decision to represent flood hazard with a single line on a map, we now need a more nuanced and detailed perspective on how flood exceedance probabilities are represented and mapped, which advanced risk modeling such as the RMS® U.S. Inland Flood HD Model provides. There will always be uncertainty where the 1 percent flood hazard boundary should be drawn, but sources of bias should be avoided. A risk-taker needs to evaluate the significance of this uncertainty when quantifying the risk.
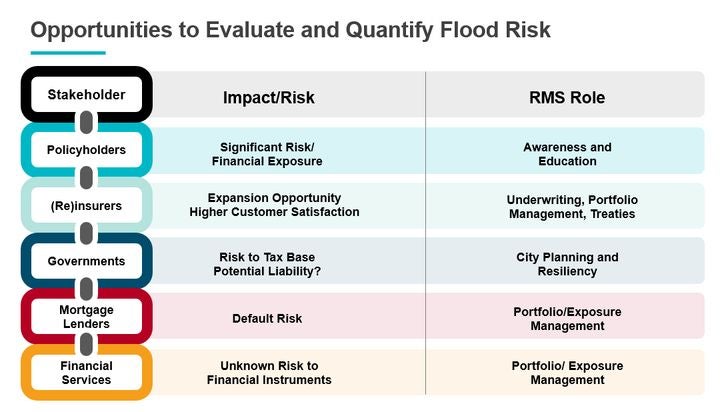
The image above outlines the role that RMS can offer for a wide range of stakeholders impacted by a property that may sit outside the FEMA flood zone but is still at risk of flooding for a 1-in-100-year event. As you can see, this is not just an issue for homeowners, but can have dramatic impact on stakeholders in the entire value chain, including governments, mortgage lenders, and financial services firms.
Robert Muir-Wood works to enhance approaches to natural catastrophe modeling, identify models for new areas of risk, and explore expanded applications for catastrophe modeling. Robert has more than 25 years of experience developing probabilistic catastrophe models. He was lead author for the 2007 IPCC Fourth Assessment Report and 2011 IPCC Special Report on Extremes, and is Chair of the OECD panel on the Financial Consequences of Large Scale Catastrophes.
He is the author of seven books, most recently: ‘The Cure for Catastrophe: How we can Stop Manufacturing Natural Disasters’. He has also written numerous research papers and articles in scientific and industry publications as well as frequent blogs. He holds a degree in natural sciences and a PhD both from Cambridge University and is a Visiting Professor at the Institute for Risk and Disaster Reduction at University College London.