The U.S. has experienced a record number of tornadoes in the first three months of 2023 according to preliminary data from the National Weather Service Storm Prediction Center (NWS SPC), delivering an active start to the U.S. severe convective storm season
In this blog, we review the 2023 season to date, recap the largest tornado outbreaks, the causes of this active start to the year, potential loss implications, and examine what the remainder of the severe convective storm season might have in store.
A Record Tornadic Start to 2023
Looking at the preliminary data released by the NWS SPC, January saw the third-highest number of tornadoes watches and confirmed tornadoes on record.
Extending to both January and February 2023, this period represented the fourth-highest number of confirmed tornadoes on record, and in March, multiple rounds of severe outbreaks claimed the lives of at least 47 people, twice the fatality count for the whole of 2022, which totaled 23 people.
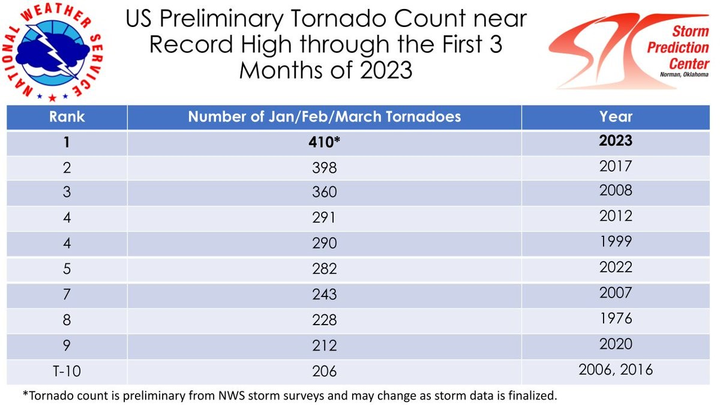
For the first three months of the year, 410 tornadoes were observed in total, eclipsing the record set just six years ago in 2017. This total remains preliminary, as NWS storm surveys continue and may change as storm data is finalized.
Figure 1: U.S. preliminary tornado count for January to March 2023. Source: National Weather Service Storm Prediction Center.
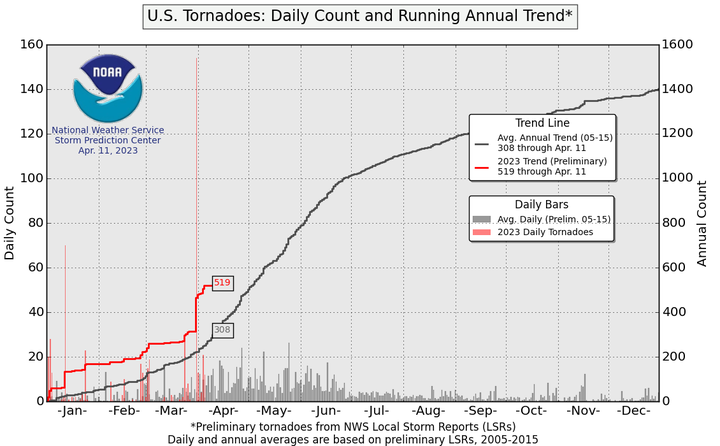
Moving into April, the total number of preliminary tornado local storm reports (LSRs) as of April 15 stood at 532, around 52 percent above the average (348) for the time of year. Similarly, the number of preliminary straight-line wind LSRs stands at 2,727, around 68 percent above the average (1,619).
Figure 2: U.S. preliminary tornado local storm reports (LSRs) daily count and running cumulative annual total and 2005–15 average as of April 11, 2023. Source: National Weather Service Storm Prediction Center.
Multiple Outbreaks
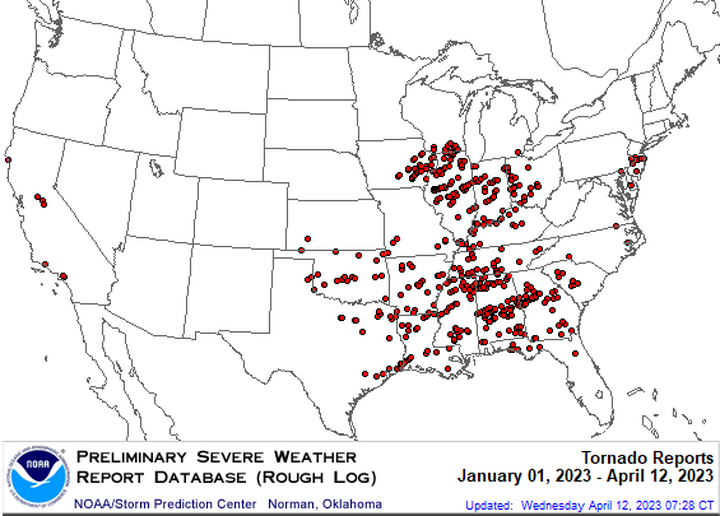
What is driving these record event numbers? The record tornado count is the result of several multi-day severe convective storm outbreaks across parts of the South, Southeast, and Midwest U.S., most notably in late March and the first half of April.
Figure 3: U.S. preliminary tornado local storm reports (LSRs) as of April 12, 2023. Source: National Weather Service Storm Prediction Center.
The most notable outbreak to date this year was the deadly and now historic outbreak that impacted large portions of the Midwest, South, and East U.S. on March 31 and April 1.
Six Days of Destruction
According to the NWS SPC, March 31 had the fourth-most confirmed tornadoes (122) in a convective day (12:00 UTC to 12:00 UTC the following day) on record.
This total is only beaten by the Super Outbreaks of April 27, 2011 (173 tornadoes) and April 3, 1974 (143 tornadoes) and the Midwest derecho and tornado outbreak of December 15, 2011 (125 tornadoes).
A long-track EF3 (Enhanced Fujita scale) tornado on March 31 and April 1 with estimated peak winds of 165 miles per hour (266 km/h) caused the worst of the catastrophic damage in Arkansas across northern sections of the Little Rock metropolitan area.
An EF4 tornado with estimated peak winds of 170 miles per hour (274 km/h) was confirmed near Keota, Iowa, and an additional nine EF3 tornadoes were confirmed across Alabama, Arkansas, Tennessee, Delaware, Illinois, and Indiana.
Another severe weather outbreak affected the Midwest, Mississippi Valley, and Great Lakes regions on April 4–5 with significant tornado damage in Missouri.
The worst damage occurred in Bollinger County, Missouri, where an EF2 tornado damaged or destroyed at least 87 structures and killed five people.
Less significant tornado damage also occurred in Iowa, Illinois, Indiana, Kentucky, Ohio, and Texas. Straight-line wind and hail damage to homes, businesses, and vehicles was also reported in Illinois, Missouri, Iowa, Kansas, Arkansas, and Kentucky.
Between March 31 and April 5, more than 20 states were affected by these outbreaks. Many of the most severely hit areas are still cleaning up and recovering as the climatological peak of the severe convective storm season nears.
Is the Mild Winter and Pacific Atmospheric Rivers to Blame?
This year’s active start to the season can, at least in part, be attributed to the milder conditions experienced across much of the U.S. since the start of 2023.
Warmer-than-usual winters often enhance atmospheric instability (compared to normal for the time of year), which is a key ingredient needed to produce severe convective storms. With fewer cold fronts penetrating across the U.S. Gulf States, the Gulf of Mexico’s warm and moist air has not been kept at bay and has interacted with strong surface cyclones tracking east across the U.S.
In addition, the steady stream of atmospheric rivers that have pummeled the Western U.S. this winter with downpours and windy weather have also played their part.
These systems have generally maintained their intensity as they’ve tracked east and produced strong surface cyclones that have interacted with the jet stream and contributed to heightened severe weather potential across the Midwest, South, and Southeast U.S.
A Record Quarter One Loss?
With the record-breaking number of reports and the wide geographic spread of U.S. severe convective storm activity experienced during the first quarter of 2023, insurers are starting to ask questions about how much will this all cost.
Considering the historical first quarter severe weather frequency experienced so far, 2017 may be an analogous year to 2023 in terms of the amount of activity as well as the locations affected.
Though compared to 2017, this year is accounting for greater losses as a result of stronger to violent tornado activity (EF3 and above tornadoes). In 2017, there were ten EF3 and above tornadoes (including one EF4 tornado) that affected portions of Georgia, Illinois, Indiana, Louisiana, Mississippi, and Missouri.
In contrast, through March 2023, there are at least 17 EF3 and above tornadoes recorded (including two EF4 tornadoes), affecting the states of Alabama, Arkansas, Georgia, Illinois, Indiana, Iowa, Mississippi, Tennessee, and Texas.
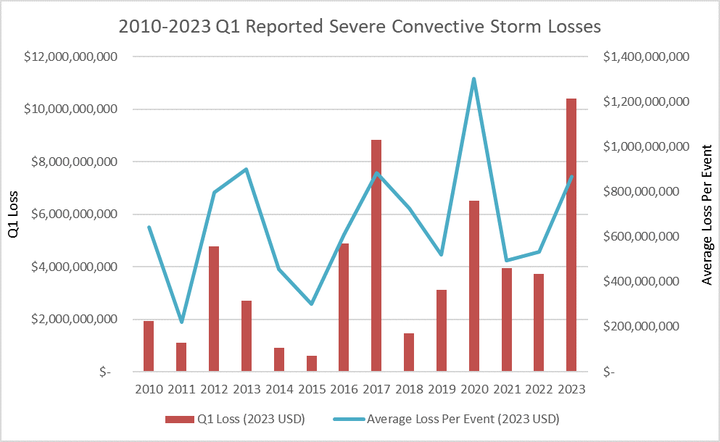
Reported losses in the first quarter of 2017 eclipsed US$8.83 billion (2023 U.S. dollars) from 10 separate severe convective storm events, yielding an average loss of US$883 million per event, as shown in the graphic below.
Figure 4: Reported Q1 insured losses from 2010 to 2022 and average per event. Graphic Source: Moody’s RMS
Losses for the first quarter of 2023 surpassed the first quarter total of 2017 by a staggering 18 percent, with quarter one 2023 losses eclipsing the US$10 billion mark. However, as of mid-April 2023, the average loss per event for the first quarter of 2023 of US$867 million was slightly lower than 2017’s US$883 million per event.
The losses for the first quarter of 2023 continue to develop, so the loss average per event may still rise in the coming months.
Is Tornado Alley Shifting?
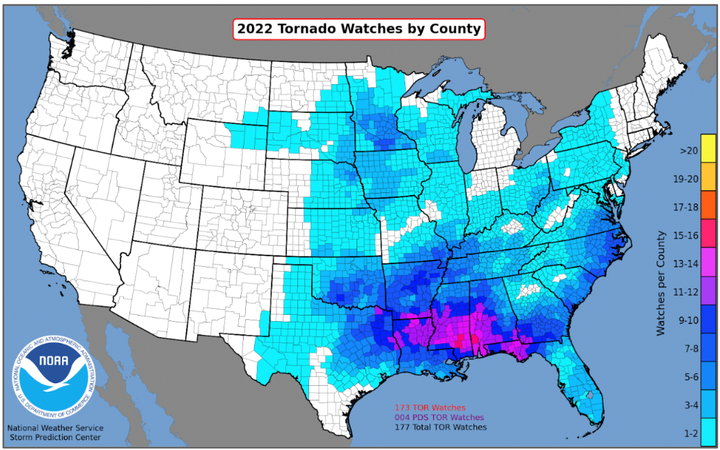
This year’s activity to date, akin to the activity observed during 2022 (see figure below), is consistent with an emerging trend of more tornadic events in the Southeast U.S.
Studies such as Gensini and Brooks (2018) have found a notable decrease in both the total number of tornadoes and days with tornadoes in the traditional ‘Tornado Alley’ area in the central and southern Great Plains.
The study noted an increase in tornado numbers in the Midwest and Southeast U.S., an area known as ‘Dixie Alley’; many of this year’s significant and impactful tornadoes have occurred in this region along with the Midwest, while the traditional Tornado Alley region has been less active.
Figure 5: 2022 Tornado Watch frequency by County, indicating the greatest number of tornado watches were issued in the Dixie Alley area of the Southeast and Midwest U.S. Source: National Weather Service Storm Prediction Center.
What’s to Come in 2023?
Above-normal surface temperatures and slightly increased rainfall totals are anticipated across much of the South and Southeast U.S. from April to June. Given that the traditional peak period for severe convective storms across the U.S. is typically April through June, additional rounds of severe weather are certainly likely over the coming weeks and months.
However, the specific environmental factors that produce severe convective outbreaks are difficult to forecast on longer timescales and can only be reliably forecast in the short- to medium-range, so stay tuned to the latest forecasts for the potential for additional impactful tornadic events in the coming months.
As always, Moody’s RMS Event Response is ensuring Moody’s RMS clients are well informed of severe convective storm outbreaks with regular updates clients on the Support Center.
Follow Moody’s RMS social media channels on Twitter and LinkedIn for updates.
Based in London, James is an Assistant Director within Moody's RMS Event Response team, supporting real-time event response operations and assisting on various event response projects. James holds a bachelor’s degree in Physical Geography and Geology from the University of Southampton and a master’s degree in Applied Meteorology from the University of Reading.
Steve is a seasoned meteorologist and Senior Product Manager at RMS, involved in the catastrophe modeling industry for over 20 years and in the meteorological community for over three decades, with a track record of successful career development as an operational forecaster, research meteorologist, and catastrophe model developer.
Joining RMS in 2020, Steve provides in-depth knowledge of some of the most complicated natural catastrophe perils and oversees the development of the RMS North America Severe Convective Storm and RMS North America Winterstorm models, working closely with clients and across various RMS teams to deliver and execute the vision, strategy, and roadmap for these models.
Steve holds a degree in Meteorology from Northland College and is a member of the American Meteorological Society, the International Society of Catastrophe Managers, and the National Weather Service SKYWARN Storm Spotter Program.
His meteorological forecasting insights were accredited to saving lives ahead of and during the May 1999 Oklahoma and Kansas tornado outbreak and in 2004, with Hurricane Ivan in the Cayman Islands.
This has led to keynote speaking engagements within various worldwide government agencies to talk about global urbanization and its effects on the climate and natural peril frequency and severity in 2002, 2005, 2006, 2008, 2012, and 2017.