10 Years After Superstorm Sandy: The Paradox of More Flooding and Less Insurance
Firas SalehOctober 27, 2022
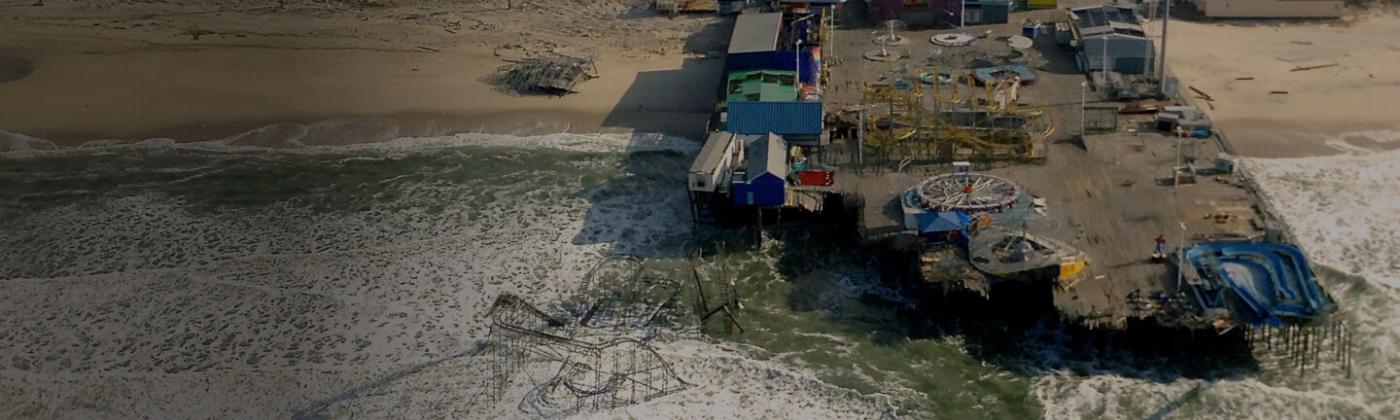
It has been 10 years since Hurricane Sandy, a.k.a. Superstorm Sandy, made its second landfall as a post-tropical storm in Brigantine, a city just north of Atlantic City, New Jersey, at around 8 p.m. local time on October 29, 2012. It remains one of the most destructive, deadly, and costly natural catastrophes in U.S. history.
Sandy made its first landfall in Jamaica as a Category 1 hurricane on October 24 and it strengthened to a Category 3 hurricane as it made landfall in Cuba a day later, before weakening into a tropical storm. The system then underwent a complex evolution over the Bahamas and grew significantly, and it continued to grow despite previously weakening into a tropical storm.
This evolution saw Sandy grow both in size and in strength to reach Category 2 status early on October 29, with storm-force winds extending over 1,150 miles (1,850 kilometers). Powered by the high-altitude jet stream, a “blocking high” forced the hurricane vortex to suddenly make a sharp turn left.
On landfall, wind gusts between 85 and 95 miles per hour (137 and 153 kilometers per hour) hit the New Jersey coast. The timing was also very unfortunate as the hurricane struck at the local high tide, and a night with a full moon led to a higher-than-normal spring tide.
An extra 9 feet (2.7 meters) of storm surge added to this extra high tide. As Sandy made its final landfall along the coast of southern New Jersey, it produced record-breaking waves, devastating storm surge, and floods in New York and New Jersey.
The economic damage according to the National Oceanic and Atmospheric Administration (NOAA) was approximately US$82 billion (adjusted for the consumer price index), and the human cost was at least 159 deaths in the U.S. (72 direct, 87 indirect).
Sandy's impact on major metropolitan areas caused widespread interruption to businesses and to critical water and power services. Sandy also caused the New York Stock Exchange to close for two consecutive business days, which last happened in 1888 due to a major winter storm.
Tail risk events such as Sandy are often a wake-up call to the insurance marketplace, as citizens are directly confronted with the consequences of extreme natural catastrophes. Such events typically lead to more insurance take-up – but, strangely, this hasn’t been the case for Sandy.
This blog will discuss some of the factors behind the declining flood insurance take-up rates and how this gap is putting more exposure at risk of uninsured flood losses.
Less Insurance in Sandy’s Hardest-Hit Areas
When Superstorm Sandy made landfall in 2012, there were 169,000 National Flood Insurance Program (NFIP) policies in place in New York and 236,000 NFIP policies in New Jersey. Sandy-related filed claims totaled 57,000 in New York and 74,000 in New Jersey. With an average claim payment at the time of US$61,000, the NFIP paid more than US$8 billion in just these two states.
Fast-forward 10 years, and as of August 2022, there are 169,280 NFIP policies in New York and 198,422 NFIP policies in New Jersey. While the number of NFIP policies since Sandy remains flat in New York, there is a 15 percent decline in NFIP policies in New Jersey.
Reports show that 12,000 New Jersey policyholders dropped their flood insurance after the implementation of a new pricing methodology, called Risk Rating 2.0, in October 2021. A decline of 6 percent in NFIP policies between September 2021 and June 2022 has been generally attributed to Risk Rating 2.0, which raised rates and tightened affordability.
The Flood Insurance Landscape in NYC
Flood is considered one of the most frequent natural hazards impacting New York City, which has more than 500 miles (800 kilometers) of waterfront, high-value exposure, and low-lying areas. Sources of flooding include storm surge, rainfall from tropical and non-tropical storms, nor’easters, chronic high tide (nuisance flooding), and compound flooding from two or more flood sources.
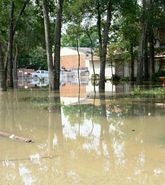
These flood events have a varying degree of impact on lives, property, infrastructure, and the economy, as witnessed during Superstorm Sandy and more recently as a result of pluvial flooding from the remnants of Hurricane Ida in September 2021.
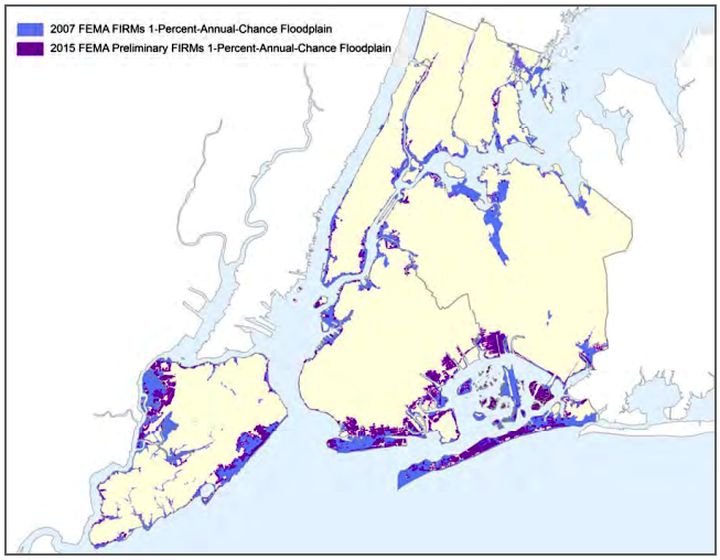
After Sandy, the Federal Emergency Management Agency (FEMA) released its 2015 preliminary Flood Insurance Rate Maps (FIRMs)as part of a citywide update for New York. This update reflected the current flood hazard risk and defined the Special Flood Hazard Areas (SFHAs) zones to encompass areas vulnerable to flooding at the 100- and 500-year level or with a 1 percent and 0.2 percent annual chance of flooding (these terminologies are used interchangeably).
The preliminary FIRMs increased the New York City floodplain areas by 42 percent compared to the 2007 FIRMs (Figure 1). Subsequently, the number of New York City residents in the updated floodplain increased from 218,000 to 400,000 (based on the 2010 population).
New York City then appealed the preliminary FIRMs, arguing erroneous assumptions and prohibitive cost implications for homeowner flood insurance, as FEMA had moved homes into the 100-year SFHA. In October 2016, FEMA announced that New York City had won its appeal on the preliminary FIRMs and agreed to revise New York City’s flood maps.
Out-of-Date FIRMs
Until the updated FEMA flood maps are issued, New York City’s effective FIRMs are not reflective of the current risk. Ten years after Sandy, these outdated FIRMs from 2007 continue to guide the requirement to purchase flood insurance with a mortgage from a federally regulated lender, which is putting exposure at risk where it is known to be vulnerable to flooding.
The 2015 preliminary FIRMs are being used to guide New York City’s building code and floodproofing, except where the effective FIRMs are more restrictive. This is a source of considerable confusion for homeowners.
Certain existing properties devastated by Sandy continue to have no flood insurance, while new or rebuilt neighboring homes are required to follow building codes based on the 2015 preliminary FIRMs appealed by the city.
Regarding exposure, at the same time, waterfront developments are steadily increasing. A 2022 study by the New York City comptroller reports the market rate value of real estate within the 100-year flood zone has increased to over US$176 billion, representing a 44 percent increase since Superstorm Sandy.
The study also suggests that rising tides and more frequent storms will put exposure upward of US$242 billion (in current market value) at risk of coastal flooding by the 2050s, a 38 percent increase in value from today.
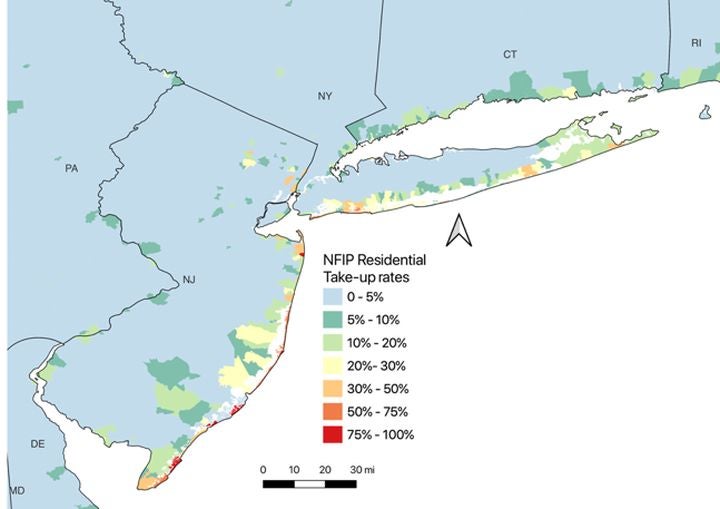
Figure 2: RMS NFIP residential flood insurance take-up rate map showing low take-up in inland areas
It is important to highlight that FEMA FIRM boundaries do not include any representation of pluvial flooding. This is why we observe single-digit NFIP take-up rates in inland areas vulnerable to pluvial flooding, as seen in the RMS® NFIP Industry Exposure Database (Figure 2). Remnants of Hurricane Ida last year highlighted this flood protection gap, as addressed in this RMS blog.
Rising Flood Loss
There is no way to predict where and when a new hurricane will impact the regions discussed in this blog. However, the likelihood of uninsured flood loss has only increased because of a lack of accurate risk mapping and macro-trends, including the evolving concentration of exposure, continual development, population dynamics, change in frequency and intensity of storms, and sea level rise.
Again, the pluvial flooding in New York and New Jersey from remnants of Hurricane Ida last year is another reminder of how climate risk is multifaceted and complex.
While flood risk is evolving at accelerating rates, the FEMA flood zones that drive flood insurance requirements remain static in New York City. This is creating serious challenges for a wide spectrum of stakeholders including homeowners, insurers, mortgage lenders, and state and local governments.
Many local authorities have limited resources and are struggling to understand their flood risk. In turn, they have difficulty responding to their residents’ questions on changes to flood insurance premiums or whether a resident needs flood insurance.
A climate shock similar to Sandy could trigger insolvency risk in certain towns if there are no adequate preparedness and resiliency plans in place. New York City has the largest municipal budget in the U.S., with well-resourced departments that have the technical capabilities to implement flood mitigation and resilience strategies – but other cities or counties do not have such extensive in-house capabilities.
All stakeholders need to understand and prepare for flood risk. For insurers, there is plenty of opportunity to open their book of flood insurance business and leverage innovative climate modeling products empowered by state-of-the-art catastrophe models and data analytics.
The RMS suite of climate products is already helping stakeholders adequately reflect the impact of community- or property-specific flood mitigation measures by reducing premiums, offering increased limits, and developing novel insurance products.
The RMS® U.S. Inland Flood HD Model along with the proprietary high-resolution RMS industry exposure databases (IEDs), which represent insured flood exposure, and the RMS economic exposure databases (EEDs) together provide advanced risk modeling to quantify the insurance gap and identify growth opportunities for books of business.
Stakeholders can ensure that the regions impacted by Sandy some 10 years ago understand and can mitigate the risk through effective flood insurance coverage.
Dr. Firas Saleh joined Moody's as Director of Model Product Management in 2020. He oversees Moody's RMS U.S. Inland Flood and Wildfire HD Models, working closely with clients and across Moody's functional teams on defining and executing the vision, strategy, and roadmap for Moody's RMS flood and wildfire products.
Firas holds a Ph.D. in Geosciences and Natural Resources from the University of Pierre et Marie Curie - Paris VI (Sorbonne Universités), France. He has a strong professional track record in the U.S. Federal Government, industry, and academia.
During his academic tenure at different institutes around the world, including the Paris School of Mines (Mines Paris-Tech), New Jersey Institute of Technology, and Stevens Institute of Technology, his research was focused on implementing quantitative forward-looking analytics to assess climate and weather-related physical risk and impacts on critical infrastructure resilience.
At Stevens, he was part of the team that pioneered and productized the coastal-inland operational flood forecast systems for Port Authority of NY-NJ critical facilities (JFK, LaGuardia, Newark, and Teterboro Airports) and NJ Transit. He has co-authored more than 30 publications in peer-reviewed articles, conference proceedings, and book chapters.
He also served as a Senior Commercial Specialist at the U.S. Embassy in Baghdad and Amman, the U.S. Commercial Service, and the U.S. Department of State. He received the U.S. Department of Commerce Gold Medal Award for his distinguished federal service in fostering collaboration between government and industry concerning water and construction. The Gold Medal is the highest honorary award from the U.S. Secretary of Commerce.