In February at the Reinsurance Association of America (RAA) annual catastrophe risk management conference (RAA Conference 2020), I heard John Phipps, the newly-named deputy chief of the USDA Forest Service State and Private Forestry programs speak about the state of the forests in the U.S. and the capabilities of the U.S. Forestry Service to deal with wildfires.
Mr. Phipps stated that 98% of wildfires can be extinguished using existing suppression resources. These resources are significant – the annual budget of forest fighter services is $1.2 billion. By any standard, 98% success sounds very good! But it’s what happens in the remaining 2% of fires that matters. These last 2% are the most dangerous in terms of occurrence during extreme weather conditions – extreme dryness, extreme temperature – and most importantly – extreme wind speed. When these conditions happen, it is easy for firefighter brigades to be overwhelmed – especially when combined with many other non-weather factors such as logistical issues, other competing fires, or lack of experience with these extreme events.
These events were responsible for much of the big losses during the last 10 years. And against these extreme weather conditions, fire fighters can do little more than get people out of the way and wait for the weather to turn. From the perspective of loss of life and property, these are the fires we really need to worry about because they are most likely to cause what is called an urban conflagration.
An urban conflagration is a phenomenon where wildfire spreads rapidly from building to building in an urban area in the absence of significant burnable vegetation. It needs extreme weather conditions to occur – the same conditions that occur in the 2% of fires that cannot be suppressed. The Tubbs fire from 2017 and Oakland Hills fire in 1991 are examples of fires where urban conflagration occurred.
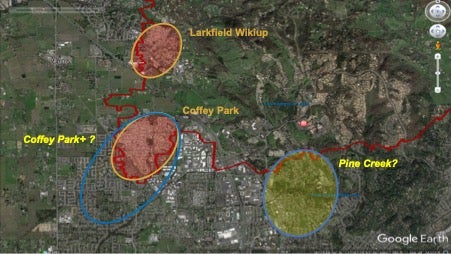
Looking more closely at the Tubbs fire, the communities of Coffey Park and Larkfield-Wikiup were the specific communities affected by urban conflagration. Figure 1 shows the extent boundaries (in red) for the Tubbs fire at Coffey Park and Larkfield-Wikiup, and the yellow circles show communities where RMS believes urban conflagration occurred. We used the RMS® U.S. Wildfire Model, which explicitly features urban conflagration events, to look at simulations of the Tubbs fire taking into account uncertain weather, fuel, and suppression capabilities. In 1000 simulations of the event, the model not only represented accurately the observed impact of the fire in the communities of Coffey Park and Larkfield-Wikiup, (shown in yellow circles) it also showed some interesting alternative realizations.
At RMS we call these alternative realities Counterfactual Scenarios – scenarios that could have occurred had conditions been just a bit different. Two of these counterfactuals are shown in the figure with blue circles. One of them labelled “Coffey Park+?” covers an area twice as large as the actual portion of Coffey Park that burned. The Coffey Park+ counterfactual is associated with winds that did not suddenly die off in the middle of the night but continued for just 4 more hours. In this event, the losses would have nearly doubled the number of burned structures and increased losses by 30-50%. We reviewed these scenarios with a fire chief at CalFire, who said these scenarios are very plausible as the actual fire just died off on the night of October 9th when the high winds suddenly subsided at 3am.
Even more alarming however, is the other blue circle in the figure which highlights the Pine Creek community. Pine Creek had similar conditions to Coffey Park, and could also have gone up in flames had the extreme winds turned to blow into that neighborhood that night. This counterfactual also could have nearly doubled the number of damaged structures. Thus, an already catastrophic event avoided becoming worse only through fortune.
Figure 1. Extent boundary for the Tubbs fires at Coffey Park and Larkfield-Wikiup (red), communities that suffered urban conflagration (yellow) and counterfactual conflagrations scenarios (blue).
So, back to our original question; where could the next Coffey Park occur?
To answer this, we’ve started by assigning all U.S communities an Urban Conflagration Indicator. This indicator is based on our 50,000-year simulations of future fires. Within the simulated set of 72 million fires, only a few percentage of them create urban conflagration scenarios. But that few percentage accounts for approximately one-third of the average annual loss nationwide.
Our Urban Conflagration Indicator has 5 levels that vary between 0 and 4. For Level 0, there is no conflagration potential. Level 1, 2 and 3 communities have one or more of these risk factors:
high building density
high wildfire ember threat
high likelihood of extreme weather
Level 4 has all these risk factors.
Nationwide, there are thousands of communities that we’ve classified as Level 3 and 4. So the answer to where the next Coffey Park could occur can actually be answered – and it's not just a single location, but lots of locations. But with better risk classification tools, insurance companies can monitor for accumulations of risk, prevent insolvency, and be better prepared for the next Coffey Park-like event.
Note the urban conflagration indicator is just one of the innovations RMS is bringing to market to manage wildfire risk. While wildfire risk is rising, it need not be managed blindly. Find out more, the North America wildfire model is included in several of our new software tools such as Risk Modeler, SiteIQ, and Location Intelligence API.
New Era of U.S. Wildfire Modeling Begins with Risk Modeler
…
Read More
Michael Young
Vice President, Model Product Management, Moody's RMS
Michael leads a team that establishes requirements and features for all of the Moody's RMS North and South America climate models. Michael's responsibilities include overseeing the submission of Moody's RMS products to regulatory reviewers, such as the Florida Commission on Hurricane Loss Projection Methodology (FCHLMP).
Michael has led studies of insurance mitigation programs for the state of Florida, as well as the World Bank. In his past 14 years at Moody's RMS, Michael has also worked as a lead wind vulnerability engineer, a director of claims and exposure development, and as the head of the mitigation practice. He has worked in commercial wind-tunnel laboratories doing studies on wind loads for a variety of buildings.
Before joining Moody's RMS, he was involved in the development of Federal Emergency Management Agency (FEMA) HAZUS-MH software for hurricane risk assessment, and he taught courses on the use of HAZUS hurricane and flood components. Michael has also led studies on mitigation cost effectiveness for building codes such as the 2001 Florida Building Code and the North Carolina Building Code.
Michael holds a bachelor's degree in Civil Engineering and a master's degree from the University of Western Ontario in Canada in Wind Engineering.