This was in addition to a range of risk models and general updates within Version 23 for both our on-premises and cloud risk modeling solutions.
From cutting-edge software to innovative new models, we hope that each monthly update we publish will demonstrate our commitment to delivering solutions that can help you master the interconnected risk lifecycle.
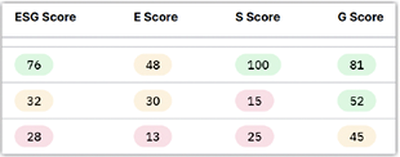
Customize ESG Score Ranges (For Clients Who Have Licensed ESG Data for ExposureIQ)
Once a client has licensed ESG data for ExposureIQ, application users with admin rights can customize the score ranges for each of the three ESG factors for a specific sector or industry as either low, medium, or high.
Using these custom ranges, a client can reflect their own company's view on whether they believe an ESG score for an account within a specific sector or industry is good or requires improvement.
This allows insurers to customize and build their own view of ESG performance and provide new insights into their portfolios.
ESG Score Default Ranges: Low/Red: 0 to 29; Medium/Amber: 30 to 49; High/Green: 50 to 100
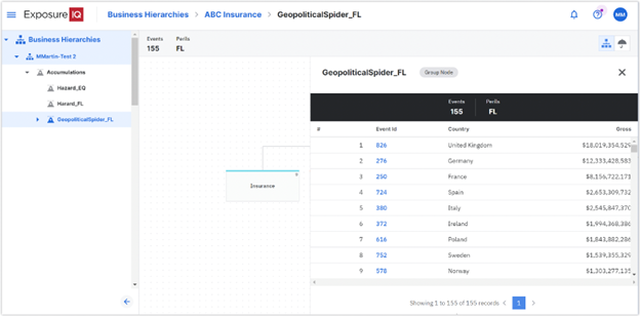
Run Geopolitical Spider Accumulations on a Business Hierarchy
The ExposureIQ application now supports geopolitical spider accumulations for business hierarchies. This type of multi-event accumulation enables users to identify exposure hotspots across an entire hierarchy.
It does this by finding geopolitical regions of a specified granularity (down to Admin2 level) that contain the highest exposure concentration within a broader region's boundaries.
For example, (re)insurers can identify their top country or state level accumulations anywhere in the world, across all of their cedants. Users can then analyze up to the top 200 events across the entire hierarchy.
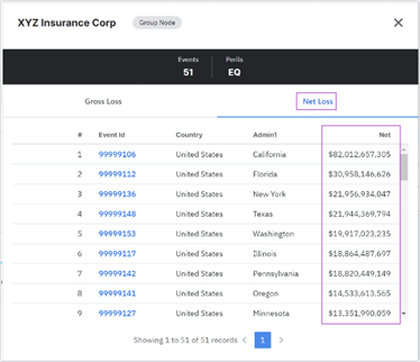
In addition, a new ‘net loss’ tab has been added to the geopolitical spider accumulation’s top events panel, which indicates how much of each loss is retained after accounting for recoveries from purchased reinsurance. ExposureIQ calculates net loss as the event's gross loss minus ceded loss.
Import Inward Reinsurance Programs
If you create business hierarchies in ExposureIQ, we have made it easier to define inward reinsurance programs containing the collection of assumed relevant treaties, along with your corresponding shares. Users can now import programs to quickly create a larger number of programs or those containing many treaties, treaty subjects, and sub-conditions.
Risk Modeler
Upload Results Data Module with Losses from HD Models
Since the development of the high-definition (HD) framework in 2016, Moody’s RMS has launched over 60 HD models for high-gradient perils, such as floods, severe convective storms, and windstorms.
As more firms adopt HD models, we are facilitating the data exchange of HD results using Results Data Module (RDM) databases to improve risk transfer decision-making for our HD and non-HD model customers alike.
In this update, Risk Modeler now adds support for uploading RDMs with HD losses. Risk Modeler users can now upload losses that were exported from Risk Modeler in the Period Loss Table (PLT) format (and stored in the RDM.plt schema tables).
After uploading the RDM, you can perform post-analysis actions including currency conversion and grouping. This release will be particularly valuable for the upcoming 1/1 renewals as it will empower users with the latest generation of HD model results for improved risk insights.
RMS will continue to support attaching RDMs as HD results in the RiskLink® application, however, RiskLink users will not be able to conduct additional downstream analysis on the results.
Data Bridge
System Usage for Archived Data
For Intelligent Risk Platform administrators, the Data Bridge system usage dashboard in the Admin Center now includes a new archive storage trend graph to monitor archived data.
We will continue to keep you updated on unified modeling and the latest Intelligent Risk Platform developments in our regular blog posts.
Share
Questions or Feedback on Current Blog Posts? Suggestions for Upcoming Blog Posts?


