Over the past 15 years, revolutionary technological advances and an explosion of new digital data sources have expanded and reinvented the core disciplines of insurers. Today’s advanced analytics for insurance push far beyond the boundaries of traditional actuarial science. The opportunity for the industry to gain transformational agility in analytics is within reach. EXPOSURE examines what can be learnt from other sectors to create more analytics-driven organizations and avoid ‘DRIP’.
Many (re)insurers seeking a competitive edge look to big data and analytics (BD&A) to help address a myriad of challenges such as the soft market, increasing regulatory pressures, and ongoing premium pressures. And yet amidst the buzz of BD&A, we see a lack of big data strategy specifically for evolving pricing, underwriting and risk selection, areas which provide huge potential gains for firms.
IMAGINE THIS LEVEL OF ANALYTICAL CAPABILITY PROVIDED IN REAL-TIME AT THE POINT OF UNDERWRITING; A UTOPIA MANY IN THE INDUSTRY ARE SEEKING
While there are many revolutionary technological advances to capture and store big data, organizations are suffering from ‘DRIP’– they are data rich but information poor. This is due to the focus being on data capture, management, and structures, at the expense of creating usable insights that can be fed to the people at the point of impact – delivering the right information to the right person at the right time
Other highly regulated industries have found ways to start addressing this, providing us with sound lessons on how to introduce more agility into our own industry using repeatable, scalable analytics.
Learning From Other Industries
When you look across organizations or industries that have got the BD&A recipe correct, three clear criteria are evident, giving good guidance for insurance executives building their own analytics-driven organizations:

Delivering Analytics to the Point of Impact
In the healthcare industry, the concept of the back-office analyst is not that common. The analyst is a frontline worker – the doctor, the nurse practitioner, the social worker, so solutions for healthcare are designed accordingly.
Let’s look within our own industry at the complex role of the portfolio manager. This person is responsible for large, diverse sets of portfolios of risk that span multiple regions, perils and lines of business. And the role relies heavily on having visibility across their entire book of business.
A WILLIS TOWERS WATSON SURVEY REVEALS THAT LESS THAN 45 PER CENT OF U.S. PROPERTY AND CASUALTY INSURANCE EXECUTIVES ARE USING BIG DATA FOR EVOLVING PRICING, UNDERWRITING AND RISK SELECTION. THIS NUMBER IS EXPECTED TO JUMP TO 80 PERCENT IN TWO YEARS’ TIME
Success comes from insights that give them a clear line of sight into the threats and opportunities of their portfolios – without having to rely on a team of technical analysts to get the information. They not only need the metrics and analytics at their disposal to make informed decisions, they also need to be able to interrogate and dive into the data, understand its underlying composition, and run scenarios so they can choose what is the right investment choice.
If for every analysis, they needed a back-office analyst or IT supporter to get a data dump and then spend time configuring it for use, their business agility would be compromised. To truly become an analytics-driven organization, firms need to ensure the analytics solutions they implement provide the actual decision-maker with all the necessary insights to make informed decisions in a timely manner.

Ensuring Usability
Usability is not just about the user interface. Big data can be paralyzing. Having access to actionable insights in a format that provides context and underlying assumptions is important. Often, not only does the frontline worker need to manage multiple analytics solutions to get at insights, but even the user persona for these systems is not well defined. At this stage, the analytics must be highly workflow-driven with due consideration given to the veracity of the data to reduce uncertainty.
Consider the analytics tools used by doctors when diagnosing a patient’s condition. They input standard information – age, sex, weight, height, ethnicity, address – and the patient’s symptoms, and are provided not with a defined prognosis but a set of potential diagnoses accompanied by a probability score and the sources.
Imagine this level of analytical capability provided in real-time at the point of underwriting; a Utopia many in the industry are seeking that has only truly been achieved by a few of the leading insurers.
In this scenario, underwriters would receive a submission and understand exactly the composition of business they were taking on. They could quickly understand the hazards that could affect their exposures, the impact of taking on the business on their capacity – regardless of whether it was a probabilistically–modeled property portfolio, or a marine book that was monitored in a deterministic way.
They could also view multiple submissions and compare them, not only based on how much premium could be bought in by each, but also on how taking on a piece of business could diversify the group-level portfolio. The underwriter not only has access to the right set of analytics, they also have a clear understanding of other options and underlying assumptions.

Integration Into the Common Workflow
To achieve data nirvana, BD&A output needs to integrate naturally into daily business-as-usual operations. When analytics are embedded directly into the daily workflow, there is a far higher success rate of it being put to effective use.
A good illustration is customer service technology. Historically, customer service agents had to access multiple systems to get information about a caller. Now all their systems are directly integrated into the customer service software – whether it is a customer rating and guidance on how best to handle the customer, or a ranking of latest offers they might have a strong affinity for.
SKILLED UNDERWRITERS WANT ACCESS TO ANALYTICS THAT ALLOW THEM TO DERIVE INSIGHTS TO BE PART OF THE DAILY WORKFLOW FOR EVERY RISK THEY WRITE
It is the same principle in insurance. It is important to ensure that whatever system your underwriter, portfolio manager, or risk analyst is using, is built and designed with an open architecture. This means it is designed to easily accept inputs from your legacy systems or your specific intellectual property-intensive processes.
Underwriting is an art. And while there are many risks and lines of business that can be automated, in specialty insurance there is a still a need for human-led decision-making. Specialty underwriters combine the deep knowledge of the risks they write, historical loss data, and their own underwriting experience. Having good access to analytics is key to them, and they need it at their fingertips – with little reliance on technical analysts.
Skilled underwriters want access to analytics that allow them to derive insights to be part of the daily workflow for every risk they write. Waiting for quarterly board reports to be produced, which tell them how much capacity they have left, or having to wait for another group to run the reports they need, means it is not a business-as-usual process.
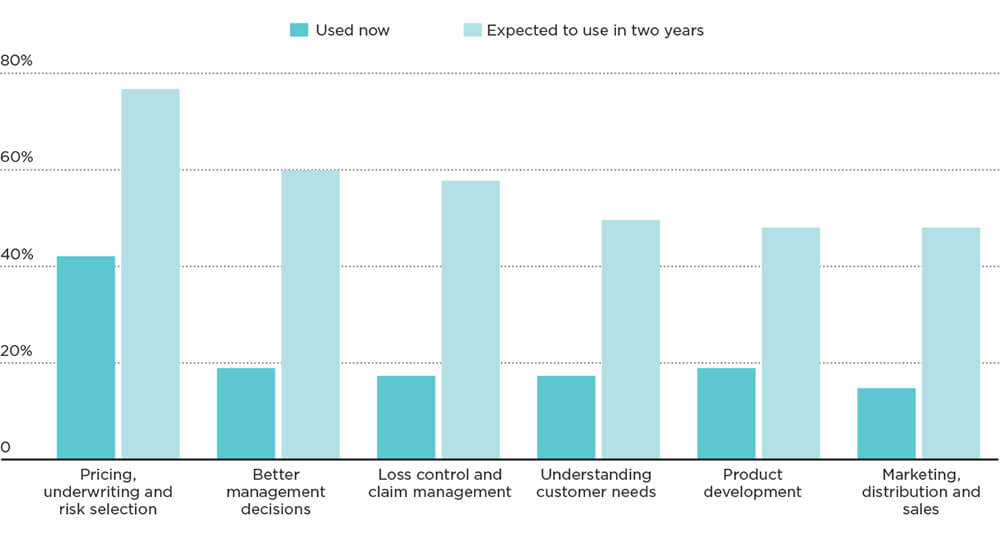
How will insurers use big data? Survey of property and casualty insurance executives (Source: Willis Towers Watson)


