The Japan Meteorological Agency recently called the M7.1 earthquake on February 13, 2021, an aftershock of the March 11, 2011, Mw9.0 Tohoku event, nearly 10 years after the original mainshock. How long should a community wait after an earthquake before they return to their homes or start to rebuild? When is the risk of aftershocks over?
Awareness of aftershocks has carried through the centuries. The concept of an “earthquake quarantine” was evident in the Italian town of Pistoia, Tuscany, some 10 miles (16 kilometers) northwest of Florence, when it was hit by a strong earthquake in March 1293. Many of the town’s masonry buildings were left in a precarious state, and the survivors dragged their wood-frame beds out of the ruins into hastily assembled sheds and tents kept in storage for such an emergency. For a week of aftershocks, they lived away from their buildings. On the eighth day they returned to their homes.
This week of earthquake quarantine was a tradition passed down the generations in central Italy. Like the 40 days of quarantine for a ship suspected to be carrying the plague, the waiting time was founded on centuries of astute empirical observation. We now know how to calculate the risk-saving.
Decay of Aftershock Activity
Did the earthquake quarantine week save lives? According to Japanese seismologist Fusakichi Omori in 1894, aftershock activity decays proportional to 1/t[1], which is now known as Omori’s Law. He also identified that activity falls off rapidly in passing away from the mainshock source. After a week, the additional risk reduction for staying outside another night is only an eighth of the risk saved through camping out the first night.
Almost half of the total risk across 100 days after the mainshock occurs in the first week. With nothing other than empirical experience, accumulated at diverse times and towns, a rational policy was formulated since the thirteenth century that would impress a twenty-first century behavioral economist.
Tohoku Aftershocks
Following the Mw9.0 Tohoku Earthquake on March 11, 2011, three out of eight of the largest M7.0+ aftershocks occurred within the first seven days. In a previous blog looking at aftershocks after the 2011 Christchurch, New Zealand, earthquakes, I outlined the work of Markus Båth. “Båth’s Law” predicts that the largest aftershock is typically 1.1 to 1.2 magnitude units smaller than the mainshock.
With Tohoku, the biggest aftershock had a moment magnitude of 7.7 and occurred within 29 minutes of the mainshock, extending the plate boundary fault rupture south. Within 24 hours, there were two more earthquakes above magnitude 7.0, and then the intervening gaps lengthened exponentially: April 2011, July 2011, December 2012, October 2013, and most recently in February 2021, almost at the 10th anniversary. By this time, according to Omori’s Law, daily activity was 0.03 percent of the first day.
The number of aftershocks runs into the thousands with 82 shocks of M6.0 and higher and 506 shocks of M5.0 and higher. With the exception of the largest aftershock which continued the fault rupture to the south, these initial earthquakes, located in an aftershock cloud around the main fault rupture, did not greatly add to the damage. The disposition of the fault rupture, dipping down toward the land, means that many aftershocks tended to be deeper with reduced surface shaking.
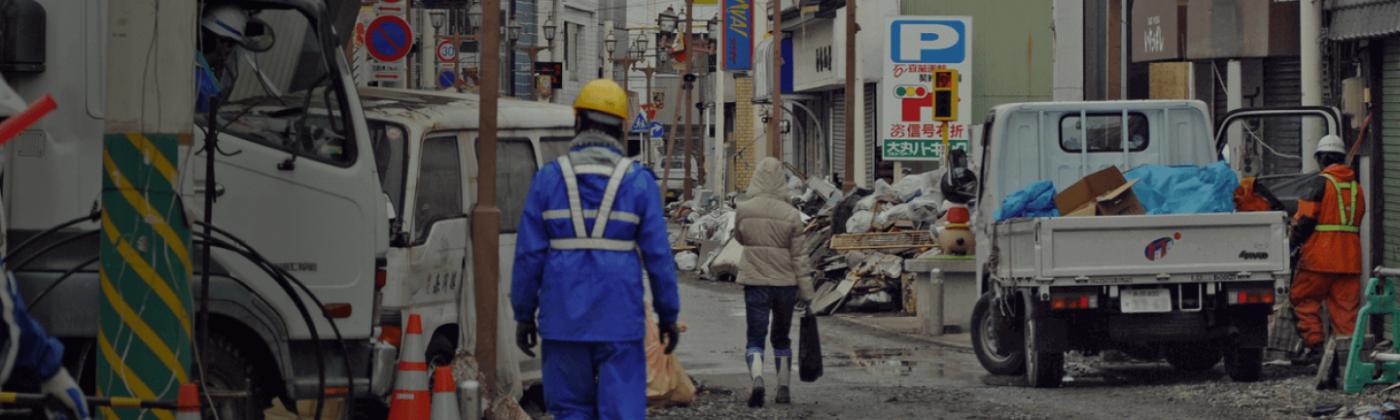
The most damaging aftershock occurred on April 7, 2011, situated nearshore and downdip of the original epicenter.[2] Too soon after the mainshock to distinguish fresh building damage, the April aftershocks did bring additional damage, which we know from the infrastructure impacts. This included, for example, displacing 620 sections of railway track, as compared with 2,200 sections displaced in the mainshock. Any extra damage from the initial aftershocks gets folded into the analysis of losses – the Japan Reconstruction Agency classified 122,000 houses as “completely destroyed” and 282,000 as “half destroyed” - and the development of vulnerability functions.
However, by the time of the latest aftershock, the Mw7.1 event on February 13, 2021, located 37 miles (60 kilometers) offshore and at a depth of 31 miles (50 kilometers) from the mainshock, everything was rebuilt and restocked. In coastal towns, the shock caused damage to traditional tiled roofs, displaced furniture and shelving, and injured 185 people, many from broken glass.
Across much of Japan, from Kyushu to Hokkaido,[3] background seismic activity increased following the March 11, 2011, mainshock. A small set of M6 earthquakes were triggered far beyond the aftershock cloud. One situated beneath Mt. Fuji led to fears of an eruption. There was also concern that larger earthquakes might migrate to the vicinity of Tokyo, but no consensus was reached as to the structure of the three tectonic plates beneath the city.
One group proposed that a 100-kilometer-long slab had completely broken off the Philippine Sea plate,[4] and they forecast a 250 percent increase in earthquakes around the city for five years from March 2013.[5] Meanwhile, another group of seismologists, who saw continuity in the down-going slab, found any increase in seismicity was likely to be “insignificant”.[6] Meanwhile the earthquakes stayed away.
Modeling Aftershocks
The 2011 Tohoku Earthquake once again invites the question: Should aftershocks be modeled independently for their contribution to loss? In New Zealand in 2011, we saw the extraordinary situation where an aftershock caused multiples of damage relative to the original mainshock – read more in my recent blog. Since Tohoku in March 2011, and far more typically, the largest aftershocks in Japan have made a modest impact – in the first few months contributing a small proportion of the overall damage and in February 2021 bringing some widespread minor damage to the repairs.
Once again, we can ask the question: Is the potential contribution to loss from aftershocks something we should model through space and time after all major earthquake mainshocks? RMS® believes so, and we have updated the short-term event probabilities in the RMS® Japan Earthquake and Tsunami HD Model following the Tohoku Earthquake to capture this increase in risk.
The standard excess of loss reinsurance structures and a three-day hours clause don’t match the reality of a long-running aftershock sequence. Once there has been a significant mainshock, could one make an insurance coverage, backed by stop-loss reinsurance, to cover all the potential aftershock activity? This would provide useful reassurance for those looking to rebuild, in case a large aftershock were to follow.
Perhaps a product could be developed through a secondary insurance market, or from the use of a parametric insurance-linked securities (ILS) structure, anticipating the remote possibility of a damaging tail event, as in February 2011 in Christchurch. With the use of models to quickly assess the losses from an anticipated aftershock cloud, issuers and investors could meet a much-needed demand.
[1] Omori, F. (1894) On the aftershocks of earthquakes. J. College Sci. 7, 521–605.
[2] Henry, C., & Das, S. (2001). Aftershock zones of large shallow earthquakes: Fault dimensions, aftershock area expansion and scaling relations. Geophysical Journal International 147(2), 272–293 https://academic.oup.com/gji/article/147/2/272/717516
[3] Somerville, P. G. (2014). A post-Tohoku earthquake review of earthquake probabilities in the Southern Kanto District, Japan. Geoscience Letters 1(10). https://doi.org/10.1186/2196-4092-1-10
[4] Toda, S., Stein, R., Kirby, S., et al. (2008). A slab fragment wedged under Tokyo and its tectonic and seismic implications. Nature Geoscience 1, 771–776. https://doi.org/10.1038/ngeo318
[5] Toda, S., & Stein, R. (2013). The 2011 M = 9.0 Tohoku-oki earthquake more than doubled the probability of large shocks beneath Tokyo. Geophysical Research Letters 40(11), 2562–2566. https://doi.org/10.1002/grl.50524
[6] Nanjo, K. Z., Sakai, S., Kato, A., Tsuruoka, H., & Hirata, N. (2013). Time-dependent earthquake probability calculations for southern Kanto after the 2011 M9.0 Tohoku earthquake. Geophysical Journal International 193(2), 914–919. https://doi.org/10.1093/gji/ggt009; Uchida, N., & Matsuzawa, T. (2013). Pre- and post-seismic slow slip surrounding the 2011 Tohoku-oki earthquake rupture. Earth and Planetary Science Letters 374, 81–91. https://doi.org/10.1016/j.epsl.2013.05.021