We are pleased to announce that RMS Risk Intelligence™ version 1.12 has now been released. This new release includes many improvements such as the introduction of new Structure Tags and Domain Data Tables related to items such as “Line of Business”, “Underwriting Group” and “Offer Type”. The release also includes an assortment of quality improvements.
With these Structure Tags, users can now sort and filter data in the Data Directory, delivering effective data organization capabilities on the platform. But while we realize getting your data into the platform is important – getting insights from your data off the platform is even more important. There are already plenty of options available to do this. You can get these insights from the user interface (UI), exporting your data via CSV files and our APIs. You can now use SQL or your own preferred tools to obtain deep insights into your data.
So, for the rest of this blog post, I want to give you a deep dive into a new, valuable tool available for Risk Modeler users on the Risk Intelligence platform that will help you generate reports – regardless of how you access your data or deliver your final report output.
Powerful Customized Reporting with Excel and Tableau
Producing reports can be a complex, frustrating and time-consuming task. These reports span across many areas, such as from the latest views on exposure analytics or loss metrics, and for many of our clients, this task is an additional burden to the many other responsibilities that comes with their role.
As well as compiling, publishing and distributing these reports to a range of internal and external stakeholders, on a daily, weekly or monthly cadence, there is also a great deal of effort required to get the data and insights in the first place.
Where does this data and insight come from? Typically, it comes from a myriad of sources across the organization, whether it is data being pulled from internal SQL databases, external sources or from platforms such as RMS Risk Intelligence. The data gathering can be arduous; reliant on colleagues in many different departments and locations to supply their updates manually, or requiring the data holder to build specific APIs to allow access. The data then has to be retrieved, analyzed and compiled into the preferred format, such as Excel or using business intelligence (BI) applications such as Tableau, for onward distribution.
How can the process of reporting be simplified and automated? One of the key aspects of the RMS Risk Intelligence platform is its utilization of the Risk Data Lake, a repository that can securely unify rich RMS data with your data and third-party data. Released this spring, clients can now use a JDBC/ODBC connector that links the back-end data to front-end applications such as Excel or Tableau, and it allows SQL access to your exposure and loss metrics within the Risk Data Lake.
Here’s an example using the Risk Intelligence platform and the JDBC/ODBC connector. Let’s say you need to generate a report for AM Best. Part of the input into that report requires you to view your top risks and compare your Ground Up (GU) and Gross (GR) Losses by Occupancy.
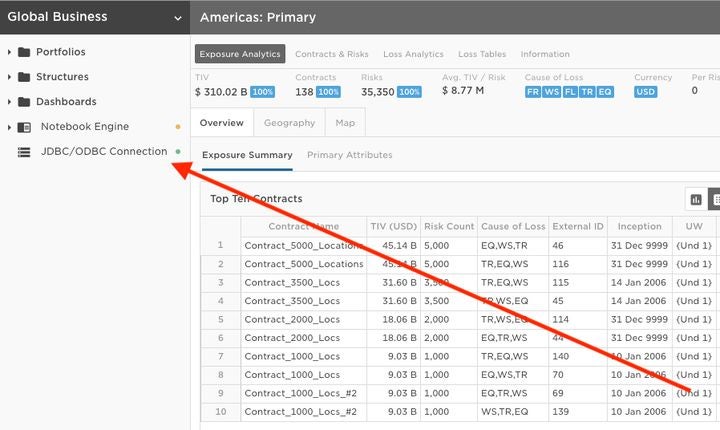
You can configure the JDBC/ODBC connector on your Project within Risk Intelligence that contains the data you want to query:
From there you can connect your external tools like Tableau to view your data:
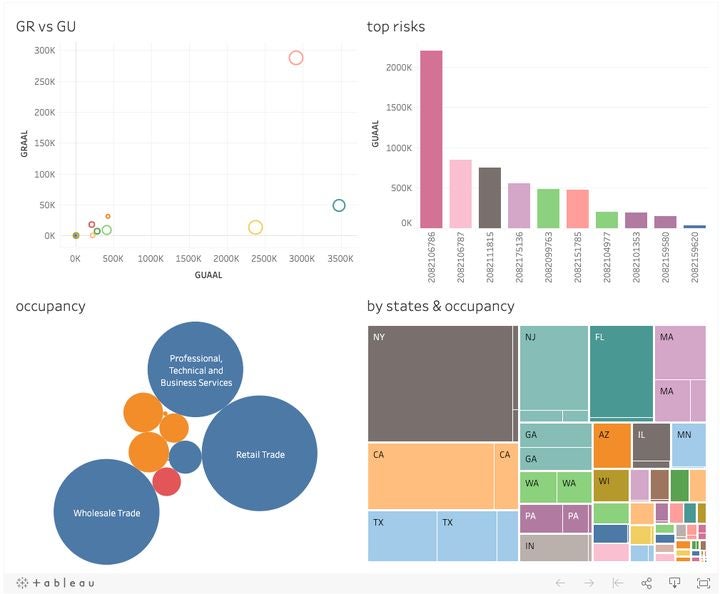
Reviewing the output above, the “Top Risks” view catches the eye. The chart makes it easy to notice that one risk is almost three times the Ground Up loss compared to the rest. Now that we are aware of the difference, we can follow up to see if this data has a typo in the policy/location terms and conditions. We can also verify if it meets our underwriting guidelines. Spotting outliers like this can be easy when using the JDBC/ODBC connector combined with graphic reporting.
This connector was made to democratize your data. You no longer need to depend on other team members to deliver the data or write code to connect several APIs to get the data you need. Now the power is at your fingertips with your own tools that you are familiar with, and if you are familiar with coding for APIs, then the JDBC/ODBC connector will work with your code too.
Log on to RMS Owl or contact RMS Support for more details on how to get started with the JDBC/ODBC connector within Risk Modeler.
Additional Information: