Hurricane Season Outlook: Are We Heading for a Repeat of 2017?
James CosgroveJune 22, 2018
With the 2018 Atlantic hurricane season underway, the (re)insurance industry is still reflecting on the events of last year. The 2017 season will be remembered as one of the most active, damaging, and costliest seasons on record, and specifically for the impacts of three storms: Harvey, Irma, and Maria.
RMS followed its longstanding strategy of delivering thoughtful and thorough analysis of all available data sources when responding to the events of 2017, including the use of instrumentation and in-person RMS staff research and reconnaissance.
For Harvey, we provided insight into our event response with regular updates from across the organization and outlined how we deployed the new RMS® U.S. Inland Flood HD Model in real-time to support a pipeline of flood deliverables for our clients. And for Maria, the use of the latest modeling innovations, up-to-date exposure and vulnerability data supported by on the ground presence and local knowledge helped us to provide clients with a clearer picture of post-event losses across the islands impacted.
In striking the delicate balance of timeliness and scientific integrity, RMS produced industry loss estimates for Harvey, Irma, and Maria that validate well against the latest tallies of insured loss, for individual events and in aggregate. Thus, these estimates remain unchanged from initial guidance — between US$75 billion and US$120 billion — inclusive of extended business interruption and post-event loss amplification, while other model vendor estimates required significant revision in the months following their release.
With the scale of last year’s losses, it is no surprise that the industry is anxiously looking ahead to the forthcoming season.
RMS has released its 2018 North Atlantic Hurricane Season Outlook report documenting the preseason activity forecasts and the key oceanic and atmospheric factors behind these forecasts. The report details:
The latest seasonal forecasts of named storms, hurricanes, major hurricanes, and Accumulated Cyclone Energy (ACE) Index
Landfall forecasts for the U.S. and the Caribbean
The key oceanic and meteorological factors driving the seasonal forecasts for 2018, including the predicted state of the El Niño-Southern Oscillation and sea surface temperatures in the Atlantic
2018: What’s in Store?
As of the beginning of June, most forecast agencies and meteorological organizations are forecasting near-average hurricane activity in the North Atlantic in 2018.
The National Oceanic and Atmospheric Administration (NOAA) forecasts 10-16 named storms, five to nine hurricanes, and one to four major hurricanes — estimates close to the recent average[1]. The outlook indicates a 40 percent probability that the season will be near-average, with a 35 percent probability the season will be above-average. Other well-known forecasting groups, including Colorado State University (CSU) and Tropical Storm Risk (TSR), anticipate slightly lower activity.
Significantly, most seasonal forecasts anticipate fewer tropical storms, fewer hurricanes, and fewer major hurricanes in 2018 compared with 2017.
Seasonal Hurricane Forecasting: A Balancing Act
The latest seasonal hurricane forecasts are a balancing act comprising of the competing impacts of several major oceanic and atmospheric influences; namely the status of the El Niño-Southern Oscillation (ENSO), and sea surface temperatures (SSTs) in the Atlantic.
A large proportion of the uncertainty associated with forecasts of seasonal hurricane activity arises because of the uncertainty around which ENSO phase will materialize during the peak months of the hurricane season. My colleague, Christopher Allen, recently provided a detailed overview of the discovery and dynamics of ENSO, the planet’s largest source of natural climate variability.
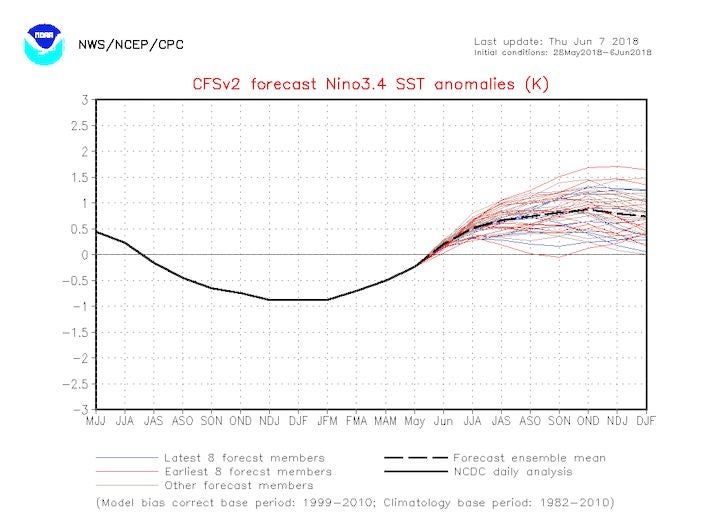
Forecasts favor ENSO-neutral conditions during the September to November period, with a 50 percent probability of a transition to an El Niño phase by the winter of 2018-2019. El Niño is associated with increased Atlantic wind shear that historically inhibits tropical cyclone development in the basin. ENSO-neutral conditions would, in the absence of any other factors, result in average activity.
Figure 1: Niño 3.4 sea surface temperature anomaly (K) forecast from the NCEP coupled forecast system model (CFSv2). Image from Climate Prediction Center (NCEP/NOAA).
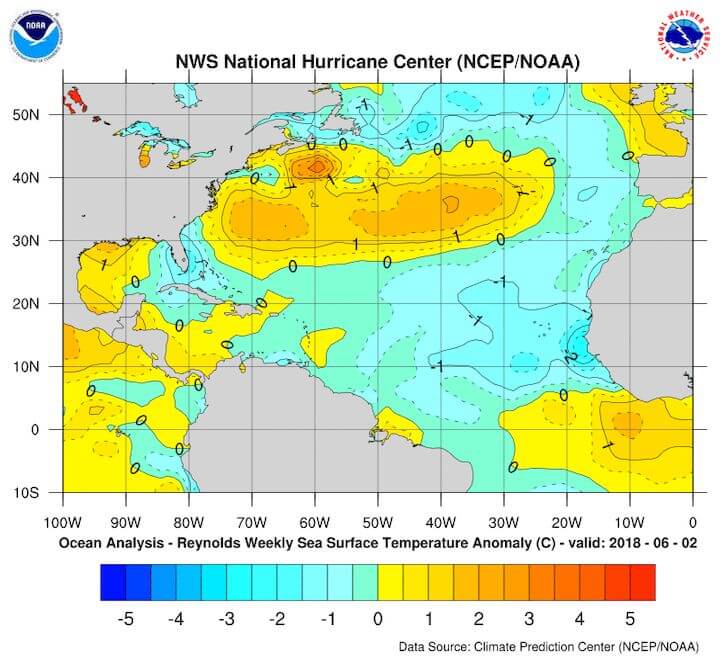
Over in the Atlantic, sea surface temperatures in the tropics are the coldest since 1985 and the second coldest on record (Figure 2). Although forecasts anticipate sea surface temperatures in the main development region to recover to near-average as the summer progresses, cooler than average surface temperatures are not generally conducive for an active Atlantic hurricane season.
Figure 2: Sea surface temperature anomalies (°C) over the Atlantic as of June 2, 2018. Image from Climate Prediction Center (NCEP/NOAA).
Mix in these with other uncertain and competing factors, such as the Atlantic steering patterns, the Saharan Air Layer (SAL), and the Madden-Julian Oscillation (MJO), and forecasting the activity of this year’s North Atlantic hurricane season becomes particularly complex. The report discusses these additional factors and their impact on hurricane activity in more detail. The ongoing evolution and timing of changes to these key factors over the coming months will ultimately determine just how active the 2018 season will be.
Will There Be Any U.S. Major Hurricane Landfalls in 2018?
Hurricane landfall forecasts in advance of the season historically demonstrate low skill as storm tracks are highly sensitive to the location of cyclogeneses and the local atmospheric and oceanic conditions and weather patterns during the season. However, those forecast agencies and groups that issue landfalling forecasts are anticipate near-average or slightly below-average numbers.
It is always worth reiterating that it only takes one hurricane to make a season costly and memorable. Hurricane Andrew was one of only seven named storms to develop during the relatively quiet 1992 season but became one of the costliest hurricanes in U.S. history.
Based in London, James is an Assistant Director within Moody's RMS Event Response team, supporting real-time event response operations and assisting on various event response projects. James holds a bachelor’s degree in Physical Geography and Geology from the University of Southampton and a master’s degree in Applied Meteorology from the University of Reading.