Wine Country Wildfires: Reconnaissance and Loss Estimate Update
Kevin Van LeerOctober 27, 2017
Kevin Van Leer, senior product manager – Model Product Management, RMS
19:00 UTC Friday, October 27
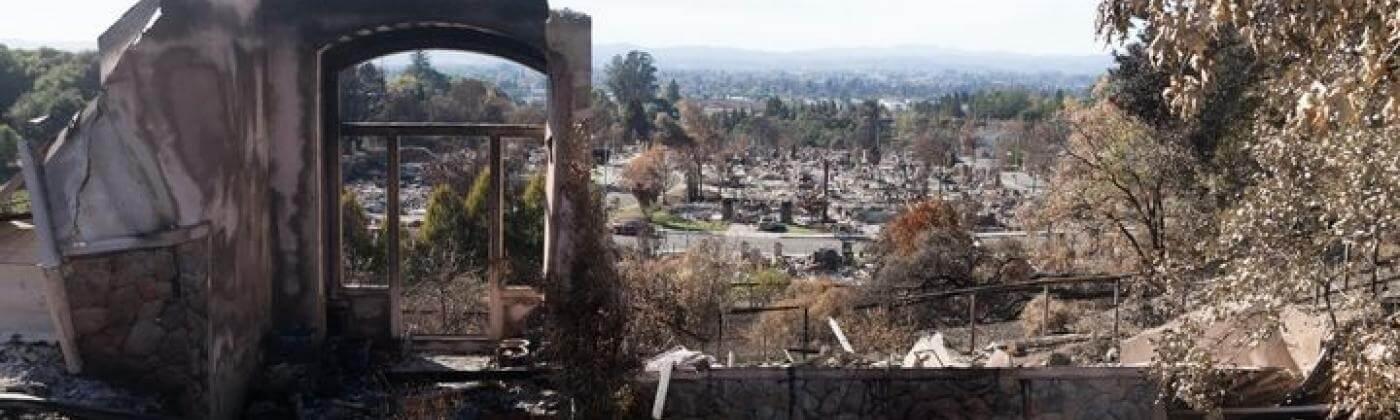
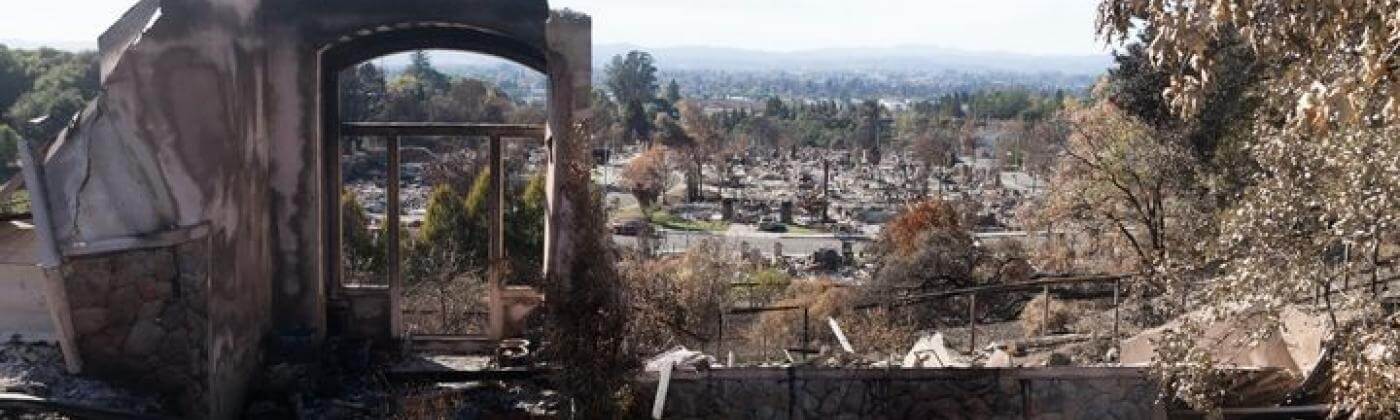
Figure 1: A door frame of a destroyed home overlooks another neighborhood affected by the Wine Country wildfires (Image credit: RMS)
Accompanied by a CAL FIRE escort, on Monday, October 23, RMS reconnaissance experts visited areas affected by the Wine Country wildfires, with a focus primarily on the Tubbs Fire which caused destruction across the Northern California counties of Napa, Sonoma, and Lake. Based on this reconnaissance, RMS has now updated its loss estimate, benefiting from an additional review of the available damage information, plus a review of historical fire damage data.
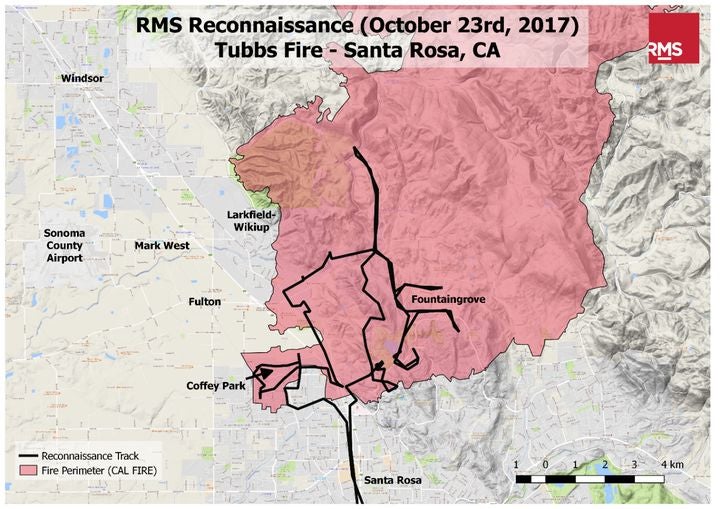
Figure 2: Map showing the perimeter of the Tubbs Fire (CAL FIRE) and the reconnaissance track taken by RMS.
RMS estimates an economic loss for the wildfires impacting Sonoma, Napa, Solano, Lake, and Mendocino counties between US$6 billion and US$8 billion. This range includes loss due to property damage, contents and business interruption caused by the fires to residential, commercial, and industrial lines of business. Automobile or agricultural crop losses are not included. High penetration rates of wildfire coverage in standard homeowners and commercial policies implies similar insured losses.
As a comparison, for the 2015 Valley Fire in Lake County, CA, Property Claims Services reported roughly US$1 billion in insured losses. This estimate was based on 1,900 destroyed structures. CAL FIRE currently estimates four times as many structures (7,800 destroyed and 600 damaged structures), with higher average insured values compared to the Valley Fire.
High-resolution fire perimeters are now available from the Geospatial Multi-Agency Coordination (GeoMAC) to define the exposed commercial and residential exposure boundary of the Wine Country fires. Using this GeoMAC data, the RMS high-resolution exposure database identifies approximately 11,000 structures and more than US$10 billion in total exposure lie within the fire footprints. Please note that this is a reduction from prior estimates derived from lower resolution perimeters.
Figure 3: Exposure value for residential and non-residential structures within fire perimeters.
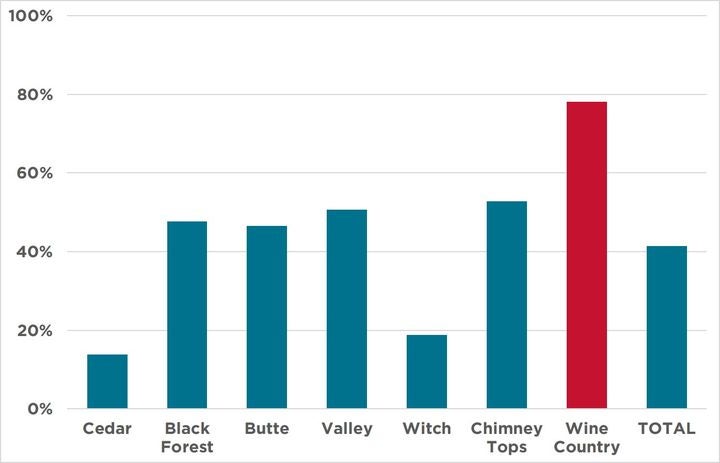
With reports of 8,400 damaged or destroyed structures, this indicates that the proportion of properties affected equates to roughly 70 to 75 percent, which is the highest proportion observed in the RMS review of historical events of this scale and magnitude. Looking at the figure below, this research has shown typical percentages of affected structures ranging between 15 to 50 percent. Lower percentages in the Cedar and Witch fires are believed to be due to the type of vegetation, lower canopy density, and heightened awareness of wildfire risk in the San Diego area.
Figure 4: Percentage of damaged or destroyed structures within a fire footprint.
RMS reconnaissance confirms the high percentage of affected structures within the footprints. Multiple neighborhoods, even outside the well-documented damage in the Coffey Park neighborhood in Santa Rosa, experienced widespread destruction beyond ranges seen in historical events. This includes residential structures ranging from mobile homes to multi-family apartment complexes and high-value single family dwellings.
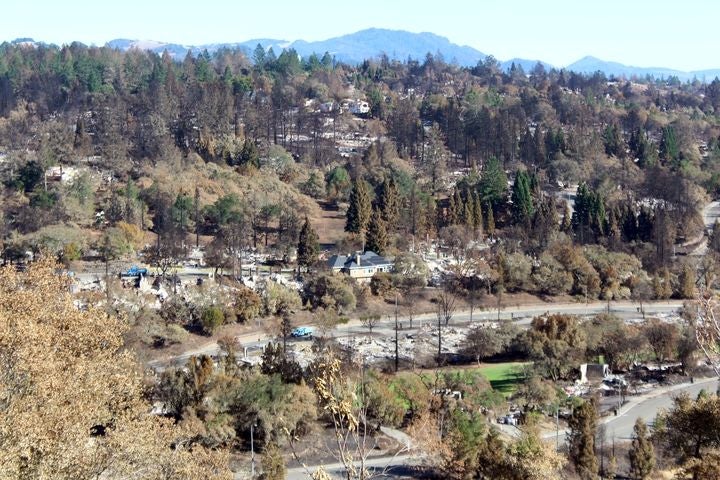
Figure 5: A hilltop view of wildfire damage near Fountaingrove Parkway, just north of Santa Rosa (Image credit: RMS)
Impact of Embers
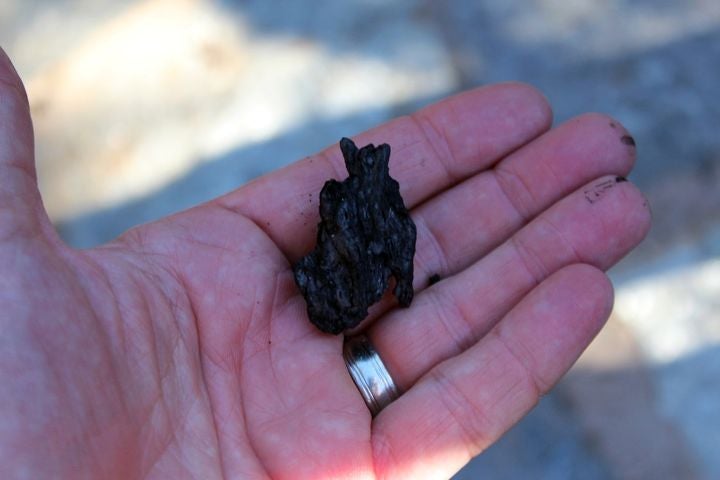
Figure 6: Typical large ember found near a home burned in the Tubbs Fire (Image credit: RMS)
Reconnaissance also highlighted the impact of embers and the large ember accumulations observed around exposures in areas farther away from significant burnable fuels (e.g. trees and large bushes). The effects of embers greatly increased the risk at these locations — including the Coffey Park neighborhood, which experienced nearly 100 percent destruction. Ember risk, driven by the extreme Diablo winds observed during the initial hours of the fires, is likely the primary driver of the increased damage seen within the perimeters and urban areas downwind of significant burnable fuel.
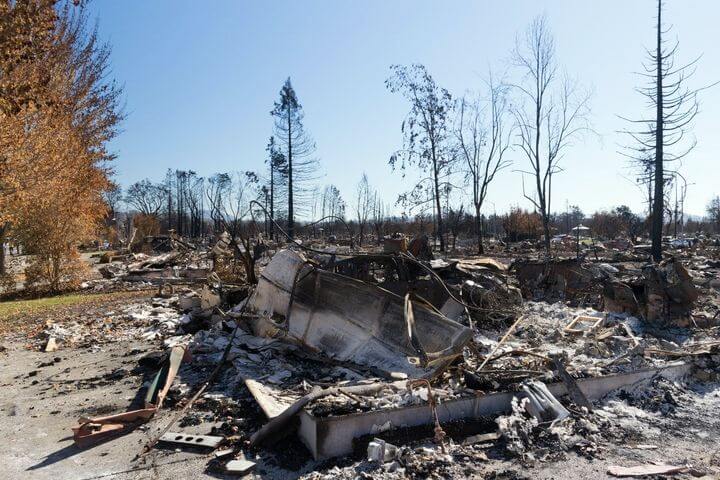
Figure 7: Damage to several homes near Coffey Park, Santa Rosa (Image credit: RMS)
Sources of uncertainty remain with this event loss estimate, including the impacts of demand surge and business interruption costs to the wine industry. These unknown factors, in addition to costs associated with debris removal and building code compliance for new construction, may result in further increases to the total loss from this event.
Share:
You May Also Like
January 22, 2018
Southern California: Thomas Fire Loss Estimate and Mudslide Commentary
California Wildfires: Exposure Impacted by the Thomas Fire
As the Thomas Fire continues to climb the list of the top twenty largest California wildfires for both acres burned and structures destroyed, many in the insurance industry are asking how this fire, in addition to the other burned areas across Southern California, will impact their portfolio. A critical element in understanding the industry impact, but also the significance for an individual book, is the insured value of the burned structures. The Thomas Fire, which at 60 percent containment at the time of publication is already the second largest fire in California history with a reported burn area of 272,000 acres (110,074 hectares), has affected several different communities with wide ranges of average insured value.
Figure 1: Top 20 Largest California Wildfires. Source: CAL FIREWhile damage assessments are still ongoing and counts of damaged or destroyed structures are actively being reported, we can use RMS high resolution exposure data and the latest burn footprint available from Geospatial Multi-Agency Coordination (GeoMAC) to gain a perspective on the total amount and average value of exposure across different areas within the perimeter.
Figure 2: Map of the Thomas Fire Perimeter. Source: GeoMAC as of 0100 UTC on December 18, 2017.As of December 18, portions of ten different ZIP codes are located within the Thomas Fire perimeter, spanning across Santa Barbara and Ventura counties. While the fire started north of Santa Paula around sunset on December 4, it has now spread approximately 50 miles (80 kilometers), primarily to the west, to the hills north of Montecito and Santa Barbara. So far, during two weeks of spread the fire has impacted the communities of Santa Paula, Ojai, Ventura, Oak View, Wheeler Springs, Carpinteria, Montecito, and several others. Each of these communities vary in average residential exposure value, making “average” estimates across the entire perimeter more difficult.
Table 1 below compares the residential exposure for the high value 93108 ZIP postal code that spans the Montecito area against the exposure outside of that ZIP code. All values correspond only to exposure located within the Thomas Fire perimeter, according to the RMS high resolution exposure database. The average residential structure exposure value for 93108 is on average three and a half times higher than structures located outside of that ZIP code. Structures in 93108 accounts for only three and a half percent of the number of structures within the fire perimeter, but 12 percent of the total exposure value.
Table 1: Residential Exposure Values in the Thomas Fire Perimeter.As noted in prior blogs about the Wine Country wildfires, it is important to note that only a fraction of the structures within the perimeter will be damaged or destroyed in this event. The reported numbers so far from CAL FIRE are 1,024 structures destroyed and 250 damaged. Comparing this against the total number of structures within the perimeters, the ratio is approximately 37 percent, which is far lower than the 75 to 80 percent seen in the Wine Country wildfires in October this year, but higher than the other historical Southern California events that have been analyzed (Cedar in 2003 and Witch in 2007).
Figure 3: Percentage of damaged or destroyed structures within historical fire footprints.Also, a comparison of the percentage of destroyed structures versus the total number in the perimeter between the Thomas Fire (1,024 destroyed versus 1,274 total or 80 percent) and the Wine Country Tubbs Fire (6,957 destroyed versus 7,443 total or 93 percent), raises important questions for understanding the key differences between the events. This may indicate a stronger presence of fire suppression, lower impacts of embers, more distributed exposure, differences in surface fuel characteristics (e.g. chaparral versus forest) or a combination of these and other factors in the Thomas Fire. A further review of these event-specific factors, including the weather conditions, will provide more clarity around key drivers of these differences.
By extracting information about the differences between these two events, RMS will continue to build insight into the development of the RMS® U.S. Wildfire HD model, part of the RMS North America Wildfire HD Models suite, due for release in 2018. RMS is still monitoring the ongoing events affecting Southern California and will continue to provide updates through RMS Owl.…
As a senior product manager in the Model Product Management group at RMS, Kevin is responsible for RMS climate-peril products for the Americas, including wildfire and custom vulnerability analytics. Kevin has been actively involved in model releases for both severe convective storm and hurricane models over the last four years at RMS. Kevin holds a master’s degree in atmospheric science from the University of Illinois at Urbana-Champaign, where he authored a thesis on tornado-genesis and severe convective storms, and a bachelor’s degree in atmospheric science from Purdue University. He also holds the Certified Catastrophe Risk Analyst (CCRA) designation from RMS. Kevin is a member of the American Meteorological Society (AMS), a mentor for the AMS Board of Private Sector Meteorologists, and a voting member of the ASCE Standards Committee on Wind Speed Estimation in Tornadoes.