logo image

The annual damage from European windstorms can range significantly: from years when there are clusters of severely damaging storms to other years with almost no windstorm loss. How much of this volatility can we predict, and how much remains a roll of the dice? And more specifically, what storm activity can we expect over the next few months?

Forecasting Storminess

Our understanding of the drivers of annual storminess has increased greatly in recent years, allowing us to provide more forecasting insight than ever before. However, there is a cautionary tale for the industry, one that shows the limitations of even the most sophisticated seasonal forecasts.

The Atlantic Multidecadal Oscillation (AMO) is a pattern of long-duration variability in sea surface temperature in the North Atlantic. It is known to influence the climate over much of the northern hemisphere including the level of storminess in Europe1. As north-south gradients of heat in the Atlantic act to fuel extra-tropical storms2 these longer term changes in sea surface temperature tend to alter the odds of extreme storm occurrence over timescales of 60-80 years. Today, the ongoing positive (warm) phase of the AMO favors lower than average storminess this winter.

That’s the multi-decadal perspective. But it will come as no surprise for Europeans to hear that as well as these longer phases of relative activity and inactivity, the continent also experiences variability of storminess from year to year. We know that the jet stream is a main ingredient of storms, and that in turn these storms strengthen the jet itself, in a positive feedback loop that leads to the term “eddy-driven jet.”  This “storms-beget-storms” mechanism typically plays out over a few weeks, and more severe storms are likelier to occur during these periods. The positive feedback between jet and storms amplifies swings in annual damage, and explains a substantial amount of the storm clustering found in longer range historical weather records4. This coupling between storms and jet is reflected in the version 16.0 of the RMS Europe Windstorm Clustering Model.

Researchers have identified various drivers of seasonal storminess in the North Atlantic which, for the coming winter, are ambiguous. For instance: we are three years after the peak of a prolonged but subdued solar cycle and this timing suggestsless forcing of storminess. But in contrast the predictions are for neutral to weak La Niña phases of the El Niño–Southern Oscillation (ENSO) which points to a chance of increased forcing of North Atlantic storminess. Whilst, to complicate things further, the anticipated values of tropical stratosphere winds, linked to the Quasi-Biennial Oscillation (QBO), are related to less storminess in the mid-latitude Atlantic – with the caveat that they are in an unusually disrupted pattern.

So is it possible to get off the meteorological fence and make a call? Yes: overall, the multi-decadal and seasonal drivers indicate slightly below average storminess.

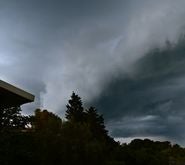
Severe Events Can Occur During Any Season

But this does not mean that we as an industry should be entirely relaxed about the new storm season, as the outlook for annual storm damage is blurred by the vagaries of local weather. This is exemplified by storm Kyrill in January 2007.

Then, ahead of the 2006/07 winter, the seasonal and multi-decadal drivers indicated below average storminess, just as they do today. But Kyrill occurred and turned an otherwise innocuous season into a bad one for many. The gusts and damage during this storm were much more extreme than its general circulation, because convection cells embedded in the cold front contributed to extreme damage intensity in some areas5. Storm Kyrill showed how processes on small space and time scales can dominate annual storm damage. These drivers have seriously short predictability windows of just a few hours.

More generally, some of the past variations in annual storminess have no known driver. We are not quite sure how much, but a reasonable ball-park figure is one half. This random part is found in climate models, where the tiniest possible changes at the start of a forecast often grow into large changes in seasonal average storminess.

Although our understanding of the drivers of storminess has greatly increased over the past few years and the odds do favor less storm damage this winter, we should not be complacent. As its tenth anniversary approaches, Storm Kyrill reminds us that major losses can happen in any season, regardless of the forecast.

Web links to references above

1Peings and Magnusdottir (2014)  [ http://iopscience.iop.org/article/10.1088/1748-9326/9/3/034018/pdf ]

2Shaffrey and Sutton (2006)  [ http://journals.ametsoc.org/doi/pdf/10.1175/JCLI3652.1 ]

3NOAA ESRL AMO data [http://www.esrl.noaa.gov/psd/data/timeseries/AMO/ ]

4Cusack (2016)  [ http://www.nat-hazards-earth-syst-sci.net/16/901/2016/nhess-16-901-2016.pdf ]

5Fink et al. (2009)  [ http://centaur.reading.ac.uk/32783/1/nhess-9-405-2009.pdf ]

This post was co-authored by Peter Holland and Stephen Cusack.

Share:
You May Also Like
Storm Formation
November 06, 2020
Examining the European Windstorm Outlook This Winter
March 05, 2020
Update on Multidecadal Variability of European Windstorms

At this moment, you might expect a blog about European windstorms to be about recent Storms Ciara-Sabine, Dennis and Jorge causing wind and flood losses of a couple of billion euros in Europe. However, the losses this winter are modest in a longer-term context. Instead, I think the recent insights into longer-term variations in wind losses could have much more impact on how we price windstorm risk. We first noticed multidecadal variability of European windstorm activity ten years ago, with 50 percent lower frequencies of damaging storms in the new millennium than in the eighties and nineties. This variability is important: a company’s length of loss experience is unlikely to match the model calibration period, which impacts model validation. It also held the promise of improved risk management, if the storminess changes could be anticipated. We needed to know more about it. Hundred-year records of wind data at several stations from the Dutch weather service, KNMI, showed pronounced multidecadal variability of storminess throughout the period. An RMS review of published work found: A wide variety of observational evidence of multidecadal variability of storminess in Europe An incomplete understanding of multidecadal drivers, including mixed results from earlier climate models What has the past decade of wind data and research taught us about these slow variations in storm activity? The next few sections will show we have learned a lot over the past ten years. Observed Storminess: What are the Changes? The Dutch study was recently updated with nine additional years of wind observations from KNMI, to span 1910-2019. The wind data was homogenized using the same procedures to ensure changes in storminess reflected real meteorological causes rather than observational changes. Figure 1 below shows the main result: the twenty-first century lull has extended throughout the 2010s in the Netherlands. Figure 1: Time series of annual storm loss in the Netherlands, with 10-year running meansStorminess on the continental-scale was measured using a preliminary dataset of European windstorm footprints spanning 1972 to 2018. Each footprint consists of winds at 25 kilometer cells, and a Europe-wide loss index was computed for each historical event. The aggregate loss was computed for each year, then transformed into a standard normal distribution. The Europe-wide annual losses are shown in Figure 2 below, together with annual rates of occurrence of damaging windstorms, also standardized for comparison. Figure 2: Time series of standardized annual aggregate loss index and storm occurrence rates, and their five-year running means, for the whole of EuropeStorm Climate Drivers What could be the drivers of the multidecadal storm variation? Over the past ten years, researchers have made huge advancements in understanding European winter climate variability through analysis of observations and experiments with better climate models. Specifically, they have identified heat anomalies in the North Atlantic Ocean and the Arctic as two main drivers of our winter wind climate at decadal and longer timescales. North Atlantic Ocean Forcing Gulev et al. (2013) examined observations over the 1880-2007 period and identified an ocean region in the central northern North Atlantic which forces the atmosphere at decadal and longer timescales, as shown in Figure 3 below. The resonance in this ocean area is caused by the co-located storm track. Figure 3: The observed correlation, at decadal timescales, of surface heat fluxes and sea surface temperatures in the period 1880-2007; Figure 1b of Gulev et al. (2013). Positive correlations indicate ocean temperature anomalies produce surface flux changes of same sign, to drive the atmosphere.Researchers had been reporting confusing, mixed results from climate models. The situation has since been clarified by Scaife et al. (2012), who explained the need for a high model top and vertical resolution to simulate mid-latitude winter signals. There are few tests with appropriate models. Omrani et al. (2014) found a significant ocean forcing of atmosphere winds, about one half of the corresponding observed anomalies over Europe, from a high-top model. Peings and Magnusdottir (2014) used a more modern climate model and found roughly the same result, and indicated that the same area as Figure 3 was the key to ocean forcing of atmosphere on long timescales. A cooling in this key area raises storminess, and vice versa. Arctic Forcings There have been some remarkable changes in northern hemisphere winters over the past 20 years or so: the Arctic winter warmed at a rapid rate, while mid-latitude winters have warmed slower than the global trend, and even cooled in some areas. Observations reveal a strong link between declining sea ice and a stronger Siberian High. Mechanisms to explain this were reviewed in Cohen et al. (2020), and they viewed the process depicted in Figure 4 as most robust. Figure 4: A schematic of the process linking Barents-Kara sea ice to European winter climateThere has been a long debate on the size of the Siberian High anomaly forced by Arctic warming, fanned by mixed climate model results. This is getting resolved by recent research indicating climate models have special requirements to simulate mid-latitude winter signals, such as high model top and fine vertical resolution and fully coupled ocean-atmosphere models.  Six modern climate models meeting most requirements had a consistent signal of sea ice loss causing a stronger Siberian High, and a weakening of the westerlies carrying storms into Europe. Their modeled signal is about half of the observed circulation change over the past few decades. The Outlook How are the two main drivers likely to evolve over the next several years, and what does this entail for European windstorm activity? North Atlantic Ocean Outlook Figure 5 shows the mean temperature anomalies (lower plot) for the key ocean area (upper plot). Will the recent cooling continue, or reverse? There are no published forecasts of ocean heat in the specific key region for the next decade. Instead, we estimate changes based on the known drivers of heat in this area, and conclude the likeliest outcome is for persistence of these cooler anomalies in the next few years, implying the stormier North Atlantic of recent years will continue. Will they raise windstorm loss? That depends more on the second driver, and what it does to the Siberian High. Figure 5: Time series of mean temperature anomaly in the top 400 meters of the ocean in November to April (lower plot), for the region off Newfoundland indicated by red box (upper plot). Ocean temperatures from EN4 were de-trended to remove global warming signal.Arctic Outlook Anthropogenic forcing is the main cause of Arctic warming and sea ice decline, and the IPCC indicate this is very likely to continue in the future. On shorter timescales, Årthun et al. (2017) describe how North Atlantic Ocean heat anomalies are carried north to modulate sea ice in the Barents and Kara Seas. The northern Atlantic has been cool since 2015, and Figure 6 below shows winter sea ice area in this region has risen since its nadir in 2016. The northern North Atlantic waters are expected to remain cooler over the next few years, and this could stabilize sea ice, or perhaps even reverse its longer-term decline. Raised sea ice in this region would lift windstorm losses. Figure 6: The sum of sea ice area in Barents and Kara Seas for December and January. Source: NSIDCUncertainties in the Outlook There are significant uncertainties in the multiannual forecast: Could the known drivers evolve unpredictably, in this time of changing climate? Could an unexpected climate process, such as a mode of tropical variability, or ongoing anthropogenic forcing of the stratosphere, or simply random variability, emerge to dominate? Will an explosive volcanic eruption occur, to raise windstorm risk for the following few years? Summary The continental-scale windstorm lull in the first decade of this century continued through the past ten years, with notable regional variability. There have been several advances in understanding mid-latitude storm climate variability: Heat anomalies in the North Atlantic Ocean, underneath the storm-track, affect winter storminess in the Atlantic sector Heat anomalies in the northern North Atlantic modulate Arctic sea ice, notably in the Barents and Kara Seas Barents and Kara sea ice modulate the Siberian High to affect European storminess Both observation-based analyses and fit for purpose climate models support these processes In brief, heat anomalies in the North Atlantic Ocean and Arctic regions explain at least half of the recent multidecadal change in storminess. The best estimate for the next few years is a slight upward trend in windstorm activity, with significant uncertainty. The new challenge for insurance is how to benefit from climate forecasting skill, while maintaining safe management of European windstorm risk. We explore this in an upcoming RMS white paper. Debate is positively encouraged, please contact our Product Manager Michele.Lai@rms.com in the first instance.…

Stephen Cusack
Stephen Cusack
Senior Director, Model Development

Stephen is a Senior Director in the Hazard Climate team. After joining RMS in 2009, most of Stephen’s focus has been on researching and developing the Europe Windstorm (EUWS) model, with particular focus on the hazard. Stephen also spent 18 months leading the recalibration of the U.S. and Canada Severe Convective Storm model, released in January 2014. Before RMS, Stephen worked in a wide variety of research and development posts during 13 years at the U.K. Meteorological Office.

cta image

Need Help Managing Your Portfolio?

close button
Overlay Image
Video Title

Thank You

You’ll be contacted by an Moody's RMS specialist shortly.