Examining the European Windstorm Outlook This Winter
Stephen Cusack
Laurent MarescotNovember 06, 2020
The 2020–21 European windstorm season kicked off with Storm Alex in early October as a microcosm of this century so far, promising great winds then delivering a lot of water. The previous winter saw many similar weak windstorms, with just one notable event in Ciara/Sabine causing roughly €1.5 billion in losses in February. Will this season extend the run of relatively benign winter winds, or will we see a return to the stormier 1980s and 1990s?
In the first part of this blog, we will look at the indications for the storminess across Europe this winter. The forecast is completed by a discussion of its uncertainties, which leads to the second part: What is the reliable view of risk for European windstorm? The basis for the long-range outlook is described in an RMS® review of the latest scientific literature on European windstorm activity, made available to clients earlier this year.
Distinguishing cause from effect can be difficult in the climate system, and as a result, many different drivers of winter climate have been proposed. We will focus on four main European winter drivers, which together account for most of the predictability:
El Niño-Southern Oscillation (ENSO): a two- to seven-year cycle of changing east-west heat gradients in the tropical ocean and atmosphere, which modifies extratropical winds
Quasi-Biennial Oscillation (QBO): a 28-month cycle of wind changes in the tropical stratosphere, perturbing the polar vortex, hence European storminess
Solar flux: changes in ultraviolet radiation following solar cycles (chiefly 11 years, and longer term) modify stratospheric heat and winds, affecting polar vortex, hence midlatitude storminess
Arctic sea ice: more ice means a colder polar air mass, which in turn is one of two basic ingredients of storms (the other is warmer southern air mass); sea ice in the Kara and Barents Seas may be particularly relevant to European windstorm by regulating the strength of the Siberian high
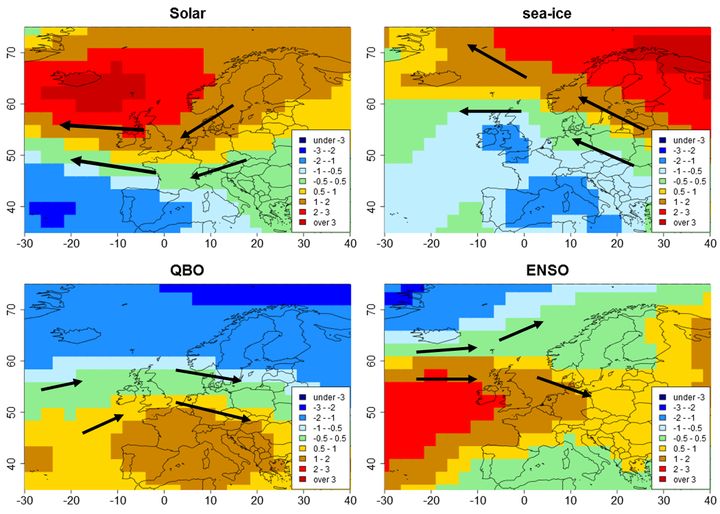
The expected impacts of these four drivers on European weather this winter are portrayed in Figure 1 (below), which shows the predicted change in mean winter surface pressure from its long-term climatology (“pressure anomaly”). Black arrows show the mean surface wind anomaly corresponding to such pressure anomalies; when pointing from west to east they indicate a strengthening of the mean westerlies, hence more storminess, and vice versa.
Both the solar and sea-ice drivers are expected to produce an easterly wind anomaly through the windstorm domain, implying less storminess, while the QBO and ENSO favor westerly anomalies and increased storm activity. How will all these drivers combine into the single realization this winter?
Figure 1: Expected change in mean winter surface pressure (contours, in hectoPascals) produced by each of the four major drivers this winter, based on historical experience. The anomalous surface wind is depicted by black arrows.
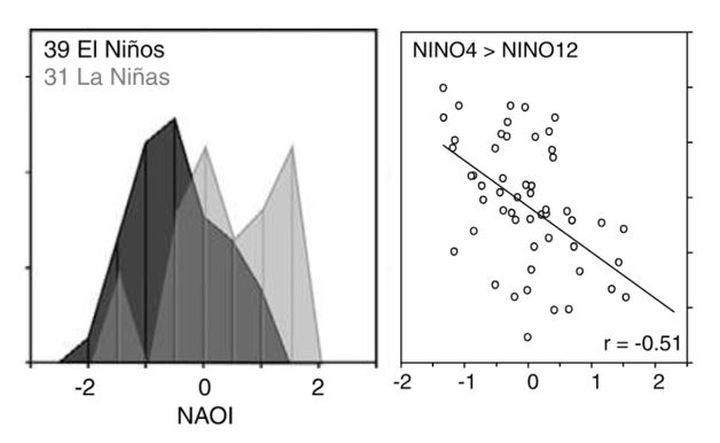
At first glance, the easterly anomalies from solar and sea-ice forcing look like they may be larger than the westerly (stormy) anomalies from QBO and ENSO. This simple view tacitly assumes the impacts from various drivers combine linearly. However, some published work undermines this assumption. Labitzke et al. (2006) found a remarkably nonlinear interaction between solar flux and QBO in the Arctic winter (see their Figure 3).
The coupling of the polar vortex with European winter weather indicates we need more insight into the interactions between these drivers before confident predictions can be made. Perhaps the most that can be said is that the upcoming winter may be less stormy than the long-term average, and that the state of research means the true outcome is highly uncertain.
What Is a Dependable Reference View?
The above analysis leads to a couple of questions: Will the RMS reference view continue to use all available storm information since the early 1970s to represent the longer-term storm climate? Or should the current climate variability view (CVV), innately more weighted to the recent lull, be considered as a reference view?
The short answer to the second question is no. A candidate for a reference view must offer a robust and reliable perspective on potential storm activity over the next few years. The most recent RMS update on multidecadal variability found growing understanding of the decline from the stormy end of the twentieth century to the twenty-first century lull. However, predictions of future storminess at decadal scales contain several sources of uncertainty, including:
Incomplete understanding of known multidecadal drivers.
High risk that new, unknown drivers could dominate in the future, a concern heightened by a changing climate, and a limited study size of a single multidecadal cycle.
An unpredictable major eruption of a tropical volcano could dramatically raise windstorm risk in the two or three following winters.
The past multidecadal cycle has important regional-scale variations that are not replicated by the current generation of climate models.
Noise in the climate system could overwhelm deterministic forcings.
Using the CVV as a reference view is essentially assuming that future storm rates will be more like the recent lull, and that the stormy 1980s and 1990s are less likely to occur than long-term experience suggests. Such an expectation for future storminess amounts to a forecast, and the multiple sources of uncertainty listed above explain why such a prediction is inherently risky.
In addition to meteorological uncertainty, the losses are highly sensitive to storm location – whether a storm tracks over an area with a high concentration of exposure (read this RMS blog on different scenarios for Storm Lothar in 1999). In short, the reference view based on storm events since the 1970s is a more robust and reliable view of the next few years of windstorm risk. We will continue to review this situation for changes and improvements to our understanding of decadal-scale variability.
RMS is currently redeveloping our Europe Windstorm Model using the most modern science and data. However, the model will not be available prior to 2022. In this update, rather than using less storm data, the current plan is to boost the length of the historical record used in the reference view and calibrate it to a wind climate that includes all storms since the current model was released.
RMS recently released to clients an updated catalog of significant historical windstorms up to 2018 that can be analyzed in RiskLink® as footprint files. The impact of adding the most recent years to the wind loss climate can be approximated by comparing their losses with storms from the 1980s and 1990s.
In summary, the main seasonal drivers of European windstorm activity indicate a quieter year – but with significant uncertainty. Also, going forward, RMS strategy will be to provide a CVV view of risk for sensitivity studies in addition to a more reliable reference view calibrated to the long-term storm climate. Eventually, different views of risk can be used to inform business decisions, but this should always be made in full understanding of the underlying assumptions and uncertainties.
Tanja Dallafior – Modeler, Event Response, RMS
Michèle Lai – Product Manager, Model Product Management, RMS
Tom Sabbatelli – Manager – Event Response, RMS
A typical European windstorm season usually spans from October to March, with a peak of activity during the winter months. But with a quiet and sunny February, due to a strong blocking situation in Western Europe, had spring arrived? No, Mother Nature decided differently, and March came with its series of windstorms, and although March is not over yet, let’s look at what has happened so far.
What’s in a Name?
March 2019 started with the formation of a westerly weather pattern that prevailed until March 16-17, and an unstable atmospheric situation that brought a series of eight spring storms passing through Europe in just over two weeks. This series of storms brought damage and disruption across Europe, with uprooted trees, power outages, transport interruptions on road, rail, and in the air, injuries and even fatalities were reported.
Though from the European media, you’d be forgiven in thinking there were many more storms. Naming weather systems to help communicate its associated potential dangers has become general practice for many national meteorological services. But with each agency, from The Free University of Berlin, the U.K. Met Office and Spain’s weather agency, giving names to storms that cross their country, the same storm system can acquire several names as it passes through different countries. The table below leads with the German storm name unless indicated.
Storm Eberhard
Storm Eberhard had the most widespread impact, with its track extending the furthest south of all the storms seen during the first half of March, according to the German Meteorological Service (DWD). On Sunday, March 10, this area of low pressure crossed northwest Europe bringing severe gusts to parts of the southern U.K., northern France, Belgium, Netherlands, Luxembourg, south-central Germany, Czech Republic, and southern Poland.
Several houses lost roofs or had tiles blown away. Major rail disruptions prevailed for days in Germany and traffic jams extended for hundreds of kilometers in North-Rhine Westphalia and other regions of Germany. Several hundred thousand customers in the Czech Republic and Poland were without power.
How Bad was Storm Eberhard?
In our early event response client summaries, RMS uses storm and damage information across a wide variety of sources to provide clients with an initial indication of impact as more detailed reports still emerge. In the immediate aftermath of Eberhard, damage information was sparse, limited primarily to tree fall and disruption to rail and airline networks.
As the RMS Event Response team continued to monitor the latest developments in the days that followed, we use a series of thresholds that must be met in order to enact distinct levels of response, which includes modeling tools and insurance industry loss estimates. These thresholds ensure we provide resources for events with the greatest market interest. What was interesting in this specific case, was while recorded wind gusts at many weather stations were significant, this did not appear to immediately translate into physical property damage.
Indeed, this uncertainty is apparent in the several industry loss estimates released days after the storm, which ranged between “significantly less than €500 million” and €800 million. Several days later, a risk modeler issued a loss estimate in excess of this range, extending the uncertainty further.
For RMS, it is important that our response reflects all data sources – especially when the data is conflicting – and not just pure modeling. Our internal work leans towards the lower end of the loss range currently in the market and this falls below our typical threshold of further response. However, we continue to monitor developments and engage with our clients as claims come in to consider improvements to our process.
Were This Year’s March Storms Exceptional?
European windstorms follow a strong seasonality with peak of strongest activity during the winter months – December to February, and lowest activity in the summer. This is due to the initial conditions required for their formation. European windstorms, or extra-tropical cyclones, form in areas where warm air masses from the south meet cold polar air masses, typically in the beginning of the winter, when oceans are still warm but polar air is already cold. Only about 11 percent of European windstorms occur in March, compared to 25 percent and 15 percent in January and February, as shown on this figure below.
So far, March 2019 brought eight small to medium-size windstorms; which may seem excessive. But these are essentially eight named low pressure systems, and not all of them produced damage, and only two or three of them could be important enough for the insurance industry. This high number of events is unusual but not unprecedented: in 2008, a series of three March windstorms were recorded – Emma, Johanna and Kirsten, with respective losses of about €1.3 billion, €180 million and €245 million each. These losses should be higher than what we are observing in March 2019.
According to the RMS Europe Windstorm Models, there is about a 25 percent chance of having two windstorms in March in Europe (20 percent of three storms). From the loss perspective, March 2019 did not stand out either. We don’t yet know what the final total losses for this series of storms will be, but if we are looking at the lower end of the loss ranges, we see that losses resulting from these March European windstorms having more than 60 percent chance to fall into that bucket.
Looking Back at the Outlook
At the beginning of the season, our colleague and European windstorm expert Stephen Cusack published a forecast summary for the 2018/19 winter season. Seasonal forecasts always come with an amount of uncertainty. The blog article reported that “meteorological indicators point to a less stormy North Atlantic” compared to the previous 2017/18 season. The season is not yet over, but the storm activity until now seems to support this forecast, despite this uptick in the month of March.
To help clients assess risks related to Europe Windstorm, RMS offers:
Models providing a long-term reference view of risk as well as an additional Climate Variability View. The latter allows users to understand the uncertainty around the current period of low windstorm activity in Europe and evaluate the models against shorter-term loss experience.
Updated view of Europe Windstorm clustering. As the stormy episode of March 2019 shows, clustering is important feature to modelling this risk.
In 2019, RMS releases a new set of 18 historical event footprints, completing the historical storm catalog up to 2018.
RMS is working on the next generation of its Europe Windstorm Models, which will leverage new HD technology, allowing clients to benefit from all features of this new framework, such as temporal and ground-up simulation, 4-parameter vulnerability or bespoke hours clauses.
Stephen is a Senior Director in the Hazard Climate team. After joining RMS in 2009, most of Stephen’s focus has been on researching and developing the Europe Windstorm (EUWS) model, with particular focus on the hazard. Stephen also spent 18 months leading the recalibration of the U.S. and Canada Severe Convective Storm model, released in January 2014. Before RMS, Stephen worked in a wide variety of research and development posts during 13 years at the U.K. Meteorological Office.
Senior Director, Market and Product Specialists, RMS
Laurent is a catastrophe risk management expert at RMS, advising some of the largest companies in the (re)insurance industry how to best manage their nat cat, agriculture, cyber and terrorism risks. He also interacts as an expert for governmental and regulatory authorities. Laurent initially joined RMS in 2008 as part of the account management team, servicing the European (re)insurance and ILS market. He then headed the model product management group for all EMEA and APAC climatic/weather risk perils, such as windstorm, typhoon, severe convective storm and flood, as well as RMS global agricultural risk.
Prior to RMS, Laurent worked 3 years at the Swiss Federal Institute of Technology Zurich (ETHZ) as a Research Associate and Lecturer, managing multidisciplinary research projects. Laurent still lectures regularly on catastrophe modeling and insurance risk quantification at universities and gives seminars and invited talks in international industry conferences. Laurent co-authored numerous industry publications, peer-reviewed scientific articles and proceeding papers. He holds an MSc in Geology from the University of Lausanne and a PhD in Geophysics from the University of Lausanne and the University of Nantes.