The Blizzard of 2016: The Historical Significance of Winter Storm Jonas
Ryan LeddyFebruary 09, 2016
Many of us in the Northeastern U.S. can remember the Blizzard of 1996 as a crippling winter weather event that dumped multiple feet of snow across major cities along the I-95 corridor of Washington, D.C., Philadelphia, New York City, and Boston.
20 years later, another historic winter storm has joined the 1996 event in the record books, this time occurring in a more socially connected world where winter storms are given names that share a resemblance to a popular boy band (thanks to the naming by The Weather Channel of Winter Storm Jonas).
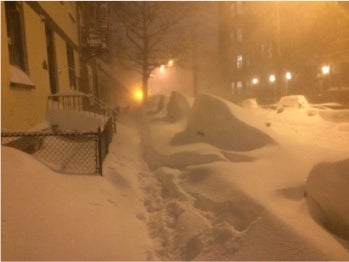
Blowing and drifting snow on cars parked in an unplowed street in Hoboken, New Jersey at the height of the storm. Credit: Jeff Waters, Meteorologist and resident of Hoboken from RMS
The Blizzard of 1996 saw (in today’s terms) an economic loss of $4.6 billion as well as insured losses of $900 million for the affected states, which corresponds to a loss return period within the RMS U.S. and Canada Winterstorm Model of roughly 10 years. Many of the same drivers of loss in the 1996 event were evident during Winter Storm Jonas, including business interruption caused by halted public transportation services in cities like Washington, D.C., and New York City, as well as coastal flooding along the New Jersey shorelines.
The Blizzard of 2016, dropped as much as 40 inches of snow in some regions of the Mid-Atlantic, causing wide scale disruption for approximately 85 million people, including over 300,000 power outages, cancellation of almost 12,000 flights, and a death toll of at least 48 people. The table below summarizes snowfall amounts for this year’s storm from three major Northeast cities as it compares to similar historic winter storms. These ranges of snowfall correspond to a 10-25 hazard return period event for the affected areas, according to RMS.
U.S. CityBlizzard of ’16Blizzard of ’96Snowpocalypse ’10February 2006
Philadelphia
Philadelphia 22.4in/567mm 30.7in/780mm 8.5in/724mm 12.0in/305mm
There were warning signs in the week leading up to the event that a major nor’easter would creep up the east coast and “bomb out” just offshore. This refers to a meteorological term known as “bombogenesis” in which the pressure in the center of the storm drops rapidly, further intensifying the storm and allowing for heavier snow bands to move inland at snowfall rates of 1-3 inches per hour.
One of the things that will make the Blizzard of 2016 one to remember are the snowfall rates of more than 1” per hour that affected several major cities for an extended period of time. According to The Weather Channel, “New York’s LaGuardia airport had 14 hours of 1 to 3 inch per hour snowfall rates from 6 a.m. Saturday until 8 p.m. Saturday.”
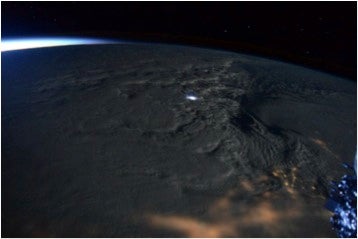
Another unique aspect of the storm was the reports of a meteorological phenomenon known as “thundersnow,” which according to the National Severe Storms Laboratory (NSSL), “can be found where there is relatively strong instability and abundant moisture above the surface.”
The phenomenon known as “thundersnow” was reported during Winter Storm Jonas and was captured by NASA astronaut Scott Kelly in this picture of lightning taken from a window on the International Space Station. Credit: NASA/Scott Kelly via Twitter (@StationCDRKelly)
Time will tell how the Blizzard of 2016 compares to historic storms like the Blizzard of 1996 from an economic loss perspective, but the similarities in terms of unique weather phenomena as well as the heavy snowfall amounts across the major Northeastern U.S. cities will keep Jonas in the conversation.
An event like Winter Storm Jonas, coupled with the crippling Boston snowstorms from last year, makes it very important for those of us in the catastrophe risk space to understand its drivers and quantitative impacts. Fortunately, weather forecasting capabilities have improved substantially since the Blizzard of 1996, but its important to further understand the threats that winter storms pose from an insured loss perspective. Please reach out to Sales@rms.com if you are interested in learning more about RMS and our suite of winter storm models.
At RMS, Ryan is responsible for guiding the insurance market’s understanding and usage of RMS models with a main focus of North America, Southeast Asia and Japan earthquake.
Ryan joined the Model Product Management team at RMS in late 2015 after four years as a Sales Consultant within RMS Client Development. In his current role, he assists the development of RMS model release communications and strategies, and regularly interacts with internal and external industry constituents on RMS model releases, updates, and general model best practices.
Ryan holds a BS in meteorology from Penn State University and an MBA from Rutgers University with concentrations in Global Business and Strategy.