Will Summer 2022-23 Result in a Season of Tropical Cyclones and Floods for Australia?
James CosgroveNovember 24, 2022
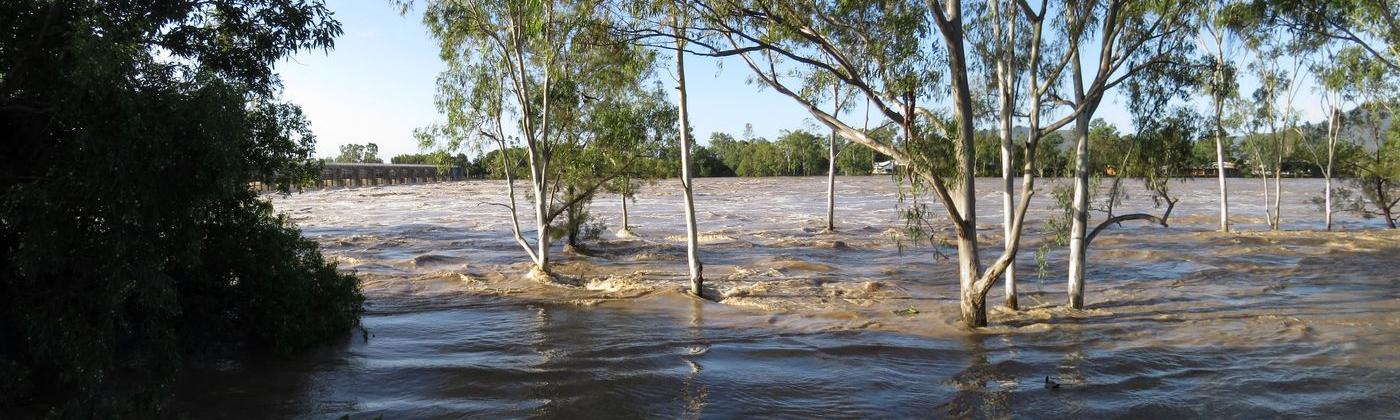
October to April represents the peak period for extreme weather in Australia, with the risk of flooding, tropical cyclones, bushfires, and severe thunderstorms typically higher than at any other time of the year. And looking at this season’s latest outlook it indicates a potentially wet and windy summer for parts of Australia, with an increased risk of tropical cyclones and flooding.
Heightened Tropical Cyclone Risk
With tropical cyclone activity in the Northern Hemisphere now winding down for the year, meteorologists now turn their attention down under, as the 2022–23 Australian tropical cyclone season gets underway, a season that started on November 1 and runs for six months to April 30.
An average season sees 11 tropical cyclones form within the Australian region. This region encompasses the seas and oceans that surround Australia including the southeast Indian Ocean, Timor Sea, Banda Sea, Arafura Sea, Gulf of Carpentaria, Coral Sea, and the Tasman Sea.
During an average season, four tropical cyclones make landfall in Australia, and at least one has crossed the Australian coastline in every season since reliable records began in the 1970s.
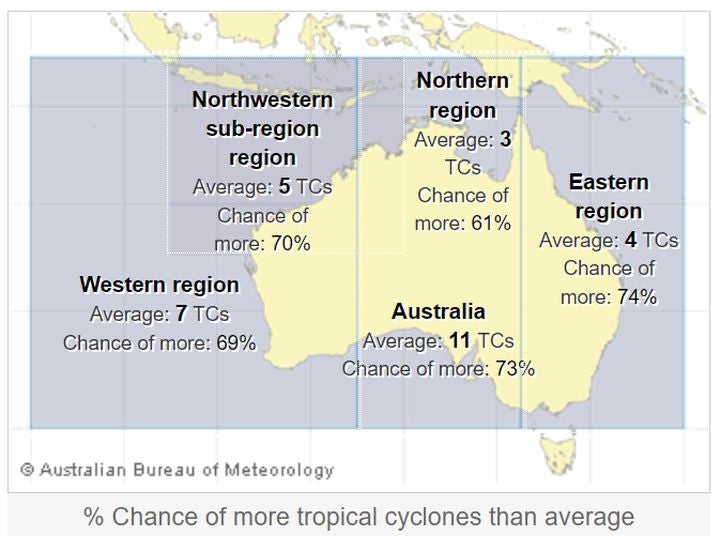
For the 2022-23 season, the Australian Bureau of Meteorology estimates an above-average number of tropical cyclones (see Figure 1), with a 73 percent chance of more tropical cyclones than average, and a 27 percent chance of fewer than average.
Figure 1: National and regional outlook for the 2022-23 Australia tropical cyclone season. Source: Australian Bureau of Meteorology
The forecasts for an above-average season reflect the influence of several key oceanic and meteorological factors, including the El Niño–Southern Oscillation (ENSO), the Indian Ocean Dipole (IOD), and the Madden-Julian Oscillation (MJO).
The La Niña phase of the ENSO officially developed in September 2022 and sees cooler-than-average sea surface temperatures in the central tropical Pacific. Most seasonal forecasts favor La Niña conditions prevailing until early 2023, meaning that warmer-than-average sea surface temperatures are expected to remain in the Tropics surrounding Australia throughout the season.
Warmer sea surface temperatures typically enhance tropical cyclone activity by providing increased energy and moisture to the environment, and this would mark the third consecutive Australian summer where La Niña conditions have prevailed and influenced the region’s tropical cyclone season.
While tropical cyclone activity in the Australian region has large interseasonal variability due to the influence of naturally occurring climate factors, including ENSO, the number of tropical cyclones in the Australian region is generally higher during La Niña seasons.
Further, the first landfalling tropical cyclone on the Australian coast typically occurs earlier than normal in La Niña years, around the middle of December, whereas during non-La Niña years, the date of the first tropical cyclone Australia landfall is typically early January.
Sea surface temperatures in the Indian Ocean may also impact the Australian region’s tropical cyclone season. The Indian Ocean Dipole (IOD) measures the difference between sea surface temperatures in the tropical western and eastern Indian Oceans.
During its negative phase, as is currently observed, there are warmer than average temperatures in the eastern Indian Ocean and cooler than average temperatures in the western Indian Ocean. This typically results in stronger westerly winds across the Indian Ocean and greater convection near Australia.
This oceanic-meteorological setup, combined with the La Niña conditions in the central tropical Pacific, can often result in an increased probability of cyclogenesis in the Australian region.
Like the North Atlantic and Western North Pacific Basins, tropical cyclone formation in the Australian region is rarely spread consistently throughout the season. Quiet periods are followed by bursts of activity typically associated progression of the Madden-Julian Oscillation (MJO).
The MJO is an intraseasonal, eastward-propagating area of enhanced and suppressed tropical convection that provides a large-scale environment that is either favorable or unfavorable for tropical cyclone development. The MJO is the major driver of both fluctuations in tropical weather on weekly to monthly timescales and of the intensity of the North Australian Monsoon, which in turn can promote cyclogenesis.
The impact of the MJO and its relative timings cannot be skilfully predicted at seasonal timescales and therefore its impact on the 2022–23 Australian tropical cyclone season remains uncertain.
East-West Rainfall and Flood Risk Split
Alongside its forecast of an above-average tropical cyclone season, the Bureau has also warned of a generally wetter summer for Australia’s eastern states. We have already seen widespread flooding in four states during mid-November after extensive rainfall.
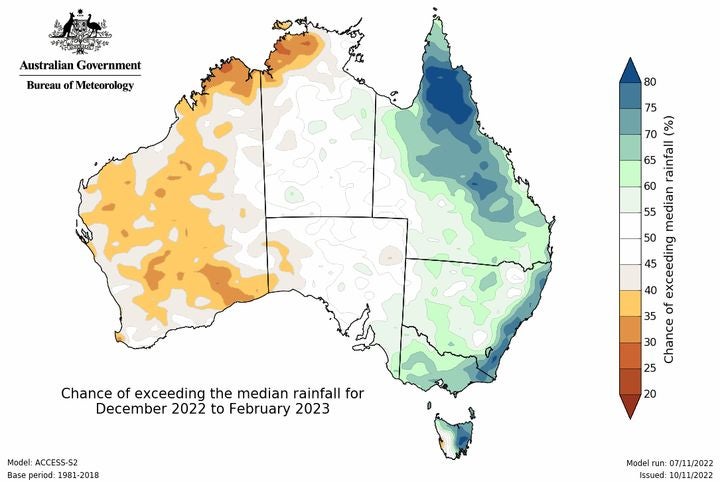
For the summer period between December to February, above median rainfall is likely for the Cape York Peninsula, the majority of eastern Queensland, areas east of the Great Dividing Range of New South Wales, and most of Victoria and eastern Tasmania.
Some areas have a greater than 80 percent chance of exceeding the median total. Per the Bureau’s seasonal outlook, northern Queensland has at least twice the average chance of unusually high rainfall over the next three months. Conversely, below-median rainfall is expected for large parts of Western Australia and the western Top End, with a heightened risk of bushfires in these regions.
Figure 2: Map of Australia illustrating the chance of exceeding median rainfall for December 2022 - February 2023. Source; Australian Bureau of Meteorology
While localized flooding can occur in any Australian wet season (October to April), there is an increased risk of widespread and prolonged riverine flooding across northern and eastern Australia this summer. Rivers are already at high levels, dams are full, and catchments are largely saturated across much of eastern Australia, meaning that any significant rainfall accumulation over the next three months has the potential to result in flash- and river flooding.
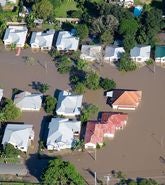
This warning comes less than a year after Australia experienced its costliest flood event on record. Three East Coast Lows in succession across two weeks in late February and early March 2022 broke rainfall, river, and flood-depth records across parts of New South Wales and Queensland.
Over 20,000 properties were inundated in southeast Queensland alone, and the event generated 234,252 insurance claims at an estimated cost of AU$5.45 billion (US$3.48 billion), according to the Insurance Council of Australia, making it the second-costliest catastrophe in Australia on record, second only to the 1999 Eastern Sydney Hailstorm.
All the signs are pointing towards a potentially active few months of catastrophic events in Australia, and only time will tell how this plays out. With the RMS® Australia Cyclone Model and RMS Global Flood Maps, RMS Event Response stands ready to provide regular updates on events in Australia as the summer unfolds and to assist (re)insurers should a significant event occur in the region this year.
Based in London, James is an Assistant Director within Moody's RMS Event Response team, supporting real-time event response operations and assisting on various event response projects. James holds a bachelor’s degree in Physical Geography and Geology from the University of Southampton and a master’s degree in Applied Meteorology from the University of Reading.