Australian Floods: Insurance Claims Rise Higher Than 2011 Floods
Oliver SmithMarch 30, 2022
The Insurance Council of Australia (ICA) reports that the unrelenting recent severe rainfall and subsequent flooding across Queensland and New South Wales in Australia have generated 163,853 insurance claims as of March 25, at an estimated cost of AU$2.451 billion (US$1.84 billion).
Three East Coast Lows in succession across two weeks, from February 22 through to March 8, broke rainfall, river, and flood-depth records across parts of two vast states, at a time of heightened rainfall due to the continued influence of La Niña.
An East Coast Low is an intense area of low pressure that sees cold air in the upper atmosphere over the South Pacific mix with warm air over the Coral Sea bringing in significant moisture. As the system approaches the Great Dividing Range, areas east of the range receive prolonged heavy rainfall.
The first East Coast Low centered on Queensland – around Wide Bay and the Sunshine Coast, beginning February 22. A second system impacted New South Wales, around western Sydney and the nearby ranges, from March 1, and a third on March 6 reached greater Sydney and extended north to the Hunter region.
The Australian Bureau of Meteorology reported maximum accumulated rainfall totals of 1,500 millimeters (59.1 inches) in a week over eastern Australia. Flooding extended to many cities across over 1,000 kilometers (621 miles) of Australia’s eastern coast, including Maryborough on Queensland’s Fraser Coast and Gympie in the north, through to Brisbane and the Sunshine and Gold Coasts, to Lismore, and parts of Sydney in the south.
Brisbane and Lismore
In southeastern Queensland, more than 20,000 homes were inundated, many in Brisbane, with around 16,000 properties flooded. The city of Gympie saw 3,600 homes inundated. Flood-prone Lismore in northeastern New South Wales had a record-breaking flood, exceeding a 48-year record, with two-thirds of the city inundated.
The level of the Wilsons River reached 14.37 meters (47.15 feet) – more than 2 meters (6.6 feet) above the February 1954 record flood level of 12.27 meters (40.26 feet) – flooding Lismore and other towns on the river.
Around Sydney, areas including Richmond, Windsor, and Manly experienced extensive flooding in early March, followed by further flooding beginning on March 7 in Sydney’s southern and western suburbs. The M5 motorway tunnel in Sydney filled with floodwater, and the Warragamba Dam, Sydney’s main reservoir, was overspilling at a rate of 225 gigaliters a day.
Australia’s Prime Minister Scott Morrison declared a national emergency on March 9, the first time emergency powers have been used.
Most Expensive Flood Event
Insured losses have already risen higher than the 2011 Queensland floods, which had total claims of AU$2.1 billion (US$1.56 billion). On February 28, the ICA declared an insurance catastrophe, to help prioritize urgent claims and deploy emergency resources, and that this could be the most expensive flood event in Australia’s history. Claims volumes from Queensland were quickly followed by a surge in claims from New South Wales.
For some residents across the eastern coast, this could be the seventh time they have experienced the threat of flooding or inundation within 10 years. Across Queensland and New South Wales, 20 people were killed as a result of the floods. This included four killed in Lismore, which experienced a 1-in-500-year flood event.
Lismore, where a levee breach saw homes swept away as floodwaters reached seven meters (23 feet), had rebuilt the town just five years before, after suffering a 1-in-100-year flood event. News reports highlight that the insurance premium (excluding contents) for a retail store in Lismore was AU$18,000 (US$13,367) before the current floods. The media speculated whether relocating Lismore would be easier.
Insurers on the Front Lines
The recovery for flood-hit areas is underway, and insurance claims are still rising. It will take time to get the full picture of this catastrophe, as insurers and loss adjusters work through the volume of claims. This flood event comes at a time when the industry was starting to emerge from a hard market after recent losses from wildfire.
Lots of questions remain for the insurance industry, including policy wordings defining a storm versus a flood, whether this was a single event, and the implications for business interruption claims.
A more existential question is whether a backstop is required to cover these events. The federal government is under pressure to expand the AU$10 billion (US$7.43 billion) government-backed reinsurance pool targeted for cyclones and cyclone-related flooding in northern Australia to also include severe flooding events and fires.
Insurers are responding to the reality, and there will be an intense focus on risk selection and pricing for flood policies. For those insurers that are relying on previous claims experience or publicly available flood maps and data for risk assessment, the question needs to be asked as to whether this approach is enough.
Accommodating the granular nature of flood hazard is vital. While one property may have experienced inundation, another just down the road may be unaffected. RMS® develops flood maps globally, leaning on the same scientific expertise that goes into our full probabilistic risk models. Our flood maps in Australia have proven to effectively represent parts of the current event, providing flood extent and severity at multiple return periods at 30-meter resolution.
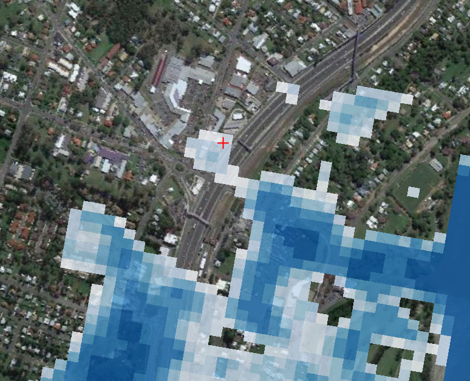
Click here to view a picture of flooding in the Queensland town of Goodna; the gas station in the image is marked with a cross on the RMS flood map below.
Figure 1: RMS flood map showing 500-year return period flooding in Goodna, Queensland. Gas station location is indicated with a cross.
Insights from the RMS Global Flood Maps can be delivered seamlessly either as stand-alone files, through the RMS Location Intelligence API or our exposure management application RMS ExposureIQ™. This can help (re)insurers proactively manage their exposure to flooding and deliver timely guidance on likely losses to individual portfolios, instead of reactively assessing damage in the aftermath of an event.
As the industry takes stock of the current floods, more effective flood risk analysis can help insurers identify risk accumulation hot spots, uncover opportunities, and offer competitive risk pricing that could help policyholders maintain coverage at this crucial time.
Access broad-scale, well-validated views of flood…
Learn More
Oliver Smith
Senior Product Manager, Data Product Management
Based in London, Oliver is a Senior Product Manager within the data product management team, responsible for overseeing the development and release of RMS data offerings across multiple peril regions and delivery vehicles. Oliver joined RMS in 2013 and has held roles in the Global Knowledge Center and Model Product Strategy teams prior to joining Product Management in 2016. Oliver is a Certified Catastrophe Risk Analyst and holds a bachelor's degree in Economics and Finance from Keele University.