Getting the Measure of Inflation for the (Re)insurance Industry
Matt BussmannJune 23, 2022
Since the early days of the COVID-19 pandemic, inflationary trends have captured news headlines around the world. Starting with the pandemic, by April 2020 more than 3.9 billion people across 90 countries had been ordered to stay at home by their governments. These lockdowns set off the first wave of price increases as manufacturing and shipping operations stalled, pinching global supply chains.
And since February 24 this year, as a consequence of the Russian invasion of Ukraine, supply constraints ranging from food to fuel have cascaded through global markets, further accelerating the pace of inflation. So, how will inflation impact (re)insurers, and how can inflation best be measured?
Examining the Consumer Price Index
In many economies, the most common measure of inflation is the Consumer Price Index (CPI) which defines the change in price across a typical basket of consumer goods. As indicators go, it is a good one. It is simply defined, with a stable methodology, and is highly relevant for consumer purchasing.
However, inflation also affects businesses, and the question currently hanging over the global (re)insurance industry is how rising prices will affect balance sheets. Property insurance claims are a function of the cost to repair or replace assets in the event of a loss: If construction costs increase, so do property insurers’ potential liabilities. In this context, are consumer prices really the appropriate benchmark for insurers?
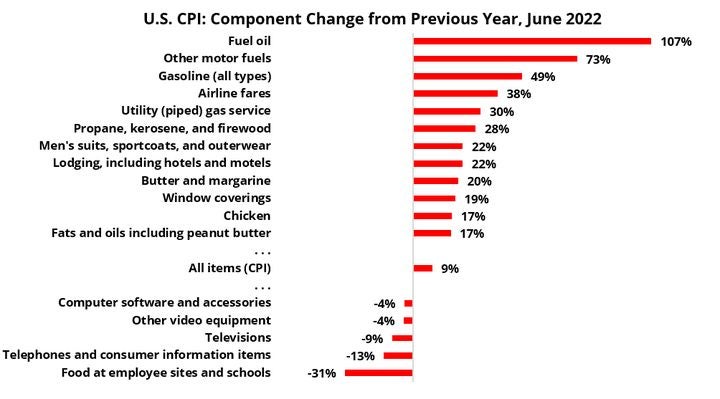
Figure 1: Year-on-year inflation for selected components of the U.S. CPI (Source: U.S. Bureau of Labor Statistics)
The U.S. CPI shows a steady increase across the last decade (Figure 2) at around one to three percent per year, until the COVID-19 pandemic. During this pre-pandemic period, there were no abrupt spikes or drops, and even over the last few years, the smoothness of the CPI line conceals volatility from individual goods in the basket. Some of these goods with especially high or low growth rates in the last year are shown in Figure 1.
Looking deeper into specific components of the CPI, it is evident that not all goods in the basket, especially those with extremely high or low growth rates, are relevant to property insurers. Several of these categories, for example, airline fares, men’s suits, and video equipment are relevant for consumer spending but have little bearing on construction costs.
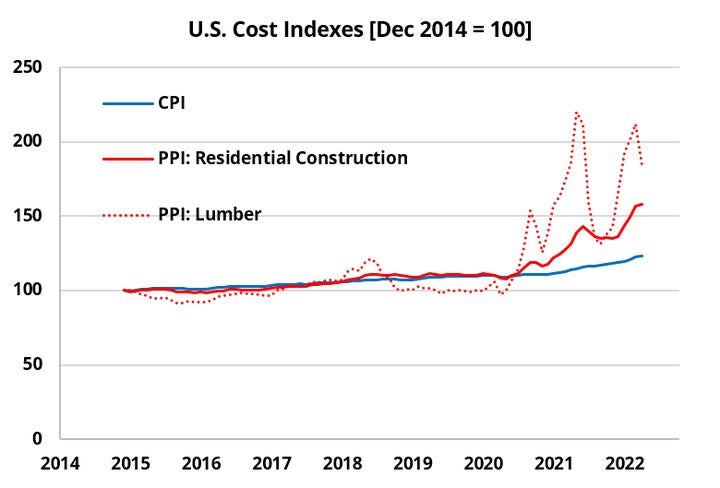
Therefore, we need to look for a more suitable index that focuses on a basket of goods sold by a specific sector, like the U.S. Bureau of Labor Statistics Producer Price Index (PPI) of residential construction inputs, shown in Figure 2.
Producer Price Index (PPI)
Since 2020, this index shows residential construction costs have been rising faster than general consumer inflation. However, this index is considerably more volatile than the overall CPI. There are notable intermittent deflationary periods in April-June 2020, October-December 2020, and July-September 2021, due to fluctuations in seasonal demand, COVID-19 lockdowns and mandates, as well as other economic stimuli.
Sector-specific price indexes like the PPI captures a more constrained basket of goods whose prices are more closely linked (for example, concrete and gravel). Focusing further on a single component within the construction index such as lumber reveals even more dramatic price movements.
Figure 2: U.S. Cost Indexes (Source: U.S. Bureau of Labor Statistics)
Construction Costs
In today’s market, construction prices are indeed rising, but how much of this inflation is permanent or durable in the long term is yet to be seen. Take the example of July to September 2018 when a spike in U.S. home construction after a series of landfalling hurricanes coincided with an existing shortage of lumber due to trade issues with Canadian suppliers.
Prices for cut lumber rose sharply, bumping residential construction costs to outpace consumer inflation for several months. However, as winter approached, demand for lumber fell and new sawmill capacity came online from the southern U.S. states, leading to construction prices falling back to previous levels.
What conclusions can we draw from this? The more specific a price index, the greater the internal correlation to prices among the basket of goods. When the prices of goods in an index move in unison, the volatility of that index increases.
For insurers quantifying the impact of inflationary trends on their book of business, it’s important to track an index with the appropriate level of specificity, like the PPI construction cost index, and understand not only long-term trends but the impacts of short-term fluctuations as well.
While consumer inflation and CPI appear to be on an unrelenting upward path globally, indices more relevant to property insurers show a more complicated picture. As supply chains come back to life and energy prices look for a new equilibrium, much of this story remains to be written.
As always, RMS is committed to continuing its research on these topics to help our clients and partners make sense of global trends in inflation. A recent RMS whitepaper, “Inflationary Trends in Construction Costs and Nat Cat Losses in Recent Events,” released in May describes many aspects affecting construction costs globally and their influence on recent natural catastrophe losses.
Clients can access the whitepaper via RMS OWL here.
References:
U.S. Bureau of Labor Statistics, Consumer Price Index for All Urban Consumers: All Items in U.S. City Average [CPIAUCSL], retrieved from FRED, Federal Reserve Bank of St. Louis; https://fred.stlouisfed.org/series/CPIAUCSL, June 11, 2022.
U.S. Bureau of Labor Statistics, Producer Price Index by Commodity: Inputs to Industries: Net Inputs to Residential Construction, Goods [WPUIP2311001], retrieved from FRED, Federal Reserve Bank of St. Louis; https://fred.stlouisfed.org/series/WPUIP2311001, June 11, 2022.
U.S. Bureau of Labor Statistics, Producer Price Index by Commodity: Lumber and Wood Products: Lumber [WPU081], retrieved from FRED, Federal Reserve Bank of St. Louis; https://fred.stlouisfed.org/series/WPU081, June 11, 2022.
Based in California, Matt joined RMS in 2013 after six years as a practicing civil and structural engineer. He now leads a team of data scientists and model developers, creating worldwide data sets of buildings and infrastructure exposed to natural hazards. His recent research has focused on global patterns of urban growth and expansion, and how these interact with future climate projections to determine areas at risk in coming decades.
He holds a bachelor's degree in Civil Engineering from Princeton University and a master’s degree in Civil Engineering from Stanford University and is a licensed Professional Engineer in California.