Taking the Guesswork out of Climate Change Metrics
Ben BrookesSeptember 08, 2021
The insurance industry is getting familiar with the brave new world of climate change metrics. Regulators and stakeholders are asking questions about the impacts of climate change in terms of increased losses on their portfolios – be it insured losses or reductions in asset values. From the U.K. Prudential Regulation Authority (PRA) Climate Biennial Exploratory Scenario (CBES) to the Task Force for Climate-Related Financial Disclosures (TCFD), (re)insurers are having to rapidly adapt and respond to requests for climate change metrics. But as many insurers will testify, these metrics are not straightforward to generate.
There is a lot to consider. One key term, the Representative Concentration Pathway (RCP) has certainly slipped into the insurer’s lexicon. Taken from the Intergovernmental Panel on Climate Change (IPCC) Fifth Assessment Report (AR5) published in 2014, RCPs map out how global mean surface temperatures will increase relative to preindustrial levels through to 2100, based on different climate futures.
The focus is on four scenarios – RCP2.6, RCP4.5, RCP6.0, RCP8.5 – that reflect the globe’s response to climate change. They range from RCP2.6 – a very stringent pathway with all carbon dioxide emissions reaching zero by 2100, to RCP8.5, a worst-case outcome where emissions continue to rise. The Sixth Assessment Report (AR6) Summary for Policymakers (SPM) has now also been published, presenting key findings of the Working Group I (WGI) contribution to the IPCC’s AR6 on the physical science basis of climate change.
RCPs and other similar scenarios are important as they provide a common baseline for how climate could evolve across future time horizons. One common misconception is that the RCPs are snapshots. In fact, they vary over time typically through to the year 2100. Taking each five-year period from 2020 until 2100 across four RCPs, there are 68 combinations.
Different Parameters Chosen for Climate Change Exercises
Regulators and industry bodies have often chosen different scenarios for their exercises. For example, the TCFD recommends looking at various scenarios including a two degrees Celsius or lower increase in global mean surface temperature relative to preindustrial levels, which can be mapped to the RCP2.6 or RCP4.5 pathways.
The PRA is currently using five scenarios, similar to Network for Greening the Financial System (NGFS) scenarios, which in turn can also be mapped back to the RCPs. There is not a consensus between regulators on the RCP/time horizons used, or the potential increases in global mean surface temperature to be considered. This adds to the work for insurers who must respond to multiple differing perspectives.
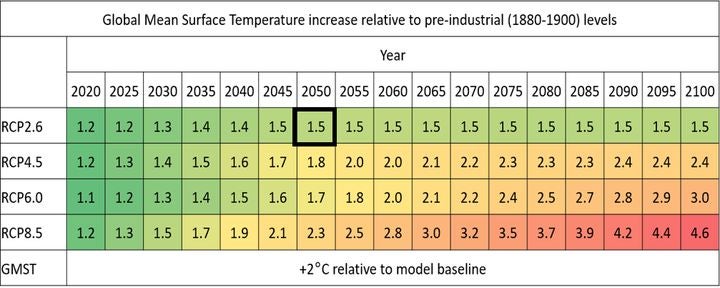
Here’s an example: Your business is asked to respond to a regulator request to assess the impact of climate change on U.S. hurricane losses. The regulator is seeking a stress test akin to a 1.5 degrees Celsius rise in temperature compared to pre-industrial levels, see Figure 1 below. This request lands on your desk, but where do you start?
Figure 1: Highlighted box represents a possible RCP/timeline for the Network for Greening the Financial System (NGFS) orderly scenario 1.5 degrees Celsius with carbon dioxide removal (CDR). Note how the wide range of temperature-increase scenarios could be used to respond to many different climate change perspectives.
Your extensive research across the available scientific literature looking at climate change and North Atlantic hurricane, alerts you to trends to consider. The literature does not match the time horizon and climate change scenario demanded by the regulator. Overall, you see that storm frequency could reduce, but of those storms, they will be more severe (Category 4–5) and larger in size. After much time and effort, by adjusting these parameters for landfalling hurricanes, you get a set of loss metrics.
Standardizing Climate Change Risk Modeling
Taking this ad hoc approach is exhausting. The results are hard to generate and equally hard to justify and explain. Furthermore, the parameters available to “stress” the present-day models are limited. For example, the scientific literature will typically cover anticipated changes in hurricane behavior across their full life cycle rather than at landfall. It is clear that a more standardized modeling approach is required.
Catastrophe risk models already represent the extremes of potential weather impacts and include suitably robust event sets with outcomes that are representative of millions of simulated years. Because of this we can use these broad and all-encompassing models to represent future risk scenarios as well.
Whatever extremes climate change might bring, we believe in general it won’t create hurricanes and floods that are beyond the extent of current modeling capabilities – this is the stuff of Hollywood and science fiction. Well-researched catastrophe models are an excellent tool to understand present and future climate risk, and this is why they are relied on so heavily by the companies holding that risk on their balance sheets as a major part of their societal function.
Over the past few years, RMS® has helped clients respond to regulator stress-test exercises, and we also started to explore the future impact that climate change could have on portfolios. As these requests from clients become more frequent, and as the threat posed by climate change becomes clearer, RMS wants to make climate change modeling for affected perils as robust, repeatable, and transparent as using a regular catastrophe risk model. And since the industry is already using catastrophe models, the results can feed seamlessly into business planning and long-term capital management considerations.
Insurers are starting to prepare responses for the CBES, so RMS is offering a package of regulatory support. With the introduction of three RMS Climate Change Models for North Atlantic hurricane, European windstorm, and European inland flood, we believe these models represent a major step-change for the industry in how it assesses climate change risk.
There is no denying that climate risk modeling is hard and getting it right is complex. These new RMS models incorporate all the latest and best science on climate change for a specific peril and have required major investment and expertise in applying the findings. This all fits into an existing model framework that assesses hazard, vulnerability, and financial loss costs to produce industry-standard metrics.
Stress Tests Become More Sophisticated
When the first climate change stress tests came through, the requirements were relatively simple, and using fairly crude approximations based on limited factors was the best that could be done. Tests such as the CBES are more sophisticated now, and taking shortcuts is not prudent. Results can be materially wrong, including being wrong in the wrong direction. You need to account for a broader set of factors, the same as for your regular risk modeling, which offers a much better representation of the potential risk to your specific set of exposures.
Let’s go back to the example of the request for metrics on North Atlantic hurricane. In addition to assessing landfalling hurricanes, RMS Climate Change Models look at increases in storm frequency and severity, and also storm size and storm track locations, including whether they are westward or recurving paths. The behavior of storms across the full life cycle is covered.
Compared to only examining frequency and severity of landfalling storms, this combined view results in higher average annual loss (AAL) changes for three illustrative portfolios. Industry approaches don’t work either – no two portfolios are the same, and an assumption of “industry-like” climate change impacts can also be dangerously wrong.
The Risk of Getting It Wrong
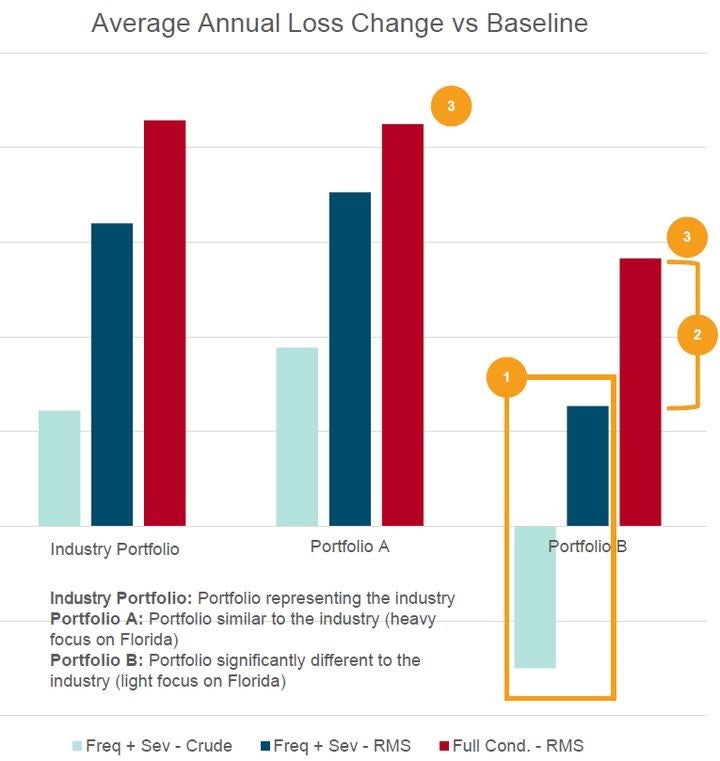
To illustrate, Figure 2 shows the AAL impact of these different approaches. The light-blue bar represents a crude frequency and severity adjustment. This applies frequency and severity changes reported in scientific literature across the full life cycle of hurricanes to hurricane landfall characteristics (which are more commonly used in “traditional” catastrophe modeling).
The dark-blue bar shows a more nuanced frequency and severity adjustment that applied the same frequency and severity changes but based on life-cycle-wide (rather than landfall-specific) storm characteristics, in line with the methods used in underlying scientific literature. The red bar is the full climate-conditioning approach across frequency, severity, size, track location, and curvature.
We have then applied these approaches across three illustrative portfolios. The first portfolio represents the overall industry. The second, portfolio A, is similar to the industry portfolio (i.e., a heavy focus on Florida). The third portfolio, portfolio B, differs significantly from the industry (i.e., “Florida-light”). What are the results? Looking at the chart, note how the crudest approach (label 1) can be wrong, in the wrong direction, and also how industry-wide statistics can grossly misrepresent impacts on specific portfolios, in this case, portfolio B (labels 2 and 3.)
Figure 2: Changes in average annual loss (AAL) for three illustrative hurricane portfolios, using three adjustment/modeling approaches
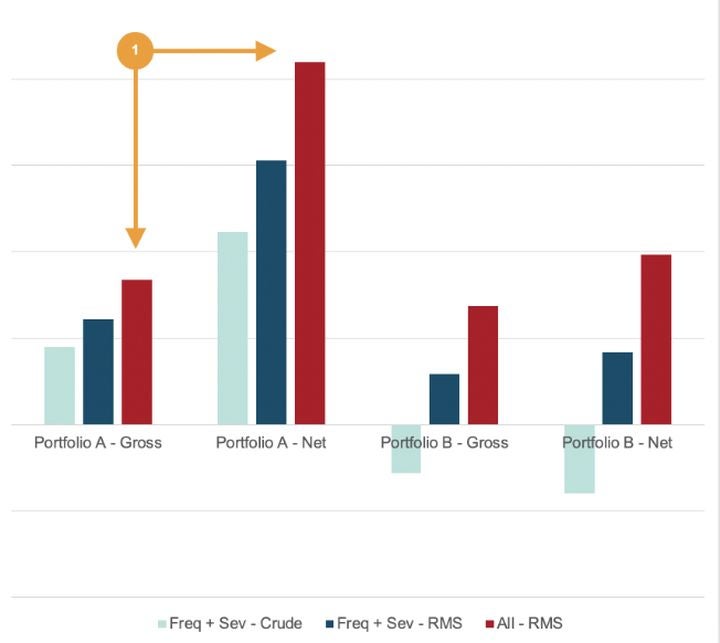
This AAL perspective is only a starting point. If we were to assume some simple reinsurance structures and model a net loss perspective, these variances could be amplified significantly. Figure 3 shows how the results for portfolios A and B vary at the 1-in-200-year return period. Note how even an “industry-like” portfolio sees a significant shift in climate change impact in the tail of the curve (label 1).
Figure 3: A 1-in-200-year gross/net loss change vs. baseline for two example hurricane reinsurance portfolios using three adjustment/modeling approaches
Moving Climate Change Risk Modeling to the Mainstream
The other significant issue that these new models look to address is the need for insurers to include climate change risk modeling in their standard risk management practices and move away from conducting ad hoc analyses. The complexity of the risk means that the use of crude methodologies will not be viable moving into the future.
Through the adoption of RMS Climate Change Models, (re)insurers can conduct an analysis based on a wide range of RCP/timeline combinations – using the best science, and delivering industry-standard metrics based on your portfolio. Response times to regulator exercises or to develop internal views will be cut dramatically as the modeling is available when you need it.
Climate change risk analysis moves away from just being a response to regulator requests, and it now enables your business to explore and understand the climate change risk drivers and hot spots in your portfolio over the next 5–15 years and beyond.
These Climate Change Models and a wider suite of RMS climate change solutions, such as consulting and regulatory reporting, are all ready to support the insurance industry – to address immediate needs and build a long-term, sustainable approach to climate change metrics.
As head of Moody's Consulting Services team, Ben oversees the services work that helps customers maximize the benefits of working with Moody's RMS models, data, and applications. He leads a multi-disciplinary services team, comprising nearly 50 individuals with a combined market experience of more than 200 years.
Ben's leadership role covers all areas of the market, from implementation and technical consulting to on-board and deploy Moody's solutions, to process and workflow engagements that help drive the significant business benefits that flow from a robust view of risk, and through to the quantification of risk to support risk transfer, including innovative forms of risk packaging.
During his 16 years with Moody's, Ben has led numerous services teams, and business development for establishing best practices in new markets for the business, such as public sector and broad financial services. Ben is closely involved with the significant investments that Moody's makes in climate change. Ben holds an MEng in engineering mathematics from the University of Bristol.