New Ways of Modeling Property-Liability Clash and Uncovering Hidden Risk
Katerina ChristopoulouFebruary 03, 2020
Natural disasters and other large catastrophes can trigger huge economic losses potentially among multiple insurance lines. RMS, in collaboration with research partner Cambridge Centre for Risk Studies at University of Cambridge, have developed eight template scenarios that model liability clash triggered by natural or man-made catastrophic events.
This research was primarily focused on property–liability clash modeling and was the continuation of the two-year Global Exposure Accumulation and Clash (GEAC) project. GEAC laid the foundations for a risk data schema for the various insurance lines, as well as an approach to modeling insurance clash among life and non-life insurance. Please see here for more information.
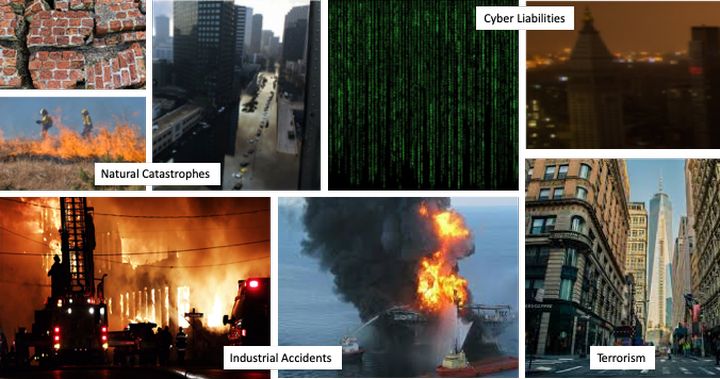
The project resulted in liability loss assessments for various scenarios including natural catastrophes, cyber and terrorism (see Figure 1 below). Although these scenarios are extreme, they are well within the realm of possibility and are aimed at stressing the various types of liability insurance.
Figure 1: GEAC Scenarios
Each of these scenarios has been implemented as a model template that follows a common structure, including a primary stochastic event along the lines of the 200-year return period (RP) loss based on RMS’ modeling of economic property loss and a narrative explaining the event. The templates also include indicative coverage trigger pathways (CTP) and ground-up loss estimate calculations by liability coverage type. CTPs are sub-narratives for each of the loss triggering liability insurance types and provide details for the coverage specific loss modeling and mechanisms by which claims could arise.
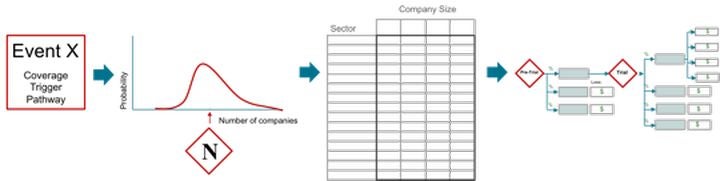
Figure 2: Litigation Loss estimation
A central feature in the loss methodology framework (Figure 2 above) is the legal settlement model that allows the litigation loss estimation. The model produces different outcomes based on which legal costs and four types of payouts are estimated as appropriate. The payouts considered are settlement amounts, special damages, general damages and punitive damages. The costs of legal proceedings were not included in the modeling.
To understand this better, the following example considers the effects of a catastrophic wildfire scenario:
U.S Wildfire
In recent years, California has experienced larger, more frequent and destructive wildfires that pose a significant risk to insurers and have implications on property and liability lines. In 2018 alone, there were 8,054 wildfires in California with the most destructive one in the state’s history being the Camp Fire (Cal Fire) that broke out on November 8, 2018, in Butte County, about an hour’s drive north of Sacramento.
The fire spread over 153,000 acres (~62,000 hectares) and 18,800 structures were destroyed including 14,000 residences and about 530 commercial structures[i]. According to the Insurance Information Institute, an initial estimate of the Camp Fire event placed the range on insured losses between US$8.5 billion and US$10.5 billion dollars at the time of the event.
Narrative
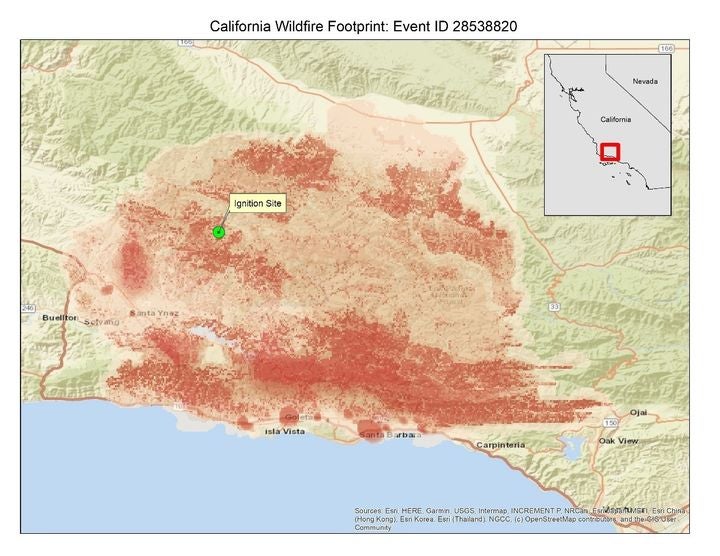
The modeled scenario assumes a wildfire event in Southern California that spreads southeast. The event was selected from the RMS® United States Wildfire HD Model stochastic event set and satisfies the requirement of the 200-year RP countrywide property economic loss. The wildfire starts in the Los Padres National Forest north of Santa Barbara, and quickly spreads southeast, amassing over 880,000 acres or 356,000 hectares (Figure 3) of scorched earth. The fire is ignited from a faulty power line, which sparks into the surrounding overgrowth and quickly spreads. The fire is amplified by the drought occurring in the region, which has caused very dry and flammable conditions. The drought is attributable to climate change.
Figure 3: Wildfire footprint
Coverage Trigger Pathways
Coverage trigger pathways are scenario-specific and describe how different liability type payouts are triggered by a given event. The wildfire scenario impacts various classes of liability insurance and eleven coverage trigger pathways have been identified and modeled. The list is not exhaustive but aims to give an indication of the potential for costly insurance claims.
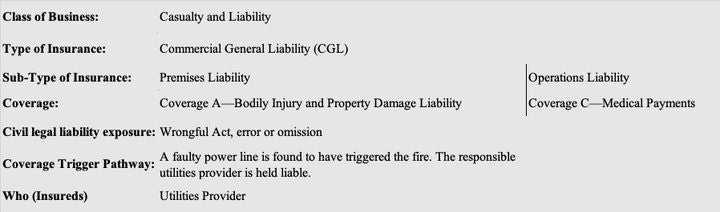
An example of the scenario pathway that leads to Commercial General Liability (CGL) claims is shown below (Figure 4).
Figure 4: Coverage Trigger Pathway – CGL
Liability Loss Estimates
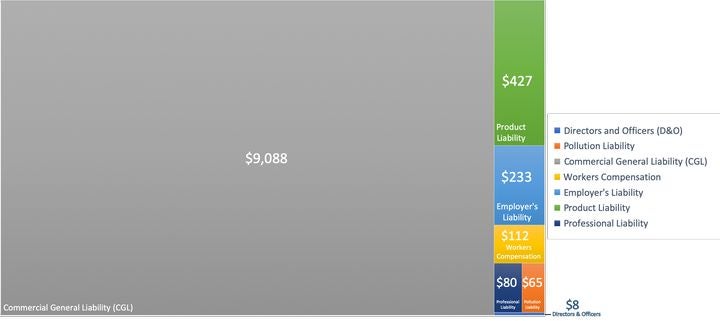
Under this scenario, RMS modeling of property ground-up economic loss for the insurance industry is estimated to be US$21 billion. Using the above liability model, RMS estimates the total estimate for the liability economic loss according to this scenario is around US$10 billion.
The most affected liability line is Commercial General Liability (CGL). The figure below shows the distribution of losses by liability line. The largest driver of losses is attributable to the policy held by the utilities provider, accounting for over 87 percent of the CGL loss.
Figure 5: Diagram of liability loss distribution (US$ millions)
The use of scenarios to estimate and manage exposure accumulations is considered a common practice among the insurance industry. Accumulations can have a spatial element but can also occur in a non-spatial manner. In the case of liability for example, risks are connected through more complex networks that may include trade connections or business activities. Where location is no longer the driving mechanism for a critical accumulation formation the role of non-spatial accumulation scenarios in multi-line risk management can be pivotal.
The Liability Footprint
Other events modeled as part of these property-liability clash scenarios, produce a wide range of loss profiles driven by different liability coverages. These have thus far served to inform our modelers of the potential situations and degree to which liability insurance classes contribute to catastrophic losses. This represents one area that has not been well-understood by the insurance market.
Thus far, the industry has not adopted established cat risk modeling practices, for the liability risk management. RMS is interested to learn more about the various ways insurers approach this challenge. Please feel free to reach out to share any feedback or questions by contacting derek.blum@rms.com or shruti.deshmukh@rms.com.
Share:
You May Also Like
May 16, 2022
Quantifying Liability Accumulations for Clash Scenarios
Katerina is a senior principal modeler and joined RMS in 2011. Apart from her involvement in the GEAC project during her time at RMS, she developed various property exposure models for climate hazard perils, mainly in Europe. Katerina also worked at Pembroke Managing Agency, where she was responsible for the validation of external catastrophe models and the quantification of non-modeled risks.
Before moving to the U.K., she held positions as Land Surveyor and GIS engineer in the Hellenic Military Geographical Service and Geopaeikonisis Ltd. Katerina has over 20 years of experience as a Geomatics Engineer and during her career to date, she has worked on large-scale private and publicly, EU funded projects.
Katerina is a Chartered Geomatics Surveyor and a corporate member of the Royal Institute of Chartered Surveyors (MRICS). She holds a PhD in Geographic Information Science from UCL and a master's degree in GIS from University of Leeds.