Climate modeling studies generally agree that anthropogenic climate change will likely cause tropical cyclones globally to be more intense on average, and that the most powerful ones will become more frequent. In response, climatologist Michael Mann (particularly well known for his so-called “hockey-stick” temperature graph) recently advocated the introduction of a sixth category to the Saffir-Simpson Hurricane Wind Scale (SSHWS), in order to better describe the very strongest storms. According to Mann, sturdier construction practices mean that Category 5 storms no longer all cause near-total destruction of human infrastructure and introducing a Category 6 would increase public awareness of the effects climate change is having on tropical cyclone strength. Mann is not the first to propose introducing a Category 6; after powerful tropical cyclones make landfall this is frequently deliberated. Before wading into this debate however, let us look at the SSHWS itself.
The Saffir-Simpson Hurricane Wind Scale (SSHWS)
Today’s SSHWS, used for official forecasts by the U.S. National Hurricane Center (NHC), was born from a damage scale devised by wind engineer Herbert Saffir in the early 1970s. Saffir’s scale had five categories, each corresponding to a certain level of structural damage based on wind speed. The director of the NHC at the time, Robert Simpson, adapted the scale by adding expected central pressure and storm surge heights, and the Saffir-Simpson Hurricane Scale was adopted in 1975.
Thirty years later, technology had improved, and reconnaissance aircraft were able to regularly obtain accurate measurements of hurricane wind speeds, eliminating the need for central pressure to be used as a proxy. Hurricanes like Charley (2004) and Ike (2008) had demonstrated that storm surge height was not simply a function of wind speed, but additionally depended on hurricane size, local bathymetry, topography, hurricane forward speed and the angle at which the storm approached the coastline. As a result, storm surge heights were also removed from the scale, leaving only wind speed. The Saffir-Simpson Hurricane Wind Scale was put into operational use in 2010.
Category 6: The Proposal
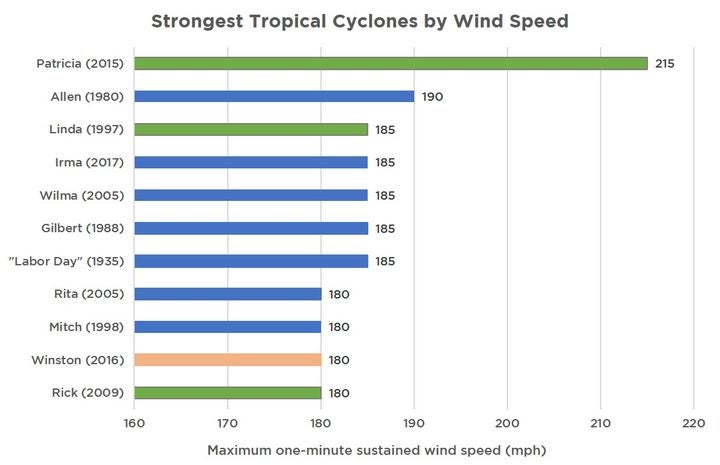
It is clear from the SSHWS, and known from painful experience, that Category 5 storms are incredibly dangerous. Mann and others, however, argue that the very strongest Category 5 storms should be given their own category. On average, there is a difference of 21 miles per hour (mph) between each existing category, so a threshold of around 180 mph for a Category 6 has been proposed (although Mann suggested it could be as high as 200 mph). Globally, there have only been 11 tropical cyclones with one-minute sustained winds of 180 mph or greater on record: seven in the North Atlantic, three in the East Pacific and one in the South Pacific (Figure 1). Of these, only Hurricane Patricia in the East Pacific had one-minute sustained winds over 200 mph. Does such a small group really warrant its own classification?
Figure 1: The strongest (≥180 mph) tropical cyclones globally by maximum one-minute sustained wind speed. Colors denote basin: East Pacific (green), North Atlantic (blue) and South Pacific (pink). There have been no West Pacific or Indian Ocean tropical cyclones with maximum one-minute sustained winds ≥180 mph. East Pacific and North Atlantic data are from the NHC and cover the periods from 1949 and 1851 respectively. South Pacific data are from the Joint Typhoon Warning Center and cover the period from 1945 onward.
Decreasing Construction Vulnerability?
Saffir was a wind engineer, and the SSHWS and its precursors have always included statements describing the types of wind damage that can be expected based on the storm category. In an interview in 1991, Simpson argued that there was no need to go beyond Category 5 because wind speeds above 155 mph cause rupturing damage regardless of how well a building is engineered. Mann’s view is that today, better construction practices are reducing vulnerability to Category 5 storms. But this view has met with resistance. Following Hurricane Irma in 2017, the NHC emphasized that Category 5 storms already cause catastrophic damage.
Catastrophe models provide one way of evaluating the effects of events that are very rare, because they are not restricted by the historical record, and they explicitly model property damage and resulting financial losses. Peter Datin, lead vulnerability modeler at RMS for the North Atlantic Hurricane Models, explains that having to wait for nature makes it hard to prove unequivocally that improvements in building codes have decreased vulnerability to Category 5 storms. South Florida has arguably the best building codes for wind loads in the world and some of the highest levels of building code enforcement. Significant updates to portions of the building code were made after Category 5 Hurricane Andrew made landfall in 1992, but since then, no Category 5 storms have made landfall in Florida (or anywhere in the U.S.), so the new codes have not been properly tested.
Perhaps more material from a property-owner or insurer’s perspective, however, is that a reduction in vulnerability may not change the overall repair cost. A reduction in damage at 180 mph from 80 percent to 70 percent may make very little difference — particularly if the building is already considered to be a total loss.
Category 6, Climate Change, and Communication
A second reason Mann argues a Category 6 would be useful is to increase awareness that climate change is increasing the strength of tropical cyclones. Setting aside the fact that existing trends are not agreed upon due to the short historical record, it is important to highlight that the SSHWS is not just a way to label storms in a record, it is also employed as an alert system. There is a danger that the introduction of a sixth category could make Category 5 storms seem somehow less dangerous than before, when in fact they are an extreme threat to human life and, as examined earlier, possibly not much less damaging than Category 6 storms.
Indeed, the SSHWS is arguably not the best way to measure the strength of a hurricane, as it only considers maximum wind speed at a single point. Using a metric such as Integrated Kinetic Energy (IKE), which sums the winds across the storm, enables differentiation between large and small storms with the same maximum sustained wind, with the additional advantage that IKE is also better correlated with storm surge than maximum sustained wind. These are two reasons RMS calculates IKE as well as maximum sustained wind speed for its real-time HWind hurricane wind field snapshots.
Verdict
RMS takes no official stance, but the arguments in favor of a Category 6 are not compelling to this author. In some regions of the world, property vulnerability to Category 5 storms may be decreasing, but it is not clear that this will result in a material difference to repair costs. From a forecast warning perspective, the NHC is adamant that all Category 5 storms already have catastrophic effects, and residents’ response to a Category 5 storm certainly should be no different than to a hypothetical Category 6. Although climate change is altering the nature of tropical cyclones, changing a familiar and well-understood de facto warning scale is probably not the best way to communicate this.
But that’s not all. Wind gusts are only one of the hazards that tropical cyclones generate.
The RMS Industry Loss Estimate for Superstorm Sandy in 2012 estimated that storm surge accounted for 65 percent of the total insured loss; the RMS Industry Loss Estimate for Hurricane Harvey last year estimated that inland flood accounted for over 90 percent of insured losses. A 2014 study of Atlantic tropical cyclones (1963-2012) showed that 49 percent of fatalities were caused by storm surge and 27 percent were caused by rainfall-induced flooding or mudslides. As addressed in a previous blog by RMS Chief Research Officer Robert Muir-Wood, it is clear that water deserves significant attention, if not more so than wind. Tropical cyclone rainfall rates are expected to increase in the future due to anthropogenic warming, so if communication of the effects climate change is having on tropical cyclones is an objective, focusing on a wind scale like the SSHWS only tells part of the story.
Share:
You May Also Like
April 23, 2020
Severe Convective Storms in Europe: Ancient Threat, New Solution
Late May 2019 was a startlingly active period for severe convective storms (SCS) in the U.S., even after considering that May is typically one of the most active months of the year. Until about halfway through the month, the number of tornadoes being reported was around average, but after a major outbreak starting in mid-May this number shot up, bringing the year-to-date total to 1,017 tornado reports. This count is only surpassed by the extremely active years of 2008 and 2011 (Figure 1).
This year’s late May outbreak was also unusually long: by the end of Wednesday, May 29, at least eight tornadoes had been experienced each day across a record-breaking 13 consecutive days, according to preliminary data from the National Weather Service (NWS). The previous record was set in 1980, after 11 consecutive days with at least eight tornadoes.
Figure 1: Cumulative counts of tornado reports. 2019 (up to 30 May) shown in black. 2016-18 data are not plotted. Source: https://www.spc.noaa.gov/wcm/The reason this latest outbreak lasted so long was due to a particularly persistent set of atmospheric conditions favourable for SCS. A combination of a stubborn high-pressure system over the Southeast U.S. and a stationary and unusually cold trough over the Rocky Mountains, saw warm, moist air drawn from the Gulf of Mexico into the central U.S., and a strong jet stream aided the formation of supercell thunderstorms, which can generate very powerful tornadoes.
Hailstone measuring 5.5 inches found at Wellington, Texas, on May 20, 2019. Image credit: Twitter/@NWSAmarilloThe outbreak spawned tornadoes across a wide area of the U.S. (Figure 2), but most have occurred in the southern Great Plains (so-called “Tornado Alley”) and the Midwest. It has not only been tornadoes causing damage, the severe weather also generated large hail – with a 5.5 inch (14 centimeter) diameter hailstone (see above) reported in Texas, and strong straight-line winds.
Figure 2: Tornado reports by U.S. County (20-30 May 2019). Data source: NOAA (https://www.spc.noaa.gov/climo/reports/)SCS is a major contributor to annual insured losses in the United States. RMS modeling shows that average annual loss (AAL) from SCS roughly equals that from hurricanes, at around US$17 billion. Unlike losses from hurricanes, SCS losses (especially hail) accumulate over the course of a year; however, major outbreaks can make the difference between an “average” year and a significant impact to the insurance industry. Prolonged and damaging outbreaks also increase the likelihood that losses will flow through to reinsurance layers.
The most significant past tornado outbreaks, for example, the tornadoes that hit Tuscaloosa, Alabama and Joplin, Missouri in 2011, have cost single-digit billions of insured loss (USD). One particularly interesting characteristic of the late-May 2019 SCS outbreak, however, is that the damage could have been much worse. Meteorological records have been broken but – for the most part – the tornadoes avoided major cities.
That said, it will take some time before all of the claims (hail, tornado and wind) have been verified and processed, so it is too early to know what the cost of the outbreak to the insurance industry will be. It is worth noting that the SCS outbreak was accompanied by significant flooding in Arkansas, Oklahoma and Missouri, but since flood damage is not typically covered by private insurance in the U.S., if the properties were not covered by the National Flood Insurance Program (NFIP), these costs will be borne by individual home and business owners.
Below are shown some statistics and charts covering this remarkable outbreak. Unless otherwise stated, they cover the period 20-30 May 2019:
Number of Confirmed Tornadoes in the U.S. (May 16–30): ≥ 228
22 of these have not yet been given a strength rating by the National Weather Service (NWS). More tornadoes may be confirmed by the NWS as their surveys continue.
Number of EF5 Tornadoes: 0
There have been no tornadoes of the highest category on the Enhanced Fujita (EF) Scale.
Number of EF4 Tornadoes: 3
EF-4 in Dayton, Ohio
EF-4 in Linwood, Kansas
EF-4 hit Marshall, Oklahoma
…
Chris is the product manager for the RMS North America Severe Convective Storm (SCS) and Winter Storm models. He has a doctorate in Climatology from Oxford University, where he was a College Lecturer.
Apart from SCS and winter storm, he is particularly interested in hurricanes and still gets excited by his old PhD topic, Saharan dust storms. Chris is a Certified Catastrophe Risk Analyst.