Hurricane Maria: The Importance of Local Knowledge
Tom Sabbatelli-GoodyerNovember 14, 2017
As is usual in the weeks following a hurricane’s impact on land, much of the focus surrounding Hurricane Maria has now shifted away from estimating losses with models to surveying the actual damage and claims incurred. With the collection of claims and losses, evaluating the array of loss estimates published by catastrophe model vendors in Maria’s immediate aftermath will begin. Included in this array is the RMS best estimate of insured loss, a range between US$15 billion and US$30 billion.
As Michael Young demonstrates in his blog written immediately after the storm’s impact, RMS overcame failures in weather observation systems during high winds through the comprehensive network of observations collected by the RMS HWind network. With high levels of confidence in the RMS hazard footprint for Maria, it then becomes critical to examine firsthand the underlying exposure and its corresponding vulnerability to validate a modeled loss estimate. To perform this validation, an RMS reconnaissance team arrived in Puerto Rico on October 3 with plans to survey Hurricane Maria damage both on the ground and from the sky.
Our local contacts, with whom the team coordinated this trip, state that RMS was the only modeling firm to visit the island and one of the few external visitors so near to the storm’s occurrence. Indeed, the reconnaissance mission helps RMS further its industry-leading commitment to the Puerto Rican insurance industry, making it the fifth hurricane-related visit in the last five years.
RMS draws confidence in the representation of exposure and vulnerability for its Hurricane Maria insured loss estimate from these pre-storm visits to Puerto Rico. The ability to learn firsthand from these visits, coupled with multiple government data sources, informed a comprehensive rebuild and recalibration of the 2017 RMS Caribbean Hurricane Industry Exposure Database (IED), the market’s most up-to-date data on Puerto Rico insured values and building inventory. The 2014 American Community Survey and 2010 U.S. Census data inform the most recent recalibration for Puerto Rico residential lines, while 2013 County Business Pattern data and 2016 Bureau of Labor Statistics inform commercial and industrial lines.
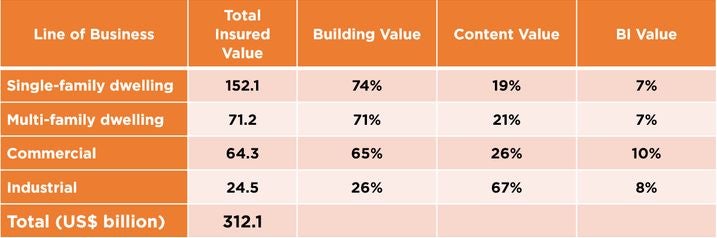
Table 1: Total value (in US$ billions) of insured properties in Puerto Rico, as represented in the 2017 RMS Caribbean Hurricane IED
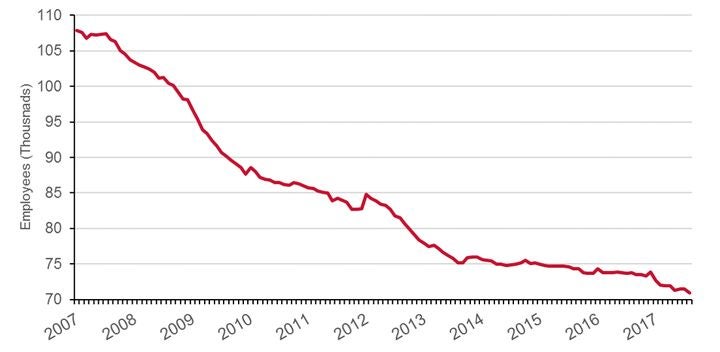
Other estimates of insured exposure in Puerto Rico likely rely on trending factors applied to values drawn from older data vintages. This approach would ignore the changing dynamics of the island’s prominent industries. For example, employment in Puerto Rico’s manufacturing industry has consistently decreased over the last decade, a total drop of one-third. Neglecting this trend may lead to overestimation of value and event loss, particularly for the island’s pharmaceutical industry.
During the week the RMS reconnaissance team spent on the island, they found that damage to insured buildings was less than expected for a hurricane of Maria’s magnitude. This level of damage corresponds well with the local vulnerability curves included within Version 17.0 of the RMS® North Atlantic Hurricane Models and, subsequently, our best estimate loss range. Modelers constructed these vulnerability curves with historical claims data and observations from extensive, pre-storm reconnaissance visits to Puerto Rico. During these visits, RMS observed that most insured buildings feature bunker-style, reinforced concrete construction, and flat, concrete roofs. These resistant structures constitute 75 percent of Puerto Rico’s insured single-family dwelling value and over 85 percent of the island’s multi-family dwelling and commercial/industrial value.
As expected, these bunker-style buildings performed very well during the storm. The reinforced concrete construction prevents significant structural damage and a lower prevalence of drywall and tiled flooring limits interior damage due to water intrusion. Wood and light metal structures fared far worse in Maria’s high winds; however, these buildings tended to be located in older neighborhoods where insurance take-up is low.
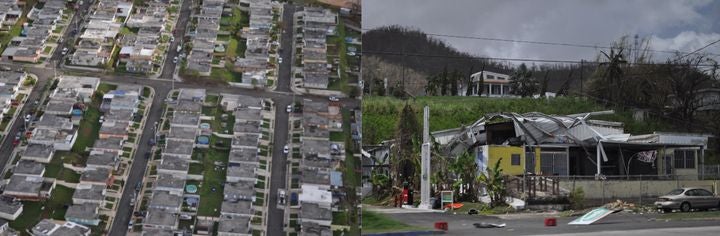
Figure 2: Typically-observed levels of damage to concrete single-family homes (left) and light metal structures (right)
Despite limited power restoration at the time of their visit, the team found the capital of San Juan mostly operational. A few broken windows and balcony failures constituted the worst structural damage observed in the city. Most businesses use fuel-powered generators as part of hurricane preparedness plans, enabling them to remain in operation, and major office buildings, banks, and hospitals returned to the grid faster than expected.
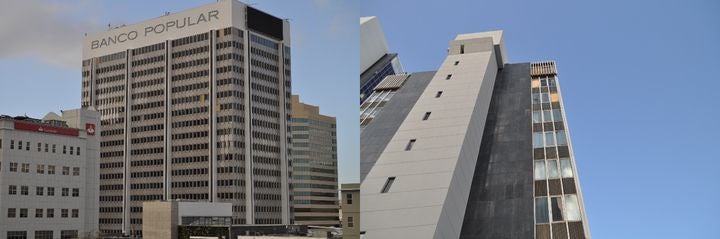
Figure 3: Damage to high-rise buildings in San Juan, limited to a few broken windows
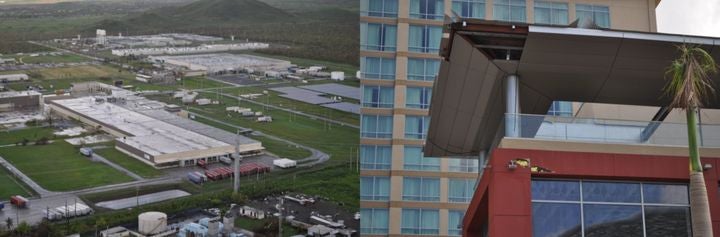
This restoration of power supplies in San Juan may slightly limit what is expected to be a significant business interruption (BI) loss, although the situation in other towns and remote areas is yet to stabilize. Much of this loss will be driven by pharmaceutical facilities and hotel downtimes. These structures typically exhibited low levels of structural damage, primarily to roofs, but it was difficult to ascertain the amount of water intrusion experienced at each site. At some locations, repair crews were on-site to evaluate damage and plan repairs. Some older hotels and resorts may remain out of business for several months because of significant water and mold damage. However, newer hotels performed well and remained fully operational.
Figure 4: Structural damage to pharmaceutical facilities (left) and hotels (right), limited to roof and cladding damage
The team’s post-storm reconnaissance visit provides powerful validation of the Hurricane Maria damage modeled by RMS. Our years of studying the Puerto Rican market and building inventory enabled RMS to correctly capture the local risk profile and its associated vulnerability, both of which are missing from other loss estimates on the market.
Share:
You May Also Like
March 31, 2021
RMS 2020 Catastrophe Review: The Year of the COVID-19 Pandemic
Tom is a Director - Event Response at RMS, and leads the Event Response services operation. He joined RMS in 2009 and spent several years in the Client Support Services organization, primarily providing specialist peril model support. Tom joined RMS upon completion of his bachelor's and master's degrees in meteorology from Pennsylvania State University, where he studied the statistical influence of climate state variables on tropical cyclone frequency. He is a member of the American Meteorological Society (AMS).