On my recent trip to Warsaw, the fall leaves were in full color – yellows and oranges lined the wide streets. Beautiful to look at but a reminder that it is a worrying time for (re)insurers as the European windstorm season commences.
With the recent passage of Windstorm Christian, (re)insurers will be watching to see what the remainder of the season brings… A quiet windstorm season means lower catastrophe losses but a windy fall could cost billions.
In a typical season, only a small number of the many depressions that form along the jet stream develop into potentially damaging windstorms.
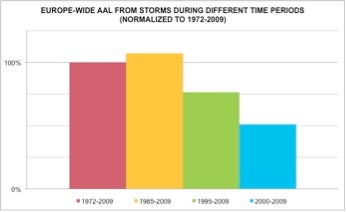
In recent decades, however, there has been considerable variability in windstorm frequency. The chart below demonstrates the average annual loss (AAL) from windstorms over varying periods since 1972.
While Europe has experienced significant windstorm events during this time, notably in 1987, 1990, 1999 and 2007, there is an apparent trend of decreasing AAL over time.
Europe windstorm AAL for selected periods relative to long-term AAL based on RMS storm reconstructions from windspeed anemometer data, using the RMS v11 model
So what’s going on?
Of course this trend could be just noise in the system and it may not continue, but what if it does?
Can we forecast seasonal activity?
European windstorms are often linked to the North Atlantic Oscillation (NAO), a measure of the surface-level pressure between the Azores and Iceland. When anomalously positive, the possibility of damaging windstorms across northern Europe increases. Currently, however, the NAO cannot be predicted on a timeframe that makes seasonal forecasts possible.
Even if we could make seasonal forecasts, uncertainty remains regarding where and when storms strike. We are all familiar with the infamous windstorm seasons of 1990 and 1999, when clusters of powerful windstorms caused insured losses of $18 billion and $14 billion, respectively (2012, Swiss Re).
Clustering can be spatial and/or temporal.
Spatial clustering refers to the occurrence of multiple storms in the same region
Temporal clustering occurs when multiple storms occur at the same time
Windstorms Lothar and Martin were clustered spatially and temporally, as was the extraordinary sequence of storms in January – February 1990 that swept across Europe.
Clustering is meteorologically complex; the scientific community doesn’t know enough about the dynamics of clustering to be able to forecast the phenomenon on sufficiently useful lead times.
And what about climate change?
In the recent IPCC report, there was low confidence associated with their forecasts of future Europe windstorm behavior. And compared to inter-decadal variability, the climate change signal is weaker, so perhaps that should be of greater concern to the (re)insurance industry.
These are front-of-mind topics requiring further exploration. At a recent workshop co-hosted by RMS and the Risk Prediction Initiative (RPI), leading academics from the field of European windstorm research (ETH Zürich, University of Reading, Freie University Berlin, University of Oxford; University of Birmingham) met with RMS scientists to discuss their latest research, helping us to develop our understanding of these important topics.
In summary, there is no easy answer to the topic of seasonal European storm forecasts.
In the meantime, industry participants will take a view, and wait to see whether they experience a windy fall or a windfall. Only time will tell.
Share:
You May Also Like
August 17, 2015
From Arlene to Zeta: Remembering the Record-Breaking 2005 Atlantic Hurricane Season
Few in the insurance industry can forget the Atlantic hurricane season of 2005. For many, it is indelibly linked with Hurricane Katrina and the flooding of New Orleans. But looking beyond these tragic events, the 2005 season was remarkable on many levels, and the facts are just as compelling in 2015 as they were a decade ago.
In the months leading up to June 2005, the insurance industry was still evaluating the impact of a very active season in 2004. Eight named storms made landfall in the United States and the Caribbean (Mexico was spared), including four major hurricanes in Florida over a six-week period. RMS was engaged in a large 2004-season claims evaluation project as the beginning of the 2005 season approached.
An Early Start
The season got off to a relatively early start with the first named storm—Arlene—making landfall on June 8 as a strong tropical storm in the panhandle of Florida. Three weeks later, the second named storm—Bret—made landfall as a weak tropical storm in Mexico. Although higher than the long-term June average of less than one named storm, June 2005 raised no eyebrows.
July was different.
Climatologically speaking, July is usually one of the quietest months of the entire season, with the long-term average number of named storms at less than one. But in July 2005, there were no fewer than five named storms, three of which were hurricanes. Of these, two—Dennis and Emily—were major hurricanes, reaching categories 4 and 5 on the Saffir-Simpson Hurricane Scale. Dennis made landfall on the Florida panhandle, and Emily made landfall in Mexico. This was the busiest July on record for tropical cyclones.
The Season Continued to Rage
In previous years when there was a busy early season, we comforted ourselves by remembering that there was no correlation between early- and late-season activity. Surely, we thought, in August and September things would calm down. But, as it turned out, 10 more named storms occurred by the end of September—five in each month—including the intense Hurricane Rita and the massively destructive Hurricane Katrina.
In terms of the overall number of named storms, the season was approaching record levels of activity—and it was only the end of September! As the industry grappled with the enormity of Hurricane Katrina’s devastation, there were hopes that October would bring relief. However, it was not to be.
Seven more storms developed in October, including Hurricane Wilma, which had the lowest-ever pressure for an Atlantic hurricane (882 mb) and blew though the Yucatan Peninsular as a category 5 hurricane. Wilma then made a remarkable right turn and a second landfall (still as a major hurricane) in southwestern Florida, maintaining hurricane strength as it crossed the state and exited into the Atlantic near Miami and Fort Lauderdale.
We were now firmly in record territory, surpassing the previous most-active season in 1933. The unthinkable had been achieved: The season’s list of names had been exhausted. October’s last two storms were called Alpha and Beta!
Records Smashed
Four more storms were named in November and December, bringing the total for the year to 28 (see Figure 1). By the time the season was over, the Atlantic, Caribbean and Gulf of Mexico had been criss-crossed by storms (see Figure 2), and many long-standing hurricane-season records were shattered: the most named storms, the most hurricanes, the highest number of major hurricanes, and the highest number of category 5 hurricanes (see Table 1). It was also the first time in recorded history that more storms were recorded in the Atlantic than in the western North Pacific basin. In total, the 2005 Atlantic hurricane season caused more than $90 billion in insured losses (adjusted to 2015 dollars).
The 2005 Atlantic Hurricane Season: The Storm Before the Calm
The 2005 season was, in some ways, the storm before the current calm in the Atlantic, particularly as it has affected the U.S. No major hurricane has made landfall in the U.S. since 2005. That’s not to say that major hurricanes have not developed in the Atlantic or that damaging storms haven’t happened—just look at the destruction wreaked by Hurricane Ike in 2008 (over $13 billion in today’s dollars) and by Superstorm Sandy in 2012, which caused more than $20 billion in insured losses. We should not lower our guard.
Figure 1: Number of named storms by month during the 2005 Atlantic hurricane seasonTable 1: Summary of the number of named storms in the Atlantic hurricane basin in 2005 and average season activity through 2014
* Accumulated Cyclone Energy (ACE): a measure of the total energy in a hurricane season based on number of storms, duration, and intensity
Figure 2: Tracks of named storms in the 2005 Atlantic hurricane season
Brian Owens…
When you consider lofty odds like the chances you will win the Mega Million lottery (1 in 259 million) or the chance you will get hit by lightning (1 in 280,000) it blunts your appreciation of very unlikely, if not statistically improbable, events.
Consider some of the things with 500-to-1 odds:
An Auburn fan bet that his team would win the NCAA football national championship. He came close to a $50k payday but ultimately missed the mark.
Pro golfer Rory McIlroy’s father bet his son would win the British Open by 25 at 500-1 odds and won $171k.
One lucky European better predicted Germany would stomp Brazil 7-1 in the World Cup and won.
We witnessed something that has a 500-1 chance of happening recently in nature: two storms hit Bermuda within six days of each other. Bermuda was recently hit by a tropical storm (Fay) and a borderline category 2/3 hurricane (Gonzalo) within six days. The chances of two tropical systems hitting what amounts to a tiny dot in the middle of Atlantic Ocean this year was 1-in-500 according to our modeling.
Not statistically improbable, but certainly not a normal occurrence.
Even more impressive, the natural fluke comes after a relatively inactive hurricane season. There have been seven named storms in 2014; six have reached hurricane status.
The climatological peak of the Atlantic season for hurricanes is mid-September and generally associated with storms that develop as they cross from Africa toward the Caribbean. However, there is a secondary peak in October related to storms developing closer to the U.S. in areas such as the Caribbean Sea and the Gulf of Mexico.
The cumulative intensity of this season’s storms is lower than average. Our research attributes this to cooler than normal sea temperatures in the Atlantic lessening energy, along with higher than normal sea pressures suppressing thunderstorms. It would be interesting to see what the odds were for Gonzalo and Fay both hitting Bermuda if we factored in a slow hurricane season.…
Brian Owens is a meteorologist and specialist in catastrophe risk management. At RMS he is responsible for market engagement and product strategy for the European and North America models.
Brian has more than 15 years’ experience in insurance, catastrophe financing and catastrophe risk management and has held senior positions at JP Morgan Chase, ACE European Group and Willis Re. He is also a published science author, and has written numerous articles and blogs on catastrophe risk modeling and management.
Brian holds a bachelor’s degree in computer science from the National University of Ireland, a master’s in finance from the Wharton School, University of Pennsylvania, and a master’s in meteorology from the Rosenstiel School of Marine and Atmospheric Science, University of Miami.