It has long been a Moody’s RMS goal to help clients assess flood risk globally, a goal realized in the fall of 2021 with the first version of Moody’s RMS Global Flood Data and Maps.
The motivation for this ambition was simple: flooding is a truly global peril that can occur in any country with both significant humanitarian and financial implications.
For instance, over the summer months of 2023 in the Northern Hemisphere, hardly a week has gone by without reports of record-breaking rainfall causing exceptional flooding events or coastal flooding induced by tropical cyclones.
These events have also often impacted areas that have not typically been on the insurer’s flood risk radar.
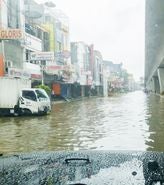
Following August 2023, an already flood-rich month, the first ten days of September 2023 saw an unusual assembly of flood events unfold across the globe, ranging from southern South America, Brazil, to Florida, to Southern Europe, and further East to the Northern Pacific.
In Europe, a stable high-pressure ridge in the center of the continent combined with high sea surface temperatures in the Mediterranean Sea, led to the development of near stationary cut-off low-pressure systems to the east and west sides of the continent, resulting in historic rainfall and catastrophic flooding in Spain, Greece, Bulgaria, and Turkey.
In what was labeled as a ‘medicane’ it was the eastern cut-off that eventually led to the tragic events that unfolded in Libya and the North African countries.
For Libya, the overwhelming of an aging flood management infrastructure on September 10 resulted in major parts of the city of Derna being wiped out with some estimates of over twenty thousand people feared dead.
Further east, the Northern Pacific basin is seeing an active cyclone season, paired with monsoon conditions and record-breaking flooding in Hong Kong, and across China.
Flood: #1 Global Peril
It’s no wonder then that the United Nations Office for Disaster Risk Reduction (UNDRR) deemed flood as the number one peril according to a recent report, both in terms of the number of events and people affected since 2000, with over 3,000 events and 1.6 billion people affected.
Consequently, it won’t come as a surprise to see floods among the costliest natural perils. In a recent report, Aon estimated economic losses between 2000–2022 from flood at approximately US$1.6 trillion, making flood risk second only to tropical cyclones.
However, according to the same report, only 16 percent of flood losses are insured, placing it among the lowest perils in terms of penetration. In part, this is a result of limitations in global solutions that provide the confidence to mitigate risk and extend coverage.
Since the release of Moody’s RMS Global Flood Data and Maps, clients have used the data to understand flood risk within their global portfolios and in local territories where flood risk had previously been unmodeled.
Enabling the assessment of 100 percent of global gross written premium (GWP), this first release was a major milestone that enabled our clients, and prospective clients, to complement existing modeled countries and fill in modeling gaps.
The first version of Moody’s RMS Global Flood Data and Maps provided results on the extent of undefended inundation and flood depth at 30-meter resolution globally, across multiple return periods (from 10 to 1,000 years) to assess understand risk potential at high and low exceedance probabilities.
The data is derived using a unique machine learning approach that draws on vast quantities of data from our best-in-class probabilistic flood models that can be used to produce flood extents in countries around the world based on topographic and climatological similarity.
The merits of this approach will be covered in further detail in a future blog, but some of the results against past events speak for themselves. One such example is the flooding that occurred in South Africa in April 2022.
Flooding at the Toyota Prospecton Plant, April 2022
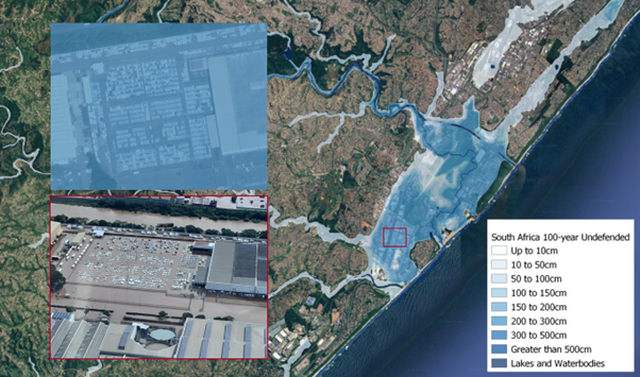
An event brought over 300 millimeters (11.8 inches) of rainfall in just 24 hours on April 12, 2022, to the KwaZulu-Natal province on South Africa's eastern coast, leading to catastrophic flooding, including at the Toyota Prospecton Plant to the south of the city of Durban.
Flood waters affected most of the 87-hectare facility and resulted in the scrapping of approximately 4,000 vehicles. But then the real cost came, as up to 80,000 cars were not produced during the facility’s four-month shutdown of the facility.
During this time Toyota South Africa Motors saw its market share slip from about 30 percent to 17 percent, 18.1 percent, and 16.3 percent in the months of May, June, and July 2022 respectively.
Although lower than originally feared, losses from the single plant are estimated to reach up to US$500 million.
It's worth bearing in mind that Moody’s RMS Global Flood Maps are not just available to insurers for risk decisions, but the same science also underpins Moody’s newly released Climate on Demand solution to provide banks, investors, asset managers, and corporates’ view of climate risk.
Introducing Moody’s RMS Global Flood Data and Maps Version 2: Building Upon a Solid Foundation
Since the initial release, Moody’s RMS has been working towards an updated version of our Global Flood Data and Maps that incorporates a range of new innovations that enable further improvements to global flood risk assessment.
So, what’s new in Version 2?
Improved Global Digital Terrain Model
The use of a Digital Terrain Model (DTM) is a foundational component of flood modeling. They help us understand the Earth’s bare surface and consequently areas that are more susceptible to flooding than others.
Moody’s RMS has produced a state-of-the-art DTM that utilized very recent datasets from Copernicus GLO-30 DEM that provide high-precision elevation data and combined with robust and innovative machine-learning techniques to smooth and correct for artifacts like buildings and vegetation.
Defended Views of Risk
We have also extended the previously undefended-only data to account for flood defenses, through the development of a global standard of protection model, that predicts whether a defense is likely to exist and if it does what the standard of protection would be.
The model utilizes over six million data points at the sub-catchment level from the suite of Moody’s RMS probabilistic models to create a view of defenses at 500-meter resolution globally.
Inclusion of Coastal Views of Risk
And all of this is not just for inland flooding. Our latest version of Global Flood Maps and Data also includes flooding that can occur from the wind-driven coastal flood risk, to provide a complete picture of both wind and precipitation-induced flood potential.
Higher Resolution Maps and Data
All maps and data are provided at 10-meter resolution, making this the highest resolution, consistently derived, global dataset available to the market.
But what difference will these changes make for users of the Version 2 Global Flood Data and Maps?
On top of the feature enhancements to provide defended views of inland risk and both defended and undefended views of coastal risk, there are also visible improvements from the innovations in DTM and resolution.
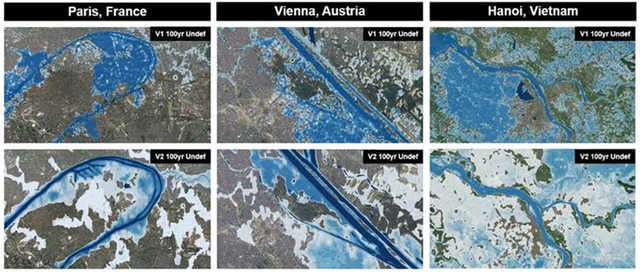
In the figure above we show comparative views of three cities around the globe. The top images show the 100-year undefended return period view of flood extent and depth using version 1. The lower image shows the same view using Version 2.
What is clear from the two images is how the new innovations result in an improved reflection of inundation, particularly at the lowest flood depths, allowing users to make more effective risk decisions, as areas of high or low risk are easier to identify.
There is much more to discuss regarding the new innovations included within Version 2 of Moody’s RMS Global Flood Data and Maps.
Keep an eye out for additional blogs and if you would like to discuss further, please reach out to sales@rms.com.