Hurricane Risk on the U.S. East Coast: The Latest RMS Medium-Term Rate Forecast is More Than Just a Number
Tom Sabbatelli-GoodyerFebruary 09, 2017
For the meteorologist in me, hurricane and climate research is fascinating in its dynamism. The last two years have seen continuous scientific debate about the state of Atlantic basin hurricane activity, which we’ve reflected on thoroughly in the RMS blog.
But for the insurance industry, it’s more than just a fascinating debate: business decisions depend on clear insight. It’s more than just a number.
In April with the release of the RMS Version 17 North Atlantic Hurricane Model, we will include the latest biennial update to the industry’s long-term rates, in addition to the RMS medium-term rate forecast.
For the first time since its introduction, the RMS medium-term rate forecast has dipped slightly below the long-term rate.
For the U.S. as a whole, the new 2017-2021 medium-term rate forecast of hurricane landfall frequency is now one percent below the long-term rate for Category 1–5 storms, and six percent for major hurricanes (Category 3–5 storms).
Mind the Tail
The impact of the rate changes on the view of risk will vary from portfolio to portfolio. Measuring the new medium-term rate against the RMS Industry Exposure Database, we see a 16 percent decrease in the U.S. average annual loss (AAL) relative to the previous medium-term rate forecast – mainly driven by lower risk in Florida and the Gulf.
However, to focus solely on the headline AAL-based changes, or the national impacts, ignores the risk implications of the unique atmospheric conditions and key features of the new forecast.
At the 250-year return period, the decrease is more muted – at eight percent – which positions the medium-term rate slightly higher (one percent) than the long-term rate. Unlike with previous below-average periods, persisting warm sea surface temperatures in the Atlantic continue to indicate that the medium-term rate risk remains above the long-term rate in certain key U.S. regions, such as the Northeast.
The Science and Process Underpinning the Medium-Term Rates
Grounded in objective science, we follow a systematic process to develop the biennial medium-term rate each time we update it. We analyze 13 different statistical climate models, which all provide a five-year forecast of activity for the Atlantic basin.
The climate models reflect three main theories of hurricane variability in the Atlantic over recent decades:
Shift models identify historical, multi-decadal periods of high or low hurricane activity, which are viewed as natural, inevitable oscillations
Sea surface temperature (SST) models identify relationships between SSTs and hurricane landfalls in the past and use these to predict similar patterns in the future
Active baseline models suggest that the low activity phase of the 1970s and 1980s was caused not by natural variability, but by high levels of atmospheric aerosols which are not expected to recur in the future
To provide a more reliable forecast, we take a weighted average across all 13 models – based on tests made of each model’s predictive “skill.” These tests compare how well the models predict hurricane activity in sample periods from the past, against what occurred. This rigorous testing process is revisited with each release of the medium-term rate.
The Latest Data – How Do the Climate Models Interpret It?
The new medium-term rate forecast uses updated information from the HURDAT2 hurricane dataset and the latest sea surface temperature data, including the 2014 – 2016 seasons.
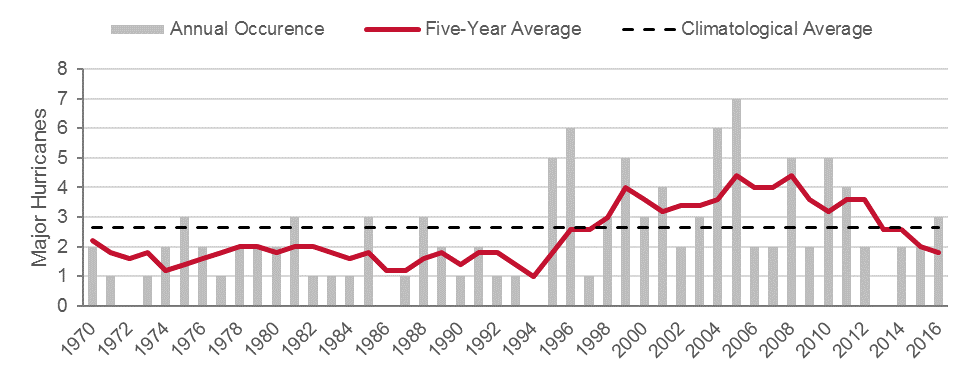
North Atlantic Basin major hurricane counts, 1970-present
The updated hurricane data reveals a four-year stretch of below-average Atlantic major hurricane activity between 2012 and 2015, leading to a five-year average trend that is decreasing.
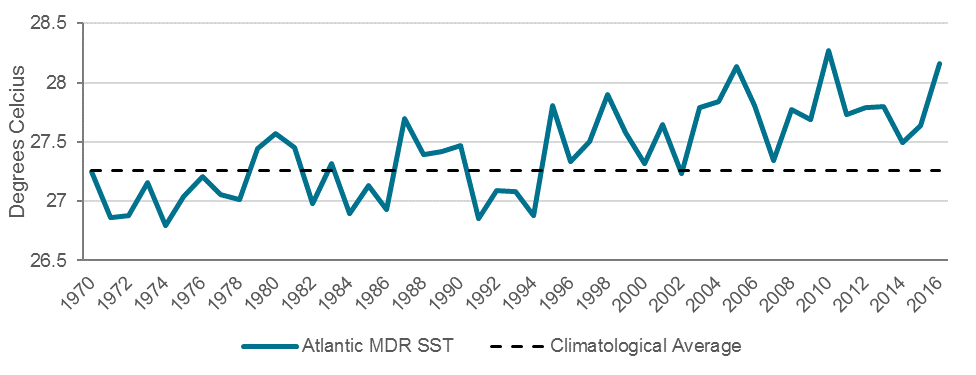
North Atlantic Basin main development region sea surface temperatures, 1970-present
On the other hand, sea surface temperatures over this same period have been rising . Energy derived from warm temperatures serves as an important driver for hurricanes – so you would expect to see an increasing rate of hurricanes, not fewer.
When the data is fed into the climate models they do not point in the same direction for future hurricane activity.
But while the shift models indicate this transition, both the sea surface temperature and active baseline models do not identify a similar transition to a less active hurricane phase, in part based on the warmer Atlantic sea surface temperatures.
It’s Not Just a Factor
As I discussed earlier, the medium-term rate considers multiple drivers of hurricane activity, including sea surface temperatures. Peer-reviewed research highlights the influence of sea surface temperatures (SSTs) on hurricane tracks; thus, analysis of projected SSTs provides different forecasts not only of where along the coastline hurricanes are likely to occur, but at what strength hurricanes will make landfall. This is a process that RMS terms regionalization.
During higher sea surface temperature periods, the body of warm water over which hurricanes develop expands eastward towards Africa. This expansion increases the likelihood that hurricanes re-curve away from the eastern U.S. coast, towards the northeast and maritime Canada, following paths similar to hurricanes Irene and Sandy.
In the medium-term rate forecast it is regionalization that causes forecasted activity in the U.S. northeast and mid-Atlantic to be above the long-term average, despite a below-average forecast for the U.S. as a whole. This creates a pattern that differs from normal climatological expectations, which would typically be focused on the risk to Texas and Florida – although, obviously, in those southern states the risk does remain higher in absolute terms.
The forecast’s regionalization also produces slightly above long-term risk beyond the 100-year return period, on the industry U.S. exceedance probability curve. At the 250-year return period, for example, while the new medium-term rate has decreased risk by eight percent, the new forecast remains one percent above the long-term rate. Despite decreases in the forecasted frequency of large loss-causing, tail events in Florida and the northeast U.S., warm Atlantic sea surface temperatures continue to support the possibility of these events occurring at a rate above the long-term average.
Delivering the Model
Pre-release data sets for the new medium-term rate are now available in advance of the April release of the updated RiskLink® Version 17 North Atlantic Hurricane Models. These are accompanied by technical documentation describing the process’ methodology and its impact on risk.
Share:
You May Also Like
March 31, 2021
RMS 2020 Catastrophe Review: The Year of the COVID-19 Pandemic
Tom is a Director - Event Response at RMS, and leads the Event Response services operation. He joined RMS in 2009 and spent several years in the Client Support Services organization, primarily providing specialist peril model support. Tom joined RMS upon completion of his bachelor's and master's degrees in meteorology from Pennsylvania State University, where he studied the statistical influence of climate state variables on tropical cyclone frequency. He is a member of the American Meteorological Society (AMS).


 of hurricane landfall frequency is now one percent below the long-term rate for Category 1–5 storms, and six percent for major hurricanes (Category 3–5 storms).