


EXPOSURE
The RMS Magazine with a unique perspective and clear mission “... to provide insight and analysis to help insurance and risk professionals innovate, adapt, and deliver.”

Insurance: The next 10 years
Mohsen Rahnama, Cihan Biyikoglu and Moe Khosravy of RMS look to 2029, consider the…
Times Square, New York City
Reset Filters
Perils
- 2022
- 2021
- 2020
- 2019
- 2018
- 2017
- 2016

A Climate Model Challenge
Insurance-linked securities (ILS) investors want to know more about how climate change impacts investment decisions, according to Paul Wilson, head of non-life analytics at Securis Investment Partners, an ILS asset manager We make investments that are typically annual to two-to-three years in duration, so we need to understand the implications of climate change on those timescales,” explains Paul Wilson, head of non-life analytics at Securis Investment Partners. “We reevaluate investments as part of any renewal process, and it’s right to ask if any opportunity is still attractive given what we know about how our climate is changing. “The fundamental question that we’re trying to address is, ‘Have I priced the risk of this investment correctly for the next year?’” he continues. “And therefore, we need to know if the catastrophe models we are using accurately account for the impact climate change may be having. Or are they overly reliant on historical data and, as such, are not actually representing the true current risk levels for today’s climate?” Expertise in climate change is a requirement for how Securis is thinking about risk. “We have investors who are asking questions about climate change, and we have a responsibility to be able to demonstrate to them that we are taking the implications into consideration in our investment decisions.” “We have investors who are asking questions about climate change, and we have a responsibility to demonstrate to them that we are taking the implications into consideration in our investment decisions Paul Wilson Securis Investment Partners The rate at which a changing climate may influence natural catastrophes will present both a challenge and opportunity to the wider industry as well as to catastrophe modeling companies, thinks Wilson. The results coming out of climate change attribution studies are going to have to start informing the decisions around risk. For example, according to attribution studies, climate change tripled the chances of Hurricane Harvey’s record rainfall. “Climate change is a big challenge for the catastrophe modeling community,” he says. “It’s going to put a greater burden on catastrophe modelers to ensure that their models are up to date. The frequency and nature of model updates will have to change. Models we are using today may become out of date in just a few years’ time. That’s interesting when you think about the number of perils and regions where climate change could have a significant impact. “All of those climate-related models could be impacted by climate change, so we have to question the impact that is having today,” he adds. “If the model you are using to price the risk has been calibrated to the last 50 years, but you believe the last 10 or last 20 years are more representative because of the implication of climate change, then how do you adjust your model according to that? That’s the question we should all be looking to address.”
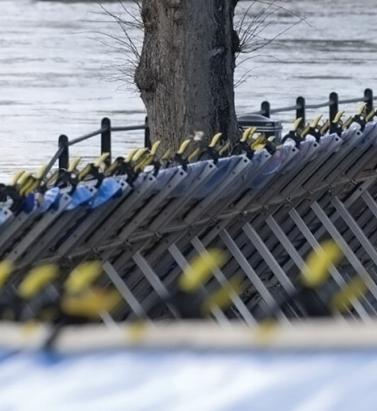
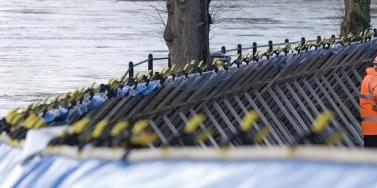
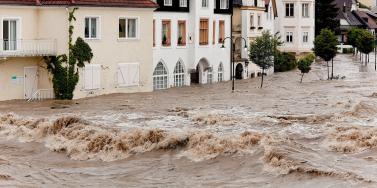
The Value of Defense
Current flood defenses in the U.K. reduce annual losses from river flooding by £1.1 billion, according to research by RMS Flooding is one of the most significant natural hazards for the U.K. with over five million homes and businesses in England at risk of flooding and coastal erosion, according to the Environment Agency. Flood barrier in Shropshire, England In 2015, the U.K. government announced a six-year, £2.3 billion investment in flood defenses. But the Environment Agency proposes a further annual investment of £1 billion through 2065 to keep pace with the flood-related impacts of climate change and shifts in exposure levels. Critical to targeted flood mitigation investment is understanding the positive impacts of current defenses. In June 2019, Flood Re* released its Investing in Flood Risk Management and Defenses study, conducted by RMS. Addressing the financial benefits of existing flood defenses for the first time, data from the RMS® Europe Inland Flood HD Model demonstrated that current infrastructure reduced annual losses from riverine flooding by £1.1 billion. This was based on ground-up losses, using the RMS U.K. Economic Exposure Database covering buildings and contents for residential, commercial, industrial and agricultural, plus business interruption losses. Critical to targeted flood investment is understanding the positive impacts of current defenses “Our flood model incorporates countrywide defense data sourced from the Environment Agency and the Scottish Flood Defence Asset Database,” says Theresa Lederer, a consultant within the RMS capital and resilience solutions team, “including walls, levees and embankments, carefully reviewed and augmented by RMS experts. Our initial model run was with defenses in place, and then, using the in-built model functionality to enter user-defined defense values, we removed these [defenses in place].” The differences in average annual loss results between the two analyses was £1.1 billion, with losses increasing from £0.7 billion under current defenses to £1.8 billion in the undefended case. The analysis also revealed a differentiated picture of flood risk and defenses at the regional and local levels. “The savings relative to total inland flood risk are more pronounced in Northern Ireland and England (both over a 50 percent reduction in average annual losses) than Scotland and Wales,” she explains. “But when you view the savings relative to surface-water flood risk only, these are similarly significant across the country, with loss reductions exceeding 75 percent in all regions. This reflects the fact that pluvial flooding, which is kept constant in the analysis, is a bigger loss driver in Scotland and Wales, compared to the rest of the U.K.” Other insights included that the more deprived half of the population — based on the U.K. Townsend Deprivation Index — benefited from 70 percent of the loss reduction. The study also showed that while absolute savings were highest for catastrophic events, the proportion of the savings compared to the overall level of loss caused by such events was less significant. “In the case of 1-in-5-year events,” Lederer says, “river flood defenses prevent approximately 70 percent of inland flood losses. For 1-in-500-year events this drops to 30 percent; however, the absolute value of those 30 percent is far higher than the absolute savings realized in a 1-in-5-year event. “Should the focus of defenses therefore be on providing protection from major flood events, with potential catastrophic impacts even though return on investment might not be as attractive given their infrequency? Or on attritional losses from more frequent events, which might realize savings more frequently but fail to protect from the most severe events? Finding a balanced, data-driven approach to flood defense investment is crucial to ensure the affordability of sustainable flood resilience.”
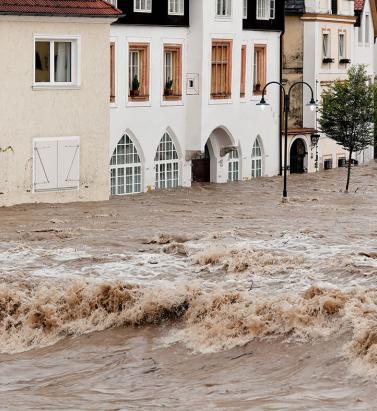
Clear Link Between Flood Losses and NAO
RMS research proves relationship between NAO and catastrophic flood events in Europe The correlation between the North Atlantic Oscillation (NAO) and European precipitation patterns is well known. However, a definitive link between phases of the NAO and catastrophic flood events and related losses had not previously been established — until now. A study by RMS published in Geophysical Research Letters has revealed a direct correlation between the NAO and the occurrence of catastrophic floods across Europe and associated economic losses. The analysis not only extrapolated a statistically significant relationship between the events, but critically showed that average flood losses during opposite NAO states can differ by up to 50 percent. A Change in Pressure The NAO’s impact on meteorological patterns is most pronounced in winter. Fluctuations in the atmospheric pressure between two semi-permanent centers of low and high pressure in the North Atlantic influence wind direction and strength as well as storm tracks. The two-pronged study combined extensive analysis of flood occurrence and peak water levels across Europe, coupled with extensive modeling of European flood events using the RMS Europe Inland Flood High-Definition (HD) Model. The data sets included HANZE-Events, a catalog of over 1,500 catastrophic European flood events between 1870 and 2016, and a recent database of the highest-recorded water levels based on data from over 4,200 weather stations. “The HD model generated a large set of potential catastrophic flood events and quantified the associated losses” “This analysis established a clear relationship between the occurrence of catastrophic flood events and the NAO phase,” explains Stefano Zanardo, principal modeler at RMS, “and confirmed that a positive NAO increased catastrophic flooding in Northern Europe, with a negative phase influencing flooding in Southern Europe. However, to ascertain the impact on actual flood losses we turned to the model.” Modeling the Loss The HD model generated a large set of potential catastrophic flood events and quantified the associated losses. It not only factored in precipitation, but also rainfall runoff, river routing and inundation processes. Critically, the precipitation incorporated the impact of a simulated monthly NAO index as a driver for monthly rainfall. “It showed that seasonal flood losses can increase or decrease by up to 50 percent between positive and negative NAOs, which is very significant,” states Zanardo. “What it also revealed were distinct regional patterns. For example, a positive state resulted in increased flood activity in the U.K. and Germany. These loss patterns provide a spatial correlation of flood risk not previously detected.” Currently, NAO seasonal forecasting is limited to a few months. However, as this window expands, the potential for carriers to factor oscillation phases into flood-related renewal and capital allocation strategies will grow. Further, greater insight into spatial correlation could support more effective portfolio management. “At this stage,” he concludes, “we have confirmed the link between the NAO and flood-related losses. How this evolves to influence carriers’ flood strategies is still to be seen, and a key factor will be advances in the NAO forecasting. What is clear is that oscillations such as the NAO must be included in model assumptions to truly understand flood risk.”
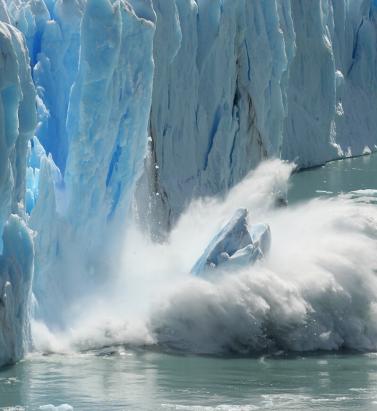
Living in a World of Constant Catastrophes
(Re)insurance companies are waking up to the reality that we are in a riskier world and the prospect of ‘constant catastrophes’ has arrived, with climate change a significant driver In his hotly anticipated annual letter to shareholders in February 2019, Warren Buffett, the CEO of Berkshire Hathaway and acclaimed “Oracle of Omaha,” warned about the prospect of “The Big One” — a major hurricane, earthquake or cyberattack that he predicted would “dwarf Hurricanes Katrina and Michael.” He warned that “when such a mega-catastrophe strikes, we will get our share of the losses and they will be big — very big.” The use of new technology, data and analytics will help us prepare for unpredicted ‘black swan’ events and minimize the catastrophic losses Mohsen Rahnama RMS The question insurance and reinsurance companies need to ask themselves is whether they are prepared for the potential of an intense U.S. landfalling hurricane, a Tōhoku-size earthquake event and a major cyber incident if these types of combined losses hit their portfolio each and every year, says Mohsen Rahnama, chief risk modeling officer at RMS. “We are living in a world of constant catastrophes,” he says. “The risk is changing, and carriers need to make an educated decision about managing the risk. “So how are (re)insurers going to respond to that? The broader perspective should be on managing and diversifying the risk in order to balance your portfolio and survive major claims each year,” he continues. “Technology, data and models can help balance a complex global portfolio across all perils while also finding the areas of opportunity.” A Barrage of Weather Extremes How often, for instance, should insurers and reinsurers expect an extreme weather loss year like 2017 or 2018? The combined insurance losses from natural disasters in 2017 and 2018 according to Swiss Re sigma were US$219 billion, which is the highest-ever total over a two-year period. Hurricanes Harvey, Irma and Maria delivered the costliest hurricane loss for one hurricane season in 2017. Contributing to the total annual insurance loss in 2018 was a combination of natural hazard extremes, including Hurricanes Michael and Florence, Typhoons Jebi, Trami and Mangkhut, as well as heatwaves, droughts, wildfires, floods and convective storms. While it is no surprise that weather extremes like hurricanes and floods occur every year, (re)insurers must remain diligent about how such risks are changing with respect to their unique portfolios. Looking at the trend in U.S. insured losses from 1980–2018, the data clearly shows losses are increasing every year, with climate-related losses being the primary drivers of loss, especially in the last four decades (even allowing for the fact that the completeness of the loss data over the years has improved). Measuring Climate Change With many non-life insurers and reinsurers feeling bombarded by the aggregate losses hitting their portfolios each year, insurance and reinsurance companies have started looking more closely at the impact that climate change is having on their books of business, as the costs associated with weather-related disasters increase. The ability to quantify the impact of climate change risk has improved considerably, both at a macro level and through attribution research, which considers the impact of climate change on the likelihood of individual events. The application of this research will help (re)insurers reserve appropriately and gain more insight as they build diversified books of business. Take Hurricane Harvey as an example. Two independent attribution studies agree that the anthropogenic warming of Earth’s atmosphere made a substantial difference to the storm’s record-breaking rainfall, which inundated Houston, Texas, in August 2017, leading to unprecedented flooding. In a warmer climate, such storms may hold more water volume and move more slowly, both of which lead to heavier rainfall accumulations over land. Attribution studies can also be used to predict the impact of climate change on the return-period of such an event, explains Pete Dailey, vice president of model development at RMS. “You can look at a catastrophic event, like Hurricane Harvey, and estimate its likelihood of recurring from either a hazard or loss point of view. For example, we might estimate that an event like Harvey would recur on average say once every 250 years, but in today’s climate, given the influence of climate change on tropical precipitation and slower moving storms, its likelihood has increased to say a 1-in-100-year event,” he explains. We can observe an incremental rise in sea level annually — it’s something that is happening right in front of our eyes Pete Dailey RMS “This would mean the annual probability of a storm like Harvey recurring has increased more than twofold from 0.4 percent to 1 percent, which to an insurer can have a dramatic effect on their risk management strategy.” Climate change studies can help carriers understand its impact on the frequency and severity of various perils and throw light on correlations between perils and/or regions, explains Dailey. “For a global (re)insurance company with a book of business spanning diverse perils and regions, they want to get a handle on the overall effect of climate change, but they must also pay close attention to the potential impact on correlated events. “For instance, consider the well-known correlation between the hurricane season in the North Atlantic and North Pacific,” he continues. “Active Atlantic seasons are associated with quieter Pacific seasons and vice versa. So, as climate change affects an individual peril, is it also having an impact on activity levels for another peril? Maybe in the same direction or in the opposite direction?” Understanding these “teleconnections” is just as important to an insurer as the more direct relationship of climate to hurricane activity in general, thinks Dailey. “Even though it’s hard to attribute the impact of climate change to a particular location, if we look at the impact on a large book of business, that’s actually easier to do in a scientifically credible way,” he adds. “We can quantify that and put uncertainty around that quantification, thus allowing our clients to develop a robust and objective view of those factors as a part of a holistic risk management approach.” Of course, the influence of climate change is easier to understand and measure for some perils than others. “For example, we can observe an incremental rise in sea level annually — it’s something that is happening right in front of our eyes,” says Dailey. “So, sea-level rise is very tangible in that we can observe the change year over year. And we can also quantify how the rise of sea levels is accelerating over time and then combine that with our hurricane model, measuring the impact of sea-level rise on the risk of coastal storm surge, for instance.” Each peril has a unique risk signature with respect to climate change, explains Dailey. “When it comes to a peril like severe convective storms — tornadoes and hail storms for instance — they are so localized that it’s difficult to attribute climate change to the future likelihood of such an event. But for wildfire risk, there’s high correlation with climate change because the fuel for wildfires is dry vegetation, which in turn is highly influenced by the precipitation cycle.” Satellite data from 1993 through to the present shows there is an upward trend in the rate of sea-level rise, for instance, with the current rate of change averaging about 3.2 millimeters per year. Sea-level rise, combined with increasing exposures at risk near the coastline, means that storm surge losses are likely to increase as sea levels rise more quickly. “In 2010, we estimated the amount of exposure within 1 meter above the sea level, which was US$1 trillion, including power plants, ports, airports and so forth,” says Rahnama. “Ten years later, the exact same exposure was US$2 trillion. This dramatic exposure change reflects the fact that every centimeter of sea-level rise is subjected to a US$2 billion loss due to coastal flooding and storm surge as a result of even small hurricanes. “And it’s not only the climate that is changing,” he adds. “It’s the fact that so much building is taking place along the high-risk coastline. As a result of that, we have created a built-up environment that is actually exposed to much of the risk.” Rahnama highlighted that because of an increase in the frequency and severity of events, it is essential to implement prevention measures by promoting mitigation credits to minimize the risk. He says: “How can the market respond to the significant losses year after year. It is essential to think holistically to manage and transfer the risk to the insurance chain from primary to reinsurance, capital market, ILS, etc.,” he continues. “The art of risk management, lessons learned from past events and use of new technology, data and analytics will help to prepare for responding to unpredicted ‘black swan’ type of events and being able to survive and minimize the catastrophic losses.” Strategically, risk carriers need to understand the influence of climate change whether they are global reinsurers or local primary insurers, particularly as they seek to grow their business and plan for the future. Mergers and acquisitions and/or organic growth into new regions and perils will require an understanding of the risks they are taking on and how these perils might evolve in the future. There is potential for catastrophe models to be used on both sides of the balance sheet as the influence of climate change grows. Dailey points out that many insurance and reinsurance companies invest heavily in real estate assets. “You still need to account for the risk of climate change on the portfolio, whether you’re insuring properties or whether you actually own them, there’s no real difference.” In fact, asset managers are more inclined to a longer-term view of risk when real estate is part of a long-term investment strategy. Here, climate change is becoming a critical part of that strategy. “What we have found is that often the team that handles asset management within a (re)insurance company is an entirely different team to the one that handles catastrophe modeling,” he continues. “But the same modeling tools that we develop at RMS can be applied to both of these problems of managing risk at the enterprise level. “In some cases, a primary insurer may have a one-to-three-year plan, while a major reinsurer may have a five-to-10-year view because they’re looking at a longer risk horizon,” he adds. “Every time I go to speak to a client — whether it be about our U.S. Inland Flood HD Model or our North America Hurricane Models — the question of climate change inevitably comes up. So, it’s become apparent this is no longer an academic question, it’s actually playing into critical business decisions on a daily basis.” Preparing for a Low-carbon Economy Regulation also has an important role in pushing both (re)insurers and large corporates to map and report on the likely impact of climate change on their business, as well as explain what steps they have taken to become more resilient. In the U.K., the Prudential Regulation Authority (PRA) and Bank of England have set out their expectations regarding firms’ approaches to managing the financial risks from climate change. Meanwhile, a survey carried out by the PRA found that 70 percent of U.K. banks recognize the risk climate change poses to their business. Among their concerns are the immediate physical risks to their business models — such as the exposure to mortgages on properties at risk of flood and exposure to countries likely to be impacted by increasing weather extremes. Many have also started to assess how the transition to a low-carbon economy will impact their business models and, in many cases, their investment and growth strategy. “Financial policymakers will not drive the transition to a low-carbon economy, but we will expect our regulated firms to anticipate and manage the risks associated with that transition,” said Bank of England Governor Mark Carney, in a statement. The transition to a low-carbon economy is a reality that (re)insurance industry players will need to prepare for, with the impact already being felt in some markets. In Australia, for instance, there is pressure on financial institutions to withdraw their support from major coal projects. In the aftermath of the Townsville floods in February 2019 and widespread drought across Queensland, there have been renewed calls to boycott plans for Australia’s largest thermal coal mine. To date, 10 of the world’s largest (re)insurers have stated they will not provide property or construction cover for the US$15.5 billion Carmichael mine and rail project. And in its “Mining Risk Review 2018,” broker Willis Towers Watson warned that finding insurance for coal “is likely to become increasingly challenging — especially if North American insurers begin to follow the European lead.”
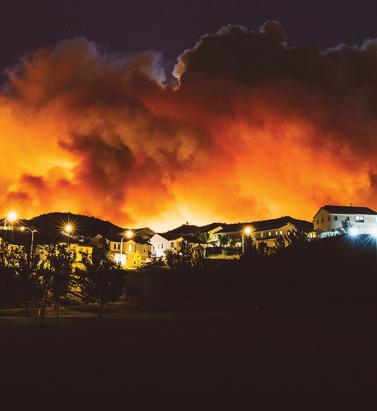
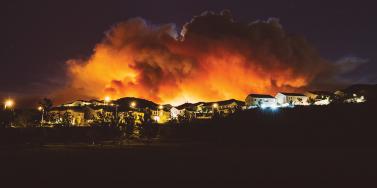
The Flames Burn Higher
With California experiencing two of the most devastating seasons on record in consecutive years, EXPOSURE asks whether wildfire now needs to be considered a peak peril Some of the statistics for the 2018 U.S. wildfire season appear normal. The season was a below-average year for the number of fires reported — 58,083 incidents represented only 84 percent of the 10-year average. The number of acres burned — 8,767,492 acres — was marginally above average at 132 percent. Two factors, however, made it exceptional. First, for the second consecutive year, the Great Basin experienced intense wildfire activity, with some 2.1 million acres burned — 233 percent of the 10-year average. And second, the fires destroyed 25,790 structures, with California accounting for over 23,600 of the structures destroyed, compared to a 10-year U.S. annual average of 2,701 residences, according to the National Interagency Fire Center. As of January 28, 2019, reported insured losses for the November 2018 California wildfires, which included the Camp and Woolsey Fires, were at US$11.4 billion, according to the California Department of Insurance. Add to this the insured losses of US$11.79 billion reported in January 2018 for the October and December 2017 California events, and these two consecutive wildfire seasons constitute the most devastating on record for the wildfire-exposed state. Reaching its Peak? Such colossal losses in consecutive years have sent shockwaves through the (re)insurance industry and are forcing a reassessment of wildfire’s secondary status in the peril hierarchy. According to Mark Bove, natural catastrophe solutions manager at Munich Reinsurance America, wildfire’s status needs to be elevated in highly exposed areas. “Wildfire should certainly be considered a peak peril in areas such as California and the Intermountain West,” he states, “but not for the nation as a whole.” His views are echoed by Chris Folkman, senior director of product management at RMS. “Wildfire can no longer be viewed purely as a secondary peril in these exposed territories,” he says. “Six of the top 10 fires for structural destruction have occurred in the last 10 years in the U.S., while seven of the top 10, and 10 of the top 20 most destructive wildfires in California history have occurred since 2015. The industry now needs to achieve a level of maturity with regard to wildfire that is on a par with that of hurricane or flood.” “Average ember contributions to structure damage and destruction is approximately 15 percent, but in a wind-driven event such as the Tubbs Fire this figure is much higher” Chris Folkman RMS However, he is wary about potential knee-jerk reactions to this hike in wildfire-related losses. “There is a strong parallel between the 2017-18 wildfire seasons and the 2004-05 hurricane seasons in terms of people’s gut instincts. 2004 saw four hurricanes make landfall in Florida, with K-R-W causing massive devastation in 2005. At the time, some pockets of the industry wondered out loud if parts of Florida were uninsurable. Yet the next decade was relatively benign in terms of hurricane activity. “The key is to adopt a balanced, long-term view,” thinks Folkman. “At RMS, we think that fire severity is here to stay, while the frequency of big events may remain volatile from year-to-year.” A Fundamental Re-evaluation The California losses are forcing (re)insurers to overhaul their approach to wildfire, both at the individual risk and portfolio management levels. “The 2017 and 2018 California wildfires have forced one of the biggest re-evaluations of a natural peril since Hurricane Andrew in 1992,” believes Bove. “For both California wildfire and Hurricane Andrew, the industry didn’t fully comprehend the potential loss severities. Catastrophe models were relatively new and had not gained market-wide adoption, and many organizations were not systematically monitoring and limiting large accumulation exposure in high-risk areas. As a result, the shocks to the industry were similar.” For decades, approaches to underwriting have focused on the wildland-urban interface (WUI), which represents the area where exposure and vegetation meet. However, exposure levels in these areas are increasing sharply. Combined with excessive amounts of burnable vegetation, extended wildfire seasons, and climate-change-driven increases in temperature and extreme weather conditions, these factors are combining to cause a significant hike in exposure potential for the (re)insurance industry. A recent report published in PNAS entitled “Rapid Growth of the U.S. Wildland-Urban Interface Raises Wildfire Risk” showed that between 1990 and 2010 the new WUI area increased by 72,973 square miles (189,000 square kilometers) — larger than Washington State. The report stated: “Even though the WUI occupies less than one-tenth of the land area of the conterminous United States, 43 percent of all new houses were built there, and 61 percent of all new WUI houses were built in areas that were already in the WUI in 1990 (and remain in the WUI in 2010).” “The WUI has formed a central component of how wildfire risk has been underwritten,” explains Folkman, “but you cannot simply adopt a black-and-white approach to risk selection based on properties within or outside of the zone. As recent losses, and in particular the 2017 Northern California wildfires, have shown, regions outside of the WUI zone considered low risk can still experience devastating losses.” For Bove, while focus on the WUI is appropriate, particularly given the Coffey Park disaster during the 2017 Tubbs Fire, there is not enough focus on the intermix areas. This is the area where properties are interspersed with vegetation. “In some ways, the wildfire risk to intermix communities is worse than that at the interface,” he explains. “In an intermix fire, you have both a wildfire and an urban conflagration impacting the town at the same time, while in interface locations the fire has largely transitioned to an urban fire. “In an intermix community,” he continues, “the terrain is often more challenging and limits firefighter access to the fire as well as evacuation routes for local residents. Also, many intermix locations are far from large urban centers, limiting the amount of firefighting resources immediately available to start combatting the blaze, and this increases the potential for a fire in high-wind conditions to become a significant threat. Most likely we’ll see more scrutiny and investigation of risk in intermix towns across the nation after the Camp Fire’s decimation of Paradise, California.” Rethinking Wildfire Analysis According to Folkman, the need for greater market maturity around wildfire will require a rethink of how the industry currently analyzes the exposure and the tools it uses. “Historically, the industry has relied primarily upon deterministic tools to quantify U.S. wildfire risk,” he says, “which relate overall frequency and severity of events to the presence of fuel and climate conditions, such as high winds, low moisture and high temperatures.” While such tools can prove valuable for addressing “typical” wildland fire events, such as the 2017 Thomas Fire in Southern California, their flaws have been exposed by other recent losses. Burning Wildfire at Sunset “Such tools insufficiently address major catastrophic events that occur beyond the WUI into areas of dense exposure,” explains Folkman, “such as the Tubbs Fire in Northern California in 2017. Further, the unprecedented severity of recent wildfire events has exposed the weaknesses in maintaining a historically based deterministic approach.” While the scale of the 2017-18 losses has focused (re)insurer attention on California, companies must also recognize the scope for potential catastrophic wildfire risk extends beyond the boundaries of the western U.S. “While the frequency and severity of large, damaging fires is lower outside California,” says Bove, “there are many areas where the risk is far from negligible.” While acknowledging that the broader western U.S. is seeing increased risk due to WUI expansion, he adds: “Many may be surprised that similar wildfire risk exists across most of the southeastern U.S., as well as sections of the northeastern U.S., like in the Pine Barrens of southern New Jersey.” As well as addressing the geographical gaps in wildfire analysis, Folkman believes the industry must also recognize the data gaps limiting their understanding. “There are a number of areas that are understated in underwriting practices currently, such as the far-ranging impacts of ember accumulations and their potential to ignite urban conflagrations, as well as vulnerability of particular structures and mitigation measures such as defensible space and fire-resistant roof coverings.” In generating its US$9 billion to US$13 billion loss estimate for the Camp and Woolsey Fires, RMS used its recently launched North America Wildfire High-Definition (HD) Models to simulate the ignition, fire spread, ember accumulations and smoke dispersion of the fires. “In assessing the contribution of embers, for example,” Folkman states, “we modeled the accumulation of embers, their wind-driven travel and their contribution to burn hazard both within and beyond the fire perimeter. Average ember contributions to structure damage and destruction is approximately 15 percent, but in a wind-driven event such as the Tubbs Fire this figure is much higher. This was a key factor in the urban conflagration in Coffey Park.” The model also provides full contiguous U.S. coverage, and includes other model innovations such as ignition and footprint simulations for 50,000 years, flexible occurrence definitions, smoke and evacuation loss across and beyond the fire perimeter, and vulnerability and mitigation measures on which RMS collaborated with the Insurance Institute for Business & Home Safety. Smoke damage, which leads to loss from evacuation orders and contents replacement, is often overlooked in risk assessments, despite composing a tangible portion of the loss, says Folkman. “These are very high-frequency, medium-sized losses and must be considered. The Woolsey Fire saw 260,000 people evacuated, incurring hotel, meal and transport-related expenses. Add to this smoke damage, which often results in high-value contents replacement, and you have a potential sea of medium-sized claims that can contribute significantly to the overall loss.” A further data resolution challenge relates to property characteristics. While primary property attribute data is typically well captured, believes Bove, many secondary characteristics key to wildfire are either not captured or not consistently captured. “This leaves the industry overly reliant on both average model weightings and risk scoring tools. For example, information about defensible spaces, roofing and siding materials, protecting vents and soffits from ember attacks, these are just a few of the additional fields that the industry will need to start capturing to better assess wildfire risk to a property.” A Highly Complex Peril Bove is, however, conscious of the simple fact that “wildfire behavior is extremely complex and non-linear.” He continues: “While visiting Paradise, I saw properties that did everything correct with regard to wildfire mitigation but still burned and risks that did everything wrong and survived. However, mitigation efforts can improve the probability that a structure survives.” “With more data on historical fires,” Folkman concludes, “more research into mitigation measures and increasing awareness of the risk, wildfire exposure can be addressed and managed. But it requires a team mentality, with all parties — (re)insurers, homeowners, communities, policymakers and land-use planners — all playing their part.”

Are We Moving Off The Baseline?
How is climate change influencing natural perils and weather extremes, and what should reinsurance companies do to respond? Reinsurance companies may feel they are relatively insulated from the immediate effects of climate change on their business, given that most property catastrophe policies are renewed on an annual basis. However, with signs that we are already moving off the historical baseline when it comes to natural perils, there is evidence to suggest that underwriters should already be selectively factoring the influence of climate change into their day-to-day decision-making. Most climate scientists agree that some of the extreme weather anticipated by the United Nations Intergovernmental Panel on Climate Change (IPCC) in 2013 is already here and can be linked to climate change in real time via the burgeoning field of extreme weather attribution. “It’s a new area of science that has grown up in the last 10 to 15 years,” explains Dr. Robert Muir-Wood, chief research officer at RMS. “Scientists run two climate models for the whole globe, both of them starting in 1950. One keeps the atmospheric chemistry static since then, while the other reflects the actual increase in greenhouse gases. By simulating thousands of years of these alternative worlds, we can find the difference in the probability of a particular weather extreme.” “Underwriters should be factoring the influence of climate change into their day-to-day decision-making” For instance, climate scientists have run their models in an effort to determine how much the intensity of the precipitation that caused such devastating flooding during last year’s Hurricane Harvey can be attributed to anthropogenic climate change. Research conducted by scientists at the World Weather Attribution (WWA) project has found that the record rainfall produced by Harvey was at least three times more likely to be due to the influence of global warming. This suggests, for certain perils and geographies, reinsurers need to be considering the implications of an increased potential for certain climate extremes in their underwriting. “If we can’t rely on the long-term baseline, how and where do we modify our perspective?” asks Muir-Wood. “We need to attempt to answer this question peril by peril, region by region and by return period. You cannot generalize and say that all perils are getting worse everywhere, because they’re not. In some countries and perils there is evidence that the changes are already material, and then in many other areas the jury is out and it’s not clear.” Keeping Pace With the Change While the last IPCC Assessment Report (AR5) was published in 2014 (the next is due in 2021), there is some consensus on how climate change is beginning to influence natural perils and climate extremes. Many regional climates naturally have large variations at interannual and even interdecadal timescales, which makes observation of climate change, and validation of predictions, more difficult. “There is always going to be uncertainty when it comes to climate change,” emphasizes Swenja Surminski, head of adaptation research at the Grantham Research Institute on Climate Change and the Environment, part of the London School of Economics and Political Science (LSE). “But when you look at the scientific evidence, it’s very clear what’s happening to temperature, how the average temperature is increasing, and the impact that this can have on fundamental things, including extreme events.” According to the World Economic Forum’s Global Risks Report in 2018, “Too little has been done to mitigate climate change and … our own analysis shows that the likelihood of missing the Paris Agreement target of limiting global warming to two degrees Celsius or below is greater than the likelihood of achieving it.” The report cites extreme weather events and natural disasters as the top two “most likely” risks to happen in the next 10 years and the second- and third-highest risks (in the same order) to have the “biggest impact” over the next decade, after weapons of mass destruction. The failure of climate change mitigation and adaptation is also ranked in the top five for both likelihood and impact. It notes that 2017 was among the three hottest years on record and the hottest ever without an El Niño. It is clear that climate change is already exacerbating climate extremes, says Surminski, causing dry regions to become drier and hot regions to become hotter. “By now, based on our scientific understanding and also thanks to modeling, we get a much better picture of what our current exposure is and how that might be changing over the next 10, 20, even 50 to 100 years,” she says. “There is also an expectation we will have more freak events, when suddenly the weather produces really unexpected, very unusual phenomena,” she continues. “That’s not just climate change. It’s also tied into El Niño and other weather phenomena occurring, so it’s a complex mix. But right now, we’re in a much better position to understand what’s going on and to appreciate that climate change is having an impact.” Pricing for Climate Change For insurance and reinsurance underwriters, the challenge is to understand the extent to which we have already deviated from the historical record and to manage and price for that appropriately. It is not an easy task given the inherent variability in existing weather patterns, according to Andy Bord, CEO of Flood Re, the U.K.’s flood risk pool, which has a panel of international reinsurers. “The existing models are calibrated against data that already includes at least some of the impact of climate change,” he says. “Some model vendors have also recently produced models that aim to assess the impact of climate change on the future level of flood risk in the U.K. We know at least one larger reinsurer has undertaken their own climate change impact analyses. “We view improving the understanding of the potential variability of weather given today’s climate as being the immediate challenge for the insurance industry, given the relatively short-term view of markets,” he adds. The need for underwriters to appreciate the extent to which we may have already moved off the historical baseline is compounded by the conflicting evidence on how climate change is influencing different perils. And by the counterinfluence or confluence, in many cases, of naturally occurring climate patterns, such as El Niño and the Atlantic Multidecadal Oscillation (AMO). The past two decades have seen below-normal European windstorm activity, for instance, and evidence builds that the unprecedented reduction in Arctic sea ice during the autumn months is the main cause, according to Dr. Stephen Cusack, director of model development at RMS. “In turn, the sea ice declines have been driven both by the ‘polar amplification’ aspect of anthropogenic climate change and the positive phase of the AMO over the past two decades, though their relative roles are uncertain. “We view improving the understanding of the potential variability of weather given today’s climate as being the immediate challenge for the insurance industry, given the relatively short-term view of markets” Andy Bord Flood Re “The (re)insurance market right now is saying, ‘Your model has higher losses than our recent experience.’ And what we are saying is that the recent lull is not well understood, and we are unsure how long it will last. Though for pricing future risk, the question is when, and not if, the rebound in European windstorm activity happens. Regarding anthropogenic climate change, other mechanisms will strengthen and counter the currently dominant ‘polar amplification’ process. Also, the AMO goes into positive and negative phases,” he continues. “It’s been positive for the last 20 to 25 years and that’s likely to change within the next decade or so.” And while European windstorm activity has been somewhat muted by the AMO, the same cannot be said for North Atlantic hurricane activity. Hurricanes Harvey, Irma and Maria (HIM) caused an estimated US$92 billion in insured losses, making 2017 the second costliest North Atlantic hurricane season, according to Swiss Re Sigma. “The North Atlantic seems to remain in an active phase of hurricane activity, irrespective of climate change influences that may come on top of it,” the study states. While individual storms are never caused by one factor alone, stressed the Sigma study, “Some of the characteristics observed in HIM are those predicted to occur more frequently in a warmer world.” In particular, it notes the high level of rainfall over Houston and hurricane intensification. While storm surge was only a marginal contributor to the losses from Hurricane Harvey, Swiss Re anticipates the probability of extreme storm surge damage in the northeastern U.S. due to higher seas will almost double in the next 40 years. “From a hurricane perspective, we can talk about the frequency of hurricanes in a given year related to the long-term average, but what’s important from the climate change point of view is that the frequency and the intensity on both sides of the distribution are increasing,” says Dr. Pete Dailey, vice president at RMS. “This means there’s more likelihood of quiet years and more likelihood of very active years, so you’re moving away from the mean, which is another way of thinking about moving away from the baseline. “So, we need to make sure that we are modeling the tail of the distribution really well, and that we’re capturing the really wet years — the years where there’s a higher frequency of torrential rain in association with events that we model.” The Edge of Insurability Over the long term, the industry likely will be increasingly insuring the impact of anthropogenic climate change. One question is whether we will see “no-go” areas in the future, where the risk is simply too high for insurance and reinsurance companies to take on. As Robert Muir-Wood of RMS explains, there is often a tension between the need for (re)insurers to charge an accurate price for the risk and the political pressure to ensure cover remains available and affordable. He cites the community at Queen’s Cove in Grand Bahama, where homes were unable to secure insurance given the repeated storm surge flood losses they have sustained over the years from a number of hurricanes. Unable to maintain a mortgage without insurance, properties were left to fall into disrepair. “Natural selection came up with a solution,” says Muir-Wood, whereby some homeowners elevated buildings on concrete stilts thereby making them once again insurable. “In high-income, flood-prone countries, such as Holland, there has been sustained investment in excellent flood defenses,” he says. “The challenge in developing countries is there may not be the money or the political will to build adequate flood walls. In a coastal city like Jakarta, Indonesia, where the land is sinking as a result of pumping out the groundwater, it’s a huge challenge. “It’s not black and white as to when it becomes untenable to live somewhere. People will find a way of responding to increased incidence of flooding. They may simply move their life up a level, as already happens in Venice, but insurability will be a key factor and accommodating the changes in flood hazard is going to be a shared challenge in coastal areas everywhere.” Political pressure to maintain affordable catastrophe insurance was a major driver of the U.S. residual market, with state-backed Fair Access to Insurance Requirements (FAIR) plans providing basic property insurance for homes that are highly exposed to natural catastrophes. Examples include the California Earthquake Association, Texas Windstorm Insurance Association and Florida Citizens Property Insurance Corporation (and state reinsurer, the FHCF). However, the financial woes experienced by FEMA’s National Flood Insurance Program (NFIP), currently the principal provider of residential flood insurance in the U.S., demonstrates the difficulties such programs face in terms of being sustainable over the long term. With the U.K.’s Flood Re scheme, investment in disaster mitigation is a big part of the solution, explains CEO Andy Bord. However, even then he acknowledges that “for some homes at the very greatest risk of flooding, the necessary investment needed to reduce risks and costs would simply be uneconomic.”
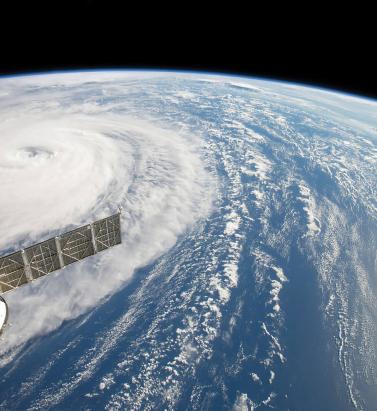

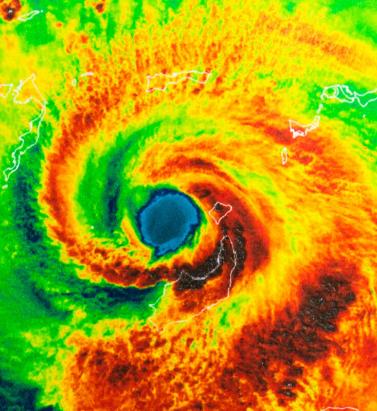
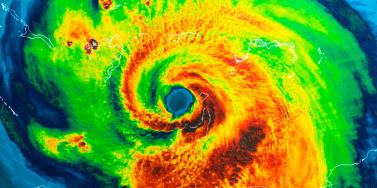
Making it Clear
Pete Dailey of RMS explains why model transparency is critical to client confidence View of Hurricane Harvey from space In the aftermath of Hurricances Harvey, Irma and Maria (HIM), there was much comment on the disparity among the loss estimates produced by model vendors. Concerns have been raised about significant outlier results released by some modelers. “It’s no surprise,” explains Dr. Pete Dailey, vice president at RMS, “that vendors who approach the modeling differently will generate different estimates. But rather than pushing back against this, we feel it’s critical to acknowledge and understand these differences. “At RMS, we develop probabilistic models that operate across the full model space and deliver that insight to our clients. Uncertainty is inherent within the modeling process for any natural hazard, so we can’t rely solely on past events, but rather simulate the full range of plausible future events.” There are multiple components that contribute to differences in loss estimates, including the scientific approaches and technologies used and the granularity of the exposure data. “Increased demand for more immediate data is encouraging modelers to push the envelope” “As modelers, we must be fully transparent in our loss-estimation approach,” he states. “All apply scientific and engineering knowledge to detailed exposure data sets to generate the best possible estimates given the skill of the model. Yet the models always provide a range of opinion when events happen, and sometimes that is wider than expected. Clients must know exactly what steps we take, what data we rely upon, and how we apply the models to produce our estimates as events unfold. Only then can stakeholders conduct the due diligence to effectively understand the reasons for the differences and make important financial decisions accordingly.” Outlier estimates must also be scrutinized in greater detail. “There were some outlier results during HIM, and particularly for Hurricane Maria. The onus is on the individual modeler to acknowledge the disparity and be fully transparent about the factors that contributed to it. And most importantly, how such disparity is being addressed going forward,” says Dailey. “A ‘big miss’ in a modeled loss estimate generates market disruption, and without clear explanation this impacts the credibility of all catastrophe models. RMS models performed quite well for Maria. One reason for this was our detailed local knowledge of the building stock and engineering practices in Puerto Rico. We’ve built strong relationships over the years and made multiple visits to the island, and the payoff for us and our client comes when events like Maria happen.” As client demand for real-time and pre-event estimates grows, the data challenge placed on modelers is increasing. “Demand for more immediate data is encouraging modelers like RMS to push the scientific envelope,” explains Dailey, “as it should. However, we need to ensure all modelers acknowledge, and to the degree possible quantify, the difficulties inherent in real-time loss estimation — especially since it’s often not possible to get eyes on the ground for days or weeks after a major catastrophe.” Much has been said about the need for modelers to revise initial estimates months after an event occurs. Dailey acknowledges that while RMS sometimes updates its estimates, during HIM the strength of early estimates was clear. “In the months following HIM, we didn’t need to significantly revise our initial loss figures even though they were produced when uncertainty levels were at their peak as the storms unfolded in real time,” he states. “The estimates for all three storms were sufficiently robust in the immediate aftermath to stand the test of time. While no one knows what the next event will bring, we’re confident our models and, more importantly, our transparent approach to explaining our estimates will continue to build client confidence.”
