


EXPOSURE
The RMS Magazine with a unique perspective and clear mission “... to provide insight and analysis to help insurance and risk professionals innovate, adapt, and deliver.”

Insurance: The next 10 years
Mohsen Rahnama, Cihan Biyikoglu and Moe Khosravy of RMS look to 2029, consider the…
Times Square, New York City
Reset Filters
Industry
- 2022
- 2021
- 2020
- 2019
- 2018
- 2017
- 2016
Assigning a Return Period to 2017
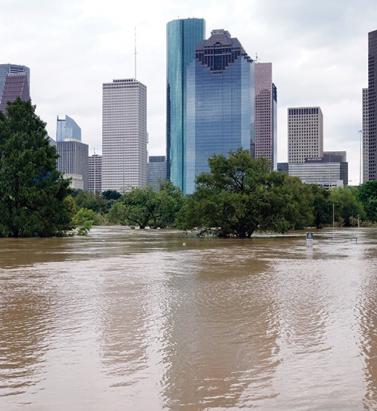
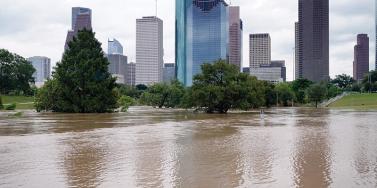
Hurricanes Harvey, Irma and Maria (HIM) tore through the Caribbean and U.S. in 2017, resulting in insured losses over US$80 billion. Twelve years after Hurricanes Katrina, Rita and Wilma (KRW), EXPOSURE asks if the (re)insurance industry was better prepared for its next ‘terrible trio’ and what lessons can be learned In one sense, 2017 was a typical loss year for the insurance industry in that the majority of losses stemmed from the “peak zone” of U.S. hurricanes. However, not since the 2004-05 season had the U.S. witnessed so many landfalling hurricanes. It was the second most costly hurricane season on record for the (re)insurance industry, when losses in 2005 are adjusted for inflation. According to Aon Benfield, HIM caused total losses over US$220 billion and insured losses over US$80 billion — huge sums in the context of global catastrophe losses for the year of US$344 billion and insured losses of US$134 billion. Overall, weather-related catastrophe losses exceeded 0.4 percent of global GDP in 2017 (based on data from Aon Benfield, Munich Re and the World Bank), the second highest figure since 1990. In that period, only 2005 saw a higher relative catastrophe loss at around 0.5 percent of GDP. But, it seems, (re)insurers were much better prepared to absorb major losses this time around. Much has changed in the 12 years since Hurricane Katrina breached the levees in New Orleans. Catastrophe modeling as a profession has evolved into exposure management, models and underlying data have improved and there is a much greater appreciation of model uncertainty and assumptions, explains Alan Godfrey, head of exposure management at Asta. “Even post-2005 people would still see an event occurring, go to the models and pull out a single event ID … then tell all and sundry this is what we’re going to lose. And that’s an enormous misinterpretation of how the models are supposed to be used. In 2017, people demonstrated a much greater maturity and used the models to advise their own loss estimates, and not the other way around.” It also helped that the industry was extremely well-capitalized moving into 2017. After a decade of operating through a low interest rate and increasingly competitive environment, (re)insurers had taken a highly disciplined approach to capital management. Gone are the days where a major event sparked a series of run-offs. While some (re)insurers have reported higher losses than others, all have emerged intact. “In 2017 the industry has performed incredibly well from an operational point of view,” says Godfrey. “There have obviously been challenges from large losses and recovering capital, but those are almost outside of exposure management.” According to Aon Benfield, global reinsurance capacity grew by 80 percent between 1990 and 2017 (to US$605 billion), against global GDP growth of around 24 percent. The influx of capacity from the capital markets into U.S. property catastrophe reinsurance has also brought about change and innovation, offering new instruments such as catastrophe bonds for transferring extreme risks. Harvey broke all U.S. records for tropical cyclone-driven rainfall with observed cumulative rainfall of 51 inches Much of this growth in non-traditional capacity has been facilitated by better data and more sophisticated analytics, along with a healthy appetite for insurance risk from pension funds and other institutional investors. For insurance-linked securities (ILS), the 2017 North Atlantic hurricane season, Mexico’s earthquakes and California’s wildfires were their first big test. “Some thought that once we had a significant year that capital would leave the market,” says John Huff, president and chief executive of the Association of Bermuda Insurers and Reinsurance (ABIR). “And we didn’t see that. “In January 2018 we saw that capital being reloaded,” he continues. “There is abundant capital in all parts of the reinsurance market. Deploying that capital with a reasonable rate of return is, of course, the objective.” Huff thinks the industry performed extremely well in 2017 in spite of the severity of the losses and a few surprises. “I’ve even heard of reinsurers that were ready with claim payments on lower layers before the storm even hit. The modeling and ability to track the weather is getting more sophisticated. We saw some shifting of the storms — Irma was the best example — but reinsurers were tracking that in real time in order to be able to respond.” The Buffalo Bayou River floods a park in Houston after the arrival of Hurricane Harvey How Harvey Inundated Houston One lesson the industry has learned over three decades of modeling is that models are approximations of reality. Each event has its own unique characteristics, some of which fall outside of what is anticipated by the models. The widespread inland flooding that occurred after Hurricane Harvey made landfall on the Texas coastline is an important illustration of this, explains Huff. Even so, he adds, it continued a theme, with flood losses being a major driver of U.S. catastrophe claims for several years now. “What we’re seeing is flood events becoming the No. 1 natural disaster in the U.S. for people who never thought they were at risk of flood.” Harvey broke all U.S. records for tropical cyclone-driven rainfall with observed cumulative rainfall of 51 inches (129 centimeters). The extreme rainfall generated by Harvey and the unprecedented inland flooding across southeastern Texas and parts of southern Louisiana was unusual. However, nobody was overly surprised by the fact that losses from Harvey were largely driven by water versus wind. Prior events with significant storm surge-induced flooding, including Hurricane Katrina and 2012’s Superstorm Sandy, had helped to prepare (re)insurers, exposure managers and modelers for this eventuality. “The events themselves were very large but they were well within uncertainty ranges and not disproportionate to expectations,” says Godfrey. “Harvey is a new data point — and we don’t have that many — so the scientists will look at it and know that any new data point will lead to tweaks,” he continues. “If anything, it will make people spend a bit more time on their calibration for the non-modeled elements of hurricane losses, and some may conclude that big changes are needed to their own adjustments.” But, he adds: “Nobody is surprised by the fact that flooding post-hurricane causes loss. We know that now. It’s more a case of tweaking and calibrating, which we will be doing for the rest of our lives.” Flood Modeling Hurricane Harvey also underscored the importance of the investment in sophisticated, probabilistic flood models. RMS ran its U.S. Inland Flood HD Model in real time to estimate expected flood losses. “When Hurricane Harvey happened, we had already simulated losses of that magnitude in our flood model, even before the event occurred,” says Dr. Pete Dailey, vice president of product management and responsible for U.S. flood modeling at RMS. “The value of the model is to be able to anticipate extreme tail events well before they occur, so that insurance companies can be prepared in advance for the kind of risk they’re taking on and what potential claims volume they may have after a major event,” he adds. Does this mean that a US$100 billion-plus loss year like 2017 is now a 1-in-6-year event? Harvey has already offered a wealth of new data that will be fed into the flood model. The emergency shutdown of the Houston metropolitan area prevented RMS meteorologists and engineers from accessing the scene in the immediate aftermath, explains Dailey. However, once on the ground they gathered as much information as they could, observing and recording what had actually happened to affected properties. “We go to individual properties to assess the damage visually, record the latitude and longitude of the property, the street address, the construction, occupancy and the number of stories,” he says. “We will also make an estimate of the age of the property. Those basic parameters allow us to go back and take a look at what the model would have predicted in terms of damage and loss, as compared to what we observed.” The fact that insured losses emanating from the flooding were only a fraction of the total economic losses is an inevitable discussion point. The majority of claims paid were for commercial properties, with residential properties falling under the remit of the National Flood Insurance Program (NFIP). Many residential homes were uninsured, however, explains ABIR’s Huff. “The NFIP covers just the smallest amount of people — there are only five million policies — and yet you see a substantial event like Harvey which is largely uninsured because (re)insurance companies only cover commercial flood in the U.S.,” he says. “After Harvey you’ll see a realization that the private market is very well-equipped to get back into the private flood business, and there’s a national dialogue going on now.” Is 2017 the New Normal? One question being asked in the aftermath of the 2017 hurricane season is: What is the return period for a loss year like 2017? RMS estimates that, in terms of U.S. and Caribbean industry insured wind, storm surge and flood losses, the 2017 hurricane season corresponds to a return period between 15 and 30 years. However, losses on the scale of 2017 occur more frequently when considering global perils. Adjusted for inflation, it is seven years since the industry paid out a similar level of catastrophe claims — US$110 billion on the Tohoku earthquake and tsunami, Thai floods and New Zealand earthquake in 2011. Six years prior to that, KRW cost the industry in excess of US$75 billion (well over US$100 billion in today’s money). So, does this mean that a US$100 billion-plus (or equivalent in inflation-adjusted terms) loss year like 2017 is now a one-in-six-year event? As wealth and insurance penetration grows in developing parts of the world, will we begin to see more loss years like 2011, where catastrophe claims are not necessarily driven by the U.S. or Japan peak zones? “Increased insurance penetration does mean that on the whole losses will increase, but hopefully this is proportional to the premiums and capital that we are getting in,” says Asta’s Godfray. “The important thing is understanding correlations and how diversification actually works and making sure that is applied within business models. “In the past, people were able to get away with focusing on the world in a relatively binary fashion,” he continues. “The more people move toward diversified books of business, which is excellent for efficient use of capital, the more important it becomes to understand the correlations between different regions.” “You could imagine in the future, a (re)insurer making a mistake with a very sophisticated set of catastrophe and actuarial models,” he adds. “They may perfectly take into account all of the non-modeled elements but get the correlations between them all wrong, ending up with another year like 2011 where the losses across the globe are evenly split, affecting them far more than their models had predicted.” As macro trends including population growth, increasing wealth, climate change and urbanization influence likely losses from natural catastrophes, could this mean a shorter return period for years like last year, where industry losses exceeded US$134 billion? “When we look at the average value of properties along the U.S. coastline — the Gulf Coast and East Coast — there’s a noticeable trend of increasing value at risk,” says Dailey. “That is because people are building in places that are at risk of wind damage from hurricanes and coastal flooding. And these properties are of a higher value because they are more complex, have a larger square footage and have more stories. Which all leads to a higher total insured value. “The second trend that we see would be from climate change whereby the storms that produce damage along the coastline may be increasing in frequency and intensity,” he continues. “That’s a more difficult question to get a handle on but there’s a building consensus that while the frequency of hurricane landfalls may not necessarily be increasing, those that do make landfall are increasing in intensity.” Lloyd’s chief executive Inga Beale has stated her concerns about the impact of climate change, following the market’s £4.5 billion catastrophe claims bill for 2017. “That’s a significant number, more than double 2016; we’re seeing the impact of climate change to a certain extent, particularly on these weather losses, with the rising sea level that impacts and increases the amount of loss,” she said in an interview with Bloomberg. While a warming climate is expected to have significant implications for the level of losses arising from storms and other severe weather events, it is not yet clear exactly how this will manifest, according to Tom Sabbatelli, senior product manager at RMS. “We know the waters have risen several centimeters in the last couple of decades and we can use catastrophe models to quantify what sort of impact that has on coastal flooding, but it’s also unclear what that necessarily means for tropical cyclone strength. “The oceans may be warming, but there’s still an ongoing debate about how that translates into cyclone intensity, and that’s been going on for a long time,” he continues. “The reason for that is we just don’t know until we have the benefit of hindsight. We haven’t had a number of major hurricanes in the last few years, so does that mean that the current climate is quiet in the Atlantic? Is 2017 an anomaly or are we going back to more regular severe activity? It’s not until you’re ten or 20 years down the line and you look back that you know for sure.”
In the Eye of the Storm
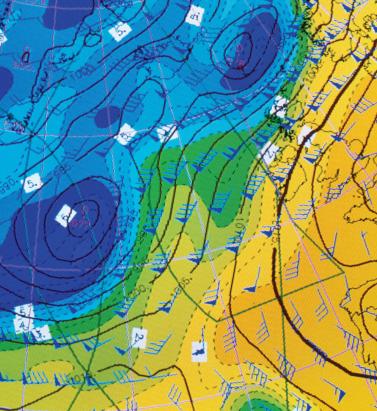
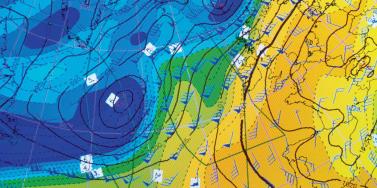
Advances in data capture are helping to give (re)insurers an unparalleled insight into weather-related activity Weather-related data is now available on a much more localized level than ever before. Rapidly expanding weather station networks are capturing terabytes of data across multiple weather-related variables on an almost real-time basis, creating a “ground-truth” clarity multiple times sharper than that available only a few years ago. In fact, so hyperlocalized has this data become that it is now possible to capture weather information “down to a city street corner in some cases,” according to Earth Networks’ chief meteorologist Mark Hoekzema. “The greater the resolution of the data, the more accurate the damage verification” Mark Hoekzema earth networks This ground-level data is vital to the insurance industry given the potential for significant variations in sustained damage levels from one side of the street to the other during weather-related events, he adds. “Baseball-sized hail can fall on one side of the street while just a block over there might be only pea-sized hail and no damage. Tornados and lightning can decimate a neighborhood and leave a house untouched on the same street. The greater the resolution of the data, the more accurate the damage verification.” High-Resolution Perils This granularity of data is needed to fuel the high-resolution modeling capabilities that have become available over the last five to ten years. “With the continued increase in computational power,” Hoekzema explains, “the ability to run models at very high resolutions has become commonplace. Very high-resolution inputs are needed for these models to get the most out of the computations.” In July 2017, RMS teamed up with Earth Networks, capitalizing on its vast network of stations across North America and the Caribbean and reams of both current and historical data to feed into RMS HWind tropical cyclone wind field data products. “Through our linkup with Earth Networks, RMS has access to data from over 6,000 proprietary weather stations across the Americas and Caribbean, particularly across the U.S.,” explains Jeff Waters, senior product manager of model product management at RMS. “That means we can ingest data on multiple meteorological variables in almost real time: wind speed, wind direction and sea level pressure. “By integrating this ground-level data from Earth Networks into the HWind framework, we can generate a much more comprehensive, objective and accurate view of a tropical cyclone’s wind field as it progresses and evolves throughout the Atlantic Basin.” Another key advantage of the specific data the firm provides is that many of the stations are situated in highly built-up areas. “This helps us get a much more accurate depiction of wind speeds and hazards in areas where there are significant amounts of exposure,” Waters points out. According to Hoekzema, this data helps RMS gain a much more defined picture of how tropical cyclone events are evolving. “Earth Networks has thousands of unique observation points that are available to RMS for their proprietary analysis. The network provides unique locations along the U.S. coasts and across the Caribbean. These locations are live observation points, so data can be ingested at high temporal resolutions.” Across the Network Earth Networks operates the world’s largest weather network, with more than 12,000 neighborhood-level sensors installed at locations such as schools, businesses and government buildings. “Our stations are positioned on sturdy structures and able to withstand the worst weather a hurricane can deliver,” explains Hoekzema. Being positioned at such sites also means that the stations benefit from more reliable power sources and can capitalize on high-speed Internet connectivity to ensure the flow of data is maintained during extreme events. In September 2017, an Earth Networks weather station located at the Naples Airport in Florida was the source for one of the highest-recorded wind gusts from Hurricane Irma, registering 131 miles per hour. “The station operated through the entire storm,” he adds. “Through our linkup with Earth Networks … we can ingest data on multiple meteorological variables in almost real time” Jeff waters RMS This network of stations collates a colossal amount of data, with Earth Networks processing some 25 terabytes of data relating to over 25 weather variables on a daily basis, with information refreshed every few minutes. “The weather stations record many data elements,” he says, “including temperature, wind speed, wind gust, wind direction, humidity, dew point and many others. Because the stations are sending data in real time, Earth Networks stations also send very reliable rate information — or how the values are changing in real time. Real-time rate information provides valuable data on how a storm is developing and moving and what extreme changes could be happening on the ground.” Looking Further Ahead For RMS, such pinpoint data is not only helping ensure a continuous data feed during major tropical cyclone events but will also contribute to efforts to enhance the quality of insights delivered prior to landfall. “We’re currently working on the forecasting component of our HWind product suite,” says Waters. “Harnessing this hyperlocal data alongside weather forecast models will help us gain a more accurate picture of possible track and intensity scenarios leading up to landfall, and allow users to quantify the potential impacts to their book of business should some of these scenarios pan out.” RMS is also looking at the possibility of capitalizing on Earth Networks’ data for other perils, including flooding and wildfire, with the company set to release its North America Wildfire HD Models in the fall. For Earth Networks, the firm is capitalizing on new technologies to expand its data reach. “Weather data is being captured by autonomous vehicles such as self-driving cars and drones,” explains Hoekzema. “More and more sensors are going to be sampling areas of the globe and levels of the atmosphere that have never been measured,” he concludes. “As a broader variety of data is made available, AI-based models will be used to drive a broader array of decisions within weather-influenced industries.”


A New Way of Learning
EXPOSURE delves into the algorithmic depths of machine learning to better understand the data potential that it offers the insurance industry. Machine learning is similar to how you teach a child to differentiate between similar animals,” explains Peter Hahn, head of predictive analytics at Zurich North America. “Instead of telling them the specific differences, we show them numerous different pictures of the animals, which are clearly tagged, again and again. Over time, they intuitively form a pattern recognition that allows them to tell a tiger from, say, a leopard. You can’t predefine a set of rules to categorize every animal, but through pattern recognition you learn what the differences are.” In fact, pattern recognition is already part of how underwriters assess a risk, he continues. “Let’s say an underwriter is evaluating a company’s commercial auto exposures. Their decision-making process will obviously involve traditional, codified analytical processes, but it will also include sophisticated pattern recognition based on their experiences of similar companies operating in similar fields with similar constraints. They essentially know what this type of risk ‘looks like’ intuitively.” Tapping the Stream At its core, machine learning is then a mechanism to help us make better sense of data, and to learn from that data on an ongoing basis. Given the data-intrinsic nature of the industry, the potential it affords to support insurance endeavors is considerable. “If you look at models, data is the fuel that powers them all,” says Christos Mitas, vice president of model development at RMS. “We are now operating in a world where that data is expanding exponentially, and machine learning is one tool that will help us to harness that.” One area in which Mitas and his team have been looking at machine learning is in the field of cyber risk modeling. “Where it can play an important role here is in helping us tackle the complexity of this risk. Being able to collect and digest more effectively the immense volumes of data which have been harvested from numerous online sources and datasets will yield a significant advantage.” “MACHINE LEARNING CAN HELP US GREATLY EXPAND THE NUMBER OF EXPLANATORY VARIABLES WE MIGHT INCLUDE TO ADDRESS A PARTICULAR QUESTION” CHRISTOS MITAS RMS He also sees it having a positive impact from an image processing perspective. “With developments in machine learning, for example, we might be able to introduce new data sources into our processing capabilities and make it a faster and more automated data management process to access images in the aftermath of a disaster. Further, we might be able to apply machine learning algorithms to analyze building damage post event to support speedier loss assessment processes.” “Advances in natural language processing could also help tremendously in claims processing and exposure management,” he adds, “where you have to consume reams of reports, images and facts rather than structured data. That is where algorithms can really deliver a different scale of potential solutions.” At the underwriting coalface, Hahn believes a clear area where machine learning can be leveraged is in the assessment and quantification of risks. “In this process, we are looking at thousands of data elements to see which of these will give us a read on the risk quality of the potential insured. Analyzing that data based on manual processes, given the breadth and volume, is extremely difficult.” Looking Behind the Numbers Mitas is, however, highly conscious of the need to establish how machine learning fits into the existing insurance eco-system before trying to move too far ahead. “The technology is part of our evolution and offers us a new tool to support our endeavors. However, where our process as risk modelers starts is with a fundamental understanding of the scientific principles which underpin what we do.” Making the Investment Source: The Future of General Insurance Report based on research conducted by Marketforce Business Media and the UK’s Chartered Insurance Institute in August and September 2016 involving 843 senior figures from across the UK insurance sector “It is true that machine learning can help us greatly expand the number of explanatory variables we might include to address a particular question, for example – but that does not necessarily mean that the answer will more easily emerge. What is more important is to fully grasp the dynamics of the process that led to the generation of the data in the first place.” He continues: “If you look at how a model is constructed, for example, you will have multiple different model components all coupled together in a highly nonlinear, complex system. Unless you understand these underlying structures and how they interconnect, it can be extremely difficult to derive real insight from just observing the resulting data.” “WE NEED TO ENSURE THAT WE CAN EXPLAIN THE RATIONALE BEHIND THE CONCLUSIONS” PETER HAHN ZURICH NORTH AMERICA Hahn also highlights the potential ‘black box’ issue that can surround the use of machine learning. “End users of analytics want to know what drove the output,” he explains, “and when dealing with algorithms that is not always easy. If, for example, we apply specific machine learning techniques to a particular risk and conclude that it is a poor risk, any experienced underwriter is immediately going to ask how you came to that conclusion. You can’t simply say you are confident in your algorithms.” “We need to ensure that we can explain the rationale behind the conclusions that we reach,” he continues. “That can be an ongoing challenge with some machine learning techniques.” There is no doubt that machine learning has a part to play in the ongoing evolution of the insurance industry. But as with any evolving technology, how it will be used, where and how extensively will be influenced by a multitude of factors. “Machine learning has a very broad scope of potential,” concludes Hahn, “but of course we will only see this develop over time as people become more comfortable with the techniques and become better at applying the technology to different parts of their business.”


Managing the Next Financial Shock
EXPOSURE reports on how a pilot project to stress test banks’ exposure to drought could hold the key to future economic resilience. here is a growing recognition that environmental stress testing is a crucial instrument to ensure a sustainable financial system. In December 2016, the Task Force on Climate-related Financial Disclosures (TCFD) released its recommendations for effective disclosure of climate-related financial risks. “This represents an important effort by the private sector to improve transparency around climate-related financial risks and opportunities,” said Michael Bloomberg, chair of the TCFD. “Climate change is not only an environmental problem, but a business one as well. We need business leaders to join us to help spread these recommendations across their industries in order to help make markets more efficient and economies more stable, resilient and sustainable.” Why Drought? Drought is a significant potential source of shock to the global financial system. There is a common misconception that sustained lack of water is primarily a problem for agriculture and food production. In Europe alone, it is estimated that around 40 percent of total water extraction is used for industry and energy production (cooling in power plants) and 15 percent for public water supply. The main water consumption sectors are irrigation, utilities and manufacturing. The macro-economic impact of a prolonged or systemic drought could therefore be severe, and is currently the focus of a joint project between RMS and a number of leading financial institutions and development agencies to stress test lending portfolios to see how they would respond to environmental risk. “ONLY BY BRINGING TOGETHER MINISTERIAL LEVEL GOVERNMENT OFFICIALS WITH LEADERS IN COMMERCE CAN WE ADDRESS THE WORLD’S BIGGEST ISSUES” DANIEL STANDER RMS “Practically every industry in the world has some reliance on water availability in some shape or form,” states Stephen Moss, director, capital markets at RMS. “And, as we’ve seen, as environmental impacts become more frequent and severe, so there is a growing awareness that water — as a key future resource — is starting to become more acute.” “So the questions are: do we understand how a lack of water could impact specific industries and how that could then flow down the line to all the industrial activities that rely on the availability of water? And then how does that impact on the broader economy?” he continues. “We live in a very interconnected world and as a result, the impact of drought on one industry sector or one geographic region can have a material impact on adjacent industries or regions, regardless of whether they themselves are impacted by that phenomenon or not.” This interconnectivity is at the heart of why a hazard such as drought could become a major systemic threat for the global financial system, explains RMS scientist, Dr. Navin Peiris. “You could have an event or drought occurring in the U.S. and any reduction in production of goods and services could impact global supply chains and draw in other regions due to the fact the world is so interconnected.” The ability to model how drought is likely to impact banks’ loan default rates will enable financial institutions to accurately measure and control the risk. By adjusting their own risk management practices there should be a positive knock-on effect that ripples down if banks are motivated to encourage better water conservation behaviors amongst their corporate borrowers, explains Moss. “The expectation would be that in the same way that an insurance company incorporates the risk of having to payout on a large natural event, a bank should also be incorporating that into their overall risk assessment of a corporate when providing a loan – and including that incremental element in the pricing,” he says. “And just as insureds are motivated to defend themselves against flood or to put sprinklers in the factories in return for a lower premium, if you could provide financial incentives to borrowers through lower loan costs, businesses would then be encouraged to improve their resilience to water shortage.” A Critical Stress Test In May 2016, the Natural Capital Finance Alliance, which is made up of the Global Canopy Programme (GCP) and the United Nations Environment Programme Finance Initiative, teamed up with Deutsche Gesellschaft für Internationale Zusammenarbeit (GIZ) GmbH Emerging Markets Dialogue on Finance (EMDF) and several leading financial institutions to launch a project to pilot scenario modeling. “THERE IS A GROWING AWARENESS THAT WATER — AS A KEY FUTURE RESOURCE — IS STARTING TO BECOME MORE ACUTE” STEPHEN MOSS RMS Funded by the German Federal Ministry for Economic Cooperation and Development (BMZ), RMS was appointed to develop a first-of-its-kind drought model. The aim is to help financial institutions and wider economies become more resilient to extreme droughts, as Yannick Motz, head of the emerging markets dialogue on finance, GIZ, explains. “GIZ has been working with financial institutions and regulators from G20 economies to integrate environmental indicators into lending and investment decisions, product development and risk management. Particularly in the past few years, we have experienced a growing awareness in the financial sector for climate-related risks.” The Dustbowl – The first distinct drought (1930 – 1931) in the ‘dust bowl’ years affected much of the north east and western U.S. “The lack of practicable methodologies and tools that adequately quantify, price and assess such risks, however, still impedes financial institutions in fully addressing and integrating them into their decision-making processes,” he continues. “Striving to contribute to filling this gap, GIZ and NCFA initiated this pilot project with the objective to develop an open-source tool that allows banks to assess the potential impact of drought events on the performance of their corporate loan portfolio.” It is a groundbreaking project between key stakeholders across public and private sectors, according to RMS managing director Daniel Stander. “There are certain things in this world that you can only get done at a Davos level. You need to bring ministerial-level government officials and members of commerce together. It’s only that kind of combination that is going to address the world’s biggest issues. At RMS, experience has taught us that models don’t just solve problems. With the right level of support, they can make markets and change behaviors as well. This initiative is a good example of that.” RMS adapted well-established frameworks from the insurance sector to build – in a consortium complemented by the Universities of Cambridge and Oxford – a tool for banks to stress test the impact of drought. The model was built in close collaboration with several financial institutions, including the Industrial and Commercial Bank of China (ICBC), Caixa Econômica Federal, Itaú and Santander in Brazil, Banorte, Banamex and Trust Funds for Rural Development (FIRA) in Mexico, UBS in Switzerland and Citigroup in the US. “Some of the largest losses we saw in some of our scenarios were not necessarily as a result of an industry sector not having access to water, but because other industry sectors didn’t have access to water, so demand dropped significantly and those companies were therefore not able to sell their wares. This was particularly true for petrochemical businesses that are heavily reliant on the health of the broader economy,” explains Moss. “So, this model is a broad framework that incorporates domestic interconnectivity and trade, as well as global macroeconomic effects.” There is significant scope to apply this approach to modeling other major threats and potential sources of global economic shock, including natural, manmade and emerging perils. “The know-how we’ve applied on this project can be used to evaluate the potential impacts of other stresses,” explains Peiris. “Drought is just one environmental risk facing the financial services industry. This approach can be replicated to measure the potential impact of other systemic risks on macro and micro economic scales.”


The Analytics-Driven Organization
Over the past 15 years, revolutionary technological advances and an explosion of new digital data sources have expanded and reinvented the core disciplines of insurers. Today’s advanced analytics for insurance push far beyond the boundaries of traditional actuarial science. The opportunity for the industry to gain transformational agility in analytics is within reach. EXPOSURE examines what can be learnt from other sectors to create more analytics-driven organizations and avoid ‘DRIP’. Many (re)insurers seeking a competitive edge look to big data and analytics (BD&A) to help address a myriad of challenges such as the soft market, increasing regulatory pressures, and ongoing premium pressures. And yet amidst the buzz of BD&A, we see a lack of big data strategy specifically for evolving pricing, underwriting and risk selection, areas which provide huge potential gains for firms. IMAGINE THIS LEVEL OF ANALYTICAL CAPABILITY PROVIDED IN REAL-TIME AT THE POINT OF UNDERWRITING; A UTOPIA MANY IN THE INDUSTRY ARE SEEKING While there are many revolutionary technological advances to capture and store big data, organizations are suffering from ‘DRIP’– they are data rich but information poor. This is due to the focus being on data capture, management, and structures, at the expense of creating usable insights that can be fed to the people at the point of impact – delivering the right information to the right person at the right time Other highly regulated industries have found ways to start addressing this, providing us with sound lessons on how to introduce more agility into our own industry using repeatable, scalable analytics. Learning From Other Industries When you look across organizations or industries that have got the BD&A recipe correct, three clear criteria are evident, giving good guidance for insurance executives building their own analytics-driven organizations: Delivering Analytics to the Point of Impact In the healthcare industry, the concept of the back-office analyst is not that common. The analyst is a frontline worker – the doctor, the nurse practitioner, the social worker, so solutions for healthcare are designed accordingly. Let’s look within our own industry at the complex role of the portfolio manager. This person is responsible for large, diverse sets of portfolios of risk that span multiple regions, perils and lines of business. And the role relies heavily on having visibility across their entire book of business. A WILLIS TOWERS WATSON SURVEY REVEALS THAT LESS THAN 45 PER CENT OF U.S. PROPERTY AND CASUALTY INSURANCE EXECUTIVES ARE USING BIG DATA FOR EVOLVING PRICING, UNDERWRITING AND RISK SELECTION. THIS NUMBER IS EXPECTED TO JUMP TO 80 PERCENT IN TWO YEARS’ TIME Success comes from insights that give them a clear line of sight into the threats and opportunities of their portfolios – without having to rely on a team of technical analysts to get the information. They not only need the metrics and analytics at their disposal to make informed decisions, they also need to be able to interrogate and dive into the data, understand its underlying composition, and run scenarios so they can choose what is the right investment choice. If for every analysis, they needed a back-office analyst or IT supporter to get a data dump and then spend time configuring it for use, their business agility would be compromised. To truly become an analytics-driven organization, firms need to ensure the analytics solutions they implement provide the actual decision-maker with all the necessary insights to make informed decisions in a timely manner. Ensuring Usability Usability is not just about the user interface. Big data can be paralyzing. Having access to actionable insights in a format that provides context and underlying assumptions is important. Often, not only does the frontline worker need to manage multiple analytics solutions to get at insights, but even the user persona for these systems is not well defined. At this stage, the analytics must be highly workflow-driven with due consideration given to the veracity of the data to reduce uncertainty. Consider the analytics tools used by doctors when diagnosing a patient’s condition. They input standard information – age, sex, weight, height, ethnicity, address – and the patient’s symptoms, and are provided not with a defined prognosis but a set of potential diagnoses accompanied by a probability score and the sources. Imagine this level of analytical capability provided in real-time at the point of underwriting; a Utopia many in the industry are seeking that has only truly been achieved by a few of the leading insurers. In this scenario, underwriters would receive a submission and understand exactly the composition of business they were taking on. They could quickly understand the hazards that could affect their exposures, the impact of taking on the business on their capacity – regardless of whether it was a probabilistically–modeled property portfolio, or a marine book that was monitored in a deterministic way. They could also view multiple submissions and compare them, not only based on how much premium could be bought in by each, but also on how taking on a piece of business could diversify the group-level portfolio. The underwriter not only has access to the right set of analytics, they also have a clear understanding of other options and underlying assumptions. Integration Into the Common Workflow To achieve data nirvana, BD&A output needs to integrate naturally into daily business-as-usual operations. When analytics are embedded directly into the daily workflow, there is a far higher success rate of it being put to effective use. A good illustration is customer service technology. Historically, customer service agents had to access multiple systems to get information about a caller. Now all their systems are directly integrated into the customer service software – whether it is a customer rating and guidance on how best to handle the customer, or a ranking of latest offers they might have a strong affinity for. SKILLED UNDERWRITERS WANT ACCESS TO ANALYTICS THAT ALLOW THEM TO DERIVE INSIGHTS TO BE PART OF THE DAILY WORKFLOW FOR EVERY RISK THEY WRITE It is the same principle in insurance. It is important to ensure that whatever system your underwriter, portfolio manager, or risk analyst is using, is built and designed with an open architecture. This means it is designed to easily accept inputs from your legacy systems or your specific intellectual property-intensive processes. Underwriting is an art. And while there are many risks and lines of business that can be automated, in specialty insurance there is a still a need for human-led decision-making. Specialty underwriters combine the deep knowledge of the risks they write, historical loss data, and their own underwriting experience. Having good access to analytics is key to them, and they need it at their fingertips – with little reliance on technical analysts. Skilled underwriters want access to analytics that allow them to derive insights to be part of the daily workflow for every risk they write. Waiting for quarterly board reports to be produced, which tell them how much capacity they have left, or having to wait for another group to run the reports they need, means it is not a business-as-usual process. How will insurers use big data? Survey of property and casualty insurance executives (Source: Willis Towers Watson)
