Author: NIGEL ALLEN
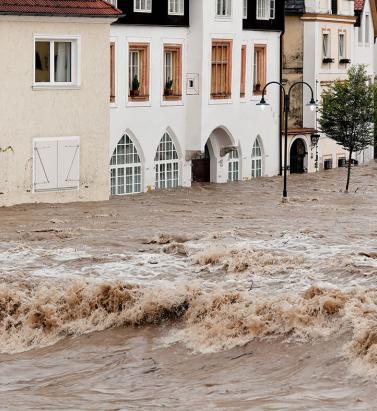
Clear Link Between Flood Losses and NAO
May 20, 2019RMS research proves relationship between NAO and catastrophic flood events in Europe The correlation between the North Atlantic Oscillation (NAO) and European precipitation patterns is well known. However, a definitive link between phases of the NAO and catastrophic flood events and related losses had not previously been established — until now. A study by RMS published in Geophysical Research Letters has revealed a direct correlation between the NAO and the occurrence of catastrophic floods across Europe and associated economic losses. The analysis not only extrapolated a statistically significant relationship between the events, but critically showed that average flood losses during opposite NAO states can differ by up to 50 percent. A Change in Pressure The NAO’s impact on meteorological patterns is most pronounced in winter. Fluctuations in the atmospheric pressure between two semi-permanent centers of low and high pressure in the North Atlantic influence wind direction and strength as well as storm tracks. The two-pronged study combined extensive analysis of flood occurrence and peak water levels across Europe, coupled with extensive modeling of European flood events using the RMS Europe Inland Flood High-Definition (HD) Model. The data sets included HANZE-Events, a catalog of over 1,500 catastrophic European flood events between 1870 and 2016, and a recent database of the highest-recorded water levels based on data from over 4,200 weather stations. “The HD model generated a large set of potential catastrophic flood events and quantified the associated losses” “This analysis established a clear relationship between the occurrence of catastrophic flood events and the NAO phase,” explains Stefano Zanardo, principal modeler at RMS, “and confirmed that a positive NAO increased catastrophic flooding in Northern Europe, with a negative phase influencing flooding in Southern Europe. However, to ascertain the impact on actual flood losses we turned to the model.” Modeling the Loss The HD model generated a large set of potential catastrophic flood events and quantified the associated losses. It not only factored in precipitation, but also rainfall runoff, river routing and inundation processes. Critically, the precipitation incorporated the impact of a simulated monthly NAO index as a driver for monthly rainfall. “It showed that seasonal flood losses can increase or decrease by up to 50 percent between positive and negative NAOs, which is very significant,” states Zanardo. “What it also revealed were distinct regional patterns. For example, a positive state resulted in increased flood activity in the U.K. and Germany. These loss patterns provide a spatial correlation of flood risk not previously detected.” Currently, NAO seasonal forecasting is limited to a few months. However, as this window expands, the potential for carriers to factor oscillation phases into flood-related renewal and capital allocation strategies will grow. Further, greater insight into spatial correlation could support more effective portfolio management. “At this stage,” he concludes, “we have confirmed the link between the NAO and flood-related losses. How this evolves to influence carriers’ flood strategies is still to be seen, and a key factor will be advances in the NAO forecasting. What is clear is that oscillations such as the NAO must be included in model assumptions to truly understand flood risk.”


Vulnerability: In Equal Measure
May 20, 2019As international efforts grow to minimize the disproportionate impact of disasters on specific parts of society, EXPOSURE looks at how close public/private collaboration will be critical to moving forward There is a widely held and understandable belief that large-scale disasters are indiscriminate events. They weigh out devastation in equal measure, irrespective of the gender, age, social standing or physical ability of those impacted. The reality, however, is very different. Catastrophic events expose the various inequalities within society in horrific fashion. Women, children, the elderly, people with disabilities and those living in economically deprived areas are at much greater risk than other parts of society both during the initial disaster phase and the recovery process. Cyclone Gorky, for example, which struck Bangladesh in 1991, caused in the region of 140,000 deaths — women made up 93 percent of that colossal death toll. Similarly, in the 2004 Indian Ocean Tsunami some 70 percent of the 250,000 fatalities were women. Looking at the disparity from an age-banded perspective, during the 2005 Kashmir Earthquake 10,000 schools collapsed resulting in the deaths of 19,000 children. Children also remain particularly vulnerable well after disasters have subsided. In 2014, a study by the University of San Francisco of death rates in the Philippines found that delayed deaths among female infants outnumbered reported typhoon deaths by 15-to-1 following an average typhoon season — a statistic widely attributed to parents prioritizing their male infants at a time of extreme financial difficulty. And this disaster disparity is not limited to developing nations as some may assume. Societal groups in developed nations can be just as exposed to a disproportionate level of risk. During the recent Camp Fire in California, figures revealed that residents in the town of Paradise aged 75 or over were 8 times more likely to die than the average for all other age bands. This age-related disparity was only marginally smaller for Hurricane Katrina in 2005. The Scale of the Problem These alarming statistics are now resonating at the highest levels. Growing recognition of the inequalities in disaster-related fatality ratios is now influencing global thinking on disaster response and management strategies. Most importantly, it is a central tenet of the Sendai Framework for Disaster Risk Reduction 2015–2030, which demands an “all-of-society engagement and partnership” to reduce risk that encompasses those “disproportionately affected by disasters.” Yet a fundamental problem is that disaggregated data for specific vulnerable groups is not being captured for the majority of disasters. “There is a growing acknowledgment across many nations that certain groupings within society are disproportionately impacted by disasters,” explains Alison Dobbin, principal catastrophe risk modeler at RMS. “Yet the data required to get a true sense of the scale of the problem simply isn’t being utilized and disaggregated in an effective manner post-disaster. And without exploiting and building on the data that is available, we cannot gain a working understanding of how best to tackle the multiple issues that contribute to it.” The criticality of capturing disaster datasets specific to particular groups and age bands is clearly flagged in the Sendai Framework. Under the “Guiding Principles,” the document states: “Disaster risk reduction requires a multi-hazard approach and inclusive risk-informed decision-making based on the open exchange and dissemination of disaggregated data, including by sex, age and disability, as well as on easily accessible, up-to-date, comprehensible, science-based, non-sensitive risk information, complemented by traditional knowledge.” Gathering the Data Effective data capture, however, requires a consistent approach to the collection of disaggregated information across all groups — first, to understand the specific impacts of particular perils on distinct groups, and second, to generate guidance, policies and standards for preparedness and resilience that reflect the unique sensitivities. While efforts to collect and analyze aggregated data are increasing, the complexities involved in ascertaining differentiated vulnerabilities to specific groups are becoming increasingly apparent, as Nicola Howe, lead catastrophe risk modeler at RMS, explains. “We can go beyond statistics collection, and model those factors which lead to discriminative outcomes” Nicola Howe RMS “You have to remember that social vulnerability varies from place to place and is often in a state of flux,” she says. “People move, levels of equality change, lifestyles evolve and the economic conditions in specific regions fluctuate. Take gender-based vulnerabilities for example. They tend not to be as evident in societies that demonstrate stronger levels of sexual equality. “Experiences during disasters are also highly localized and specific to the particular event or peril,” she continues. “There are multiple variables that can influence the impact on specific groups. Cultural, political and economic factors are strong influencers, but other aspects such as the time of day or the particular season can also have a significant effect on outcomes.” This creates challenges, not only for attributing specific vulnerabilities to particular groups and establishing policies designed to reduce those vulnerabilities, but also for assessing the extent to which the measures are having the desired outcomes. Establishing data consistency and overcoming the complexities posed by this universal problem will require the close collaboration of all key participants. “It is imperative that governments and NGOs recognize the important part that the private sector can play in working together and converting relevant data into the targeted insight required to support effective decision-making in this area,” says Dobbin. A Collective Response At time of writing, Dobbin and Howe were preparing to join a diverse panel of speakers at the UN’s 2019 Global Platform for Disaster Risk Reduction in Switzerland. This year’s convening marks the third consecutive conference at which RMS has participated. Previous events have seen Robert Muir-Wood, chief research officer, and Daniel Stander, global managing director, present on the resilience dividend andrisk finance. The title of this year’s discussion is “Using Gender, Age and Disability-Responsive Data to Empower Those Left Furthest Behind.” “One of our primary aims at the event,” says Howe, “will be to demonstrate the central role that the private sector, and in our case the risk modeling community, can play in helping to bridge the data gap that exists and help promote the meaningful way in which we can contribute.” The data does, in some cases, exist and is maintained primarily by governments and NGOs in the form of census data, death certificates, survey results and general studies. “Companies such as RMS provide the capabilities to convert this raw data into actionable insight,” Dobbin says. “We model from hazard, through vulnerability and exposure, all the way to the financial loss. That means we can take the data and turn it into outputs that governments and NGOs can use to better integrate disadvantaged groups into resilience planning.” But it’s not simply about getting access to the data. It is also about working closely with these bodies to establish the questions that they need answers to. “We need to understand the specific outputs required. To this end, we are regularly having conversations with many diverse stakeholders,” adds Dobbin. While to date the analytical capabilities of the risk modeling community have not been directed at the social vulnerability issue in any significant way, RMS has worked with organizations to model human exposure levels for perils. Collaborating with the Workers’ Compensation Insurance Rating Bureau of California (WCIRB), a private, nonprofit association, RMS conducted probabilistic earthquake analysis on exposure data for more than 11 million employees. This included information about the occupation of each employee to establish potential exposure levels for workers’ compensation cover in the state. “We were able to combine human exposure data to model the impact of an earthquake, ascertaining vulnerability based on where employees were likely to be, their locations, their specific jobs, the buildings they worked in and the time of day that the event occurred,” says Howe. “We have already established that we can incorporate age and gender data into the model, so we know that our technology is capable of supporting detailed analyses of this nature on a huge scale.” She continues: “We must show where the modeling community can make a tangible difference. We bring the ability to go beyond the collection of statistics post-disaster and to model those factors that lead to such strong differences in outcomes, so that we can identify where discrimination and selective outcomes are anticipated before they actually happen in disasters. This could be through identifying where people are situated in buildings at different times of day, by gender, age, disability, etc. It could be by modeling how different people by age, gender or disability will respond to a warning of a tsunami or a storm surge. It could be by modeling evacuation protocols to demonstrate how inclusive they are.” Strengthening the Synergies A critical aspect of reducing the vulnerability of specific groups is to ensure disadvantaged elements of society become more prominent components of mitigation and response planning efforts. A more people-centered approach to disaster management was a key aspect of the forerunner to the Sendai Framework, the Hyogo Framework for Action 2005–2015. The plan called for risk reduction practices to be more inclusive and engage a broader scope of stakeholders, including those viewed as being at higher risk. This approach is a core part of the “Guiding Principles” that underpin the Sendai Framework. It states: “Disaster risk reduction requires an all-of-society engagement and partnership. It also requires empowerment and inclusive, accessible and non-discriminatory participation, paying special attention to people disproportionately affected by disasters, especially the poorest. A gender, age, disability and cultural perspective should be integrated in all policies and practices, and women and youth leadership should be promoted.” The Framework also calls for the empowerment of women and people with disabilities, stating that enabling them “to publicly lead and promote gender equitable and universally accessible response, recovery, rehabilitation and reconstruction approaches.” This is a main area of focus for the U.N. event, explains Howe. “The conference will explore how we can promote greater involvement among members of these disadvantaged groups in resilience-related discussions, because at present we are simply not capitalizing on the insight that they can provide. “Take gender for instance. We need to get the views of those disproportionately impacted by disaster involved at every stage of the discussion process so that we can ensure that we are generating gender-sensitive risk reduction strategies, that we are factoring universal design components into how we build our shelters, so women feel welcome and supported. Only then can we say we are truly recognizing the principles of the Sendai Framework.”
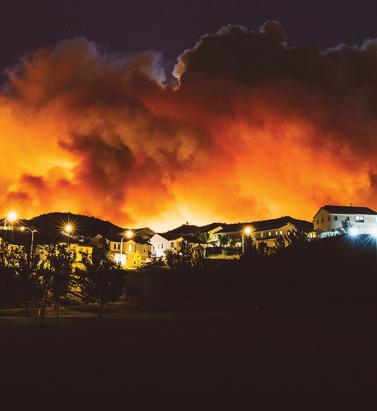
The Flames Burn Higher
May 20, 2019With California experiencing two of the most devastating seasons on record in consecutive years, EXPOSURE asks whether wildfire now needs to be considered a peak peril Some of the statistics for the 2018 U.S. wildfire season appear normal. The season was a below-average year for the number of fires reported — 58,083 incidents represented only 84 percent of the 10-year average. The number of acres burned — 8,767,492 acres — was marginally above average at 132 percent. Two factors, however, made it exceptional. First, for the second consecutive year, the Great Basin experienced intense wildfire activity, with some 2.1 million acres burned — 233 percent of the 10-year average. And second, the fires destroyed 25,790 structures, with California accounting for over 23,600 of the structures destroyed, compared to a 10-year U.S. annual average of 2,701 residences, according to the National Interagency Fire Center. As of January 28, 2019, reported insured losses for the November 2018 California wildfires, which included the Camp and Woolsey Fires, were at US$11.4 billion, according to the California Department of Insurance. Add to this the insured losses of US$11.79 billion reported in January 2018 for the October and December 2017 California events, and these two consecutive wildfire seasons constitute the most devastating on record for the wildfire-exposed state. Reaching its Peak? Such colossal losses in consecutive years have sent shockwaves through the (re)insurance industry and are forcing a reassessment of wildfire’s secondary status in the peril hierarchy. According to Mark Bove, natural catastrophe solutions manager at Munich Reinsurance America, wildfire’s status needs to be elevated in highly exposed areas. “Wildfire should certainly be considered a peak peril in areas such as California and the Intermountain West,” he states, “but not for the nation as a whole.” His views are echoed by Chris Folkman, senior director of product management at RMS. “Wildfire can no longer be viewed purely as a secondary peril in these exposed territories,” he says. “Six of the top 10 fires for structural destruction have occurred in the last 10 years in the U.S., while seven of the top 10, and 10 of the top 20 most destructive wildfires in California history have occurred since 2015. The industry now needs to achieve a level of maturity with regard to wildfire that is on a par with that of hurricane or flood.” “Average ember contributions to structure damage and destruction is approximately 15 percent, but in a wind-driven event such as the Tubbs Fire this figure is much higher” Chris Folkman RMS However, he is wary about potential knee-jerk reactions to this hike in wildfire-related losses. “There is a strong parallel between the 2017-18 wildfire seasons and the 2004-05 hurricane seasons in terms of people’s gut instincts. 2004 saw four hurricanes make landfall in Florida, with K-R-W causing massive devastation in 2005. At the time, some pockets of the industry wondered out loud if parts of Florida were uninsurable. Yet the next decade was relatively benign in terms of hurricane activity. “The key is to adopt a balanced, long-term view,” thinks Folkman. “At RMS, we think that fire severity is here to stay, while the frequency of big events may remain volatile from year-to-year.” A Fundamental Re-evaluation The California losses are forcing (re)insurers to overhaul their approach to wildfire, both at the individual risk and portfolio management levels. “The 2017 and 2018 California wildfires have forced one of the biggest re-evaluations of a natural peril since Hurricane Andrew in 1992,” believes Bove. “For both California wildfire and Hurricane Andrew, the industry didn’t fully comprehend the potential loss severities. Catastrophe models were relatively new and had not gained market-wide adoption, and many organizations were not systematically monitoring and limiting large accumulation exposure in high-risk areas. As a result, the shocks to the industry were similar.” For decades, approaches to underwriting have focused on the wildland-urban interface (WUI), which represents the area where exposure and vegetation meet. However, exposure levels in these areas are increasing sharply. Combined with excessive amounts of burnable vegetation, extended wildfire seasons, and climate-change-driven increases in temperature and extreme weather conditions, these factors are combining to cause a significant hike in exposure potential for the (re)insurance industry. A recent report published in PNAS entitled “Rapid Growth of the U.S. Wildland-Urban Interface Raises Wildfire Risk” showed that between 1990 and 2010 the new WUI area increased by 72,973 square miles (189,000 square kilometers) — larger than Washington State. The report stated: “Even though the WUI occupies less than one-tenth of the land area of the conterminous United States, 43 percent of all new houses were built there, and 61 percent of all new WUI houses were built in areas that were already in the WUI in 1990 (and remain in the WUI in 2010).” “The WUI has formed a central component of how wildfire risk has been underwritten,” explains Folkman, “but you cannot simply adopt a black-and-white approach to risk selection based on properties within or outside of the zone. As recent losses, and in particular the 2017 Northern California wildfires, have shown, regions outside of the WUI zone considered low risk can still experience devastating losses.” For Bove, while focus on the WUI is appropriate, particularly given the Coffey Park disaster during the 2017 Tubbs Fire, there is not enough focus on the intermix areas. This is the area where properties are interspersed with vegetation. “In some ways, the wildfire risk to intermix communities is worse than that at the interface,” he explains. “In an intermix fire, you have both a wildfire and an urban conflagration impacting the town at the same time, while in interface locations the fire has largely transitioned to an urban fire. “In an intermix community,” he continues, “the terrain is often more challenging and limits firefighter access to the fire as well as evacuation routes for local residents. Also, many intermix locations are far from large urban centers, limiting the amount of firefighting resources immediately available to start combatting the blaze, and this increases the potential for a fire in high-wind conditions to become a significant threat. Most likely we’ll see more scrutiny and investigation of risk in intermix towns across the nation after the Camp Fire’s decimation of Paradise, California.” Rethinking Wildfire Analysis According to Folkman, the need for greater market maturity around wildfire will require a rethink of how the industry currently analyzes the exposure and the tools it uses. “Historically, the industry has relied primarily upon deterministic tools to quantify U.S. wildfire risk,” he says, “which relate overall frequency and severity of events to the presence of fuel and climate conditions, such as high winds, low moisture and high temperatures.” While such tools can prove valuable for addressing “typical” wildland fire events, such as the 2017 Thomas Fire in Southern California, their flaws have been exposed by other recent losses. Burning Wildfire at Sunset “Such tools insufficiently address major catastrophic events that occur beyond the WUI into areas of dense exposure,” explains Folkman, “such as the Tubbs Fire in Northern California in 2017. Further, the unprecedented severity of recent wildfire events has exposed the weaknesses in maintaining a historically based deterministic approach.” While the scale of the 2017-18 losses has focused (re)insurer attention on California, companies must also recognize the scope for potential catastrophic wildfire risk extends beyond the boundaries of the western U.S. “While the frequency and severity of large, damaging fires is lower outside California,” says Bove, “there are many areas where the risk is far from negligible.” While acknowledging that the broader western U.S. is seeing increased risk due to WUI expansion, he adds: “Many may be surprised that similar wildfire risk exists across most of the southeastern U.S., as well as sections of the northeastern U.S., like in the Pine Barrens of southern New Jersey.” As well as addressing the geographical gaps in wildfire analysis, Folkman believes the industry must also recognize the data gaps limiting their understanding. “There are a number of areas that are understated in underwriting practices currently, such as the far-ranging impacts of ember accumulations and their potential to ignite urban conflagrations, as well as vulnerability of particular structures and mitigation measures such as defensible space and fire-resistant roof coverings.” In generating its US$9 billion to US$13 billion loss estimate for the Camp and Woolsey Fires, RMS used its recently launched North America Wildfire High-Definition (HD) Models to simulate the ignition, fire spread, ember accumulations and smoke dispersion of the fires. “In assessing the contribution of embers, for example,” Folkman states, “we modeled the accumulation of embers, their wind-driven travel and their contribution to burn hazard both within and beyond the fire perimeter. Average ember contributions to structure damage and destruction is approximately 15 percent, but in a wind-driven event such as the Tubbs Fire this figure is much higher. This was a key factor in the urban conflagration in Coffey Park.” The model also provides full contiguous U.S. coverage, and includes other model innovations such as ignition and footprint simulations for 50,000 years, flexible occurrence definitions, smoke and evacuation loss across and beyond the fire perimeter, and vulnerability and mitigation measures on which RMS collaborated with the Insurance Institute for Business & Home Safety. Smoke damage, which leads to loss from evacuation orders and contents replacement, is often overlooked in risk assessments, despite composing a tangible portion of the loss, says Folkman. “These are very high-frequency, medium-sized losses and must be considered. The Woolsey Fire saw 260,000 people evacuated, incurring hotel, meal and transport-related expenses. Add to this smoke damage, which often results in high-value contents replacement, and you have a potential sea of medium-sized claims that can contribute significantly to the overall loss.” A further data resolution challenge relates to property characteristics. While primary property attribute data is typically well captured, believes Bove, many secondary characteristics key to wildfire are either not captured or not consistently captured. “This leaves the industry overly reliant on both average model weightings and risk scoring tools. For example, information about defensible spaces, roofing and siding materials, protecting vents and soffits from ember attacks, these are just a few of the additional fields that the industry will need to start capturing to better assess wildfire risk to a property.” A Highly Complex Peril Bove is, however, conscious of the simple fact that “wildfire behavior is extremely complex and non-linear.” He continues: “While visiting Paradise, I saw properties that did everything correct with regard to wildfire mitigation but still burned and risks that did everything wrong and survived. However, mitigation efforts can improve the probability that a structure survives.” “With more data on historical fires,” Folkman concludes, “more research into mitigation measures and increasing awareness of the risk, wildfire exposure can be addressed and managed. But it requires a team mentality, with all parties — (re)insurers, homeowners, communities, policymakers and land-use planners — all playing their part.”
In Total Harmony
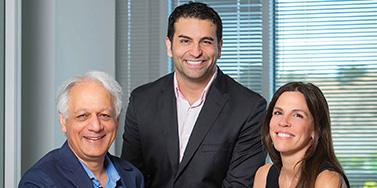
September 05, 2018Karen White joined RMS as CEO in March 2018, followed closely by Moe Khosravy, general manager of software and platform activities. EXPOSURE talks to both, along with Mohsen Rahnama, chief risk modeling officer and one of the firm’s most long-standing team members, about their collective vision for the company, innovation, transformation and technology in risk management Karen and Moe, what was it that sparked your interest in joining RMS? Karen: What initially got me excited was the strength of the hand we have to play here and the fact that the insurance sector is at a very interesting time in its evolution. The team is fantastic — one of the most extraordinary groups of talent I have come across. At our core, we have hundreds of Ph.D.s, superb modelers and scientists, surrounded by top engineers, and computer and data scientists. I firmly believe no other modeling firm holds a candle to the quality of leadership and depth and breadth of intellectual property at RMS. We are years ahead of our competitors in terms of the products we deliver. Moe: For me, what can I say? When Karen calls with an idea it’s very hard to say no! However, when she called about the RMS opportunity, I hadn’t ever considered working in the insurance sector. My eureka moment came when I looked at the industry’s challenges and the technology available to tackle them. I realized that this wasn’t simply a cat modeling property insurance play, but was much more expansive. If you generalize the notion of risk and loss, the potential of what we are working on and the value to the insurance sector becomes much greater. I thought about the technologies entering the sector and how new developments on the AI [artificial intelligence] and machine learning front could vastly expand current analytical capabilities. I also began to consider how such technologies could transform the sector’s cost base. In the end, the decision to join RMS was pretty straightforward. “Developments such as AI and machine learning are not fairy dust to sprinkle on the industry’s problems” Karen White CEO, RMS Karen: The industry itself is reaching a eureka moment, which is precisely where I love to be. It is at a transformational tipping point — the technology is available to enable this transformation and the industry is compelled to undertake it. I’ve always sought to enter markets at this critical point. When I joined Oracle in the 1990s, the business world was at a transformational point — moving from client-server computing to Internet computing. This has brought about many of the huge changes we have seen in business infrastructure since, so I had a bird’s-eye view of what was a truly extraordinary market shift coupled with a technology shift. That experience made me realize how an architectural shift coupled with a market shift can create immense forward momentum. If the technology can’t support the vision, or if the challenges or opportunities aren’t compelling enough, then you won’t see that level of change occur. Do (re)insurers recognize the need to change and are they willing to make the digital transition required? Karen: I absolutely think so. There are incredible market pressures to become more efficient, assess risks more effectively, improve loss ratios, achieve better business outcomes and introduce more beneficial ways of capitalizing risk. You also have numerous new opportunities emerging. New perils, new products and new ways of delivering those products that have huge potential to fuel growth. These can be accelerated not just by market dynamics but also by a smart embrace of new technologies and digital transformation. Mohsen: Twenty-five years ago when we began building models at RMS, practitioners simply had no effective means of assessing risk. So, the adoption of model technology was a relatively simple step. Today, the extreme levels of competition are making the ability to differentiate risk at a much more granular level a critical factor, and our model advances are enabling that. In tandem, many of the Silicon Valley technologies have the potential to greatly enhance efficiency, improve processing power, minimize cost, boost speed to market, enable the development of new products, and positively impact every part of the insurance workflow. Data is the primary asset of our industry — it is the source of every risk decision, and every risk is itself an opportunity. The amount of data is increasing exponentially, and we can now capture more information much faster than ever before, and analyze it with much greater accuracy to enable better decisions. It is clear that the potential is there to change our industry in a positive way. The industry is renowned for being risk averse. Is it ready to adopt the new technologies that this transformation requires? Karen: The risk of doing nothing given current market and technology developments is far greater than that of embracing emerging tech to enable new opportunities and improve cost structures, even though there are bound to be some bumps in the road. I understand the change management can be daunting. But many of the technologies RMS is leveraging to help clients improve price performance and model execution are not new. AI, the Cloud and machine learning are already tried and trusted, and the insurance market will benefit from the lessons other industries have learned as it integrates these technologies. “The sector is not yet attracting the kind of talent that is attracted to firms such as Google, Microsoft or Amazon — and it needs to” Moe Khosravy EVP, Software and Platform, RMS Moe: Making the necessary changes will challenge the perceived risk-averse nature of the insurance market as it will require new ground to be broken. However, if we can clearly show how these capabilities can help companies be measurably more productive and achieve demonstrable business gains, then the market will be more receptive to new user experiences. Mohsen: The performance gains that technology is introducing are immense. A few years ago, we were using computation fluid dynamics to model storm surge. We were conducting the analysis through CPU [central processing unit] microprocessors, which was taking weeks. With the advent of GPU [graphics processing unit] microprocessors, we can carry out the same level of analysis in hours. When you add the supercomputing capabilities possible in the Cloud, which has enabled us to deliver HD-resolution models to our clients — in particular for flood, which requires a high-gradient hazard model to differentiate risk effectively — it has enhanced productivity significantly and in tandem price performance. Is an industry used to incremental change able to accept the stepwise change technology can introduce? Karen: Radical change often happens in increments. The change from client-server to Internet computing did not happen overnight, but was an incremental change that came in waves and enabled powerful market shifts. Amazon is a good example of market leadership out of digital transformation. It launched in 1994 as an online bookstore in a mature, relatively sleepy industry. It evolved into broad e-commerce and again with the introduction of Cloud services when it launched AWS [Amazon Web Services] 12 years ago — now a US$17 billion business that has disrupted the computer industry and is a huge portion of its profit. Amazon has total revenue of US$178 billion from nothing over 25 years, having disrupted the retail sector. Retail consumption has changed dramatically, but I can still go shopping on London’s Oxford Street and about 90 percent of retail is still offline. My point is, things do change incrementally but standing still is not a great option when technology-fueled market dynamics are underway. Getting out in front can be enormously rewarding and create new leadership. However, we must recognize that how we introduce technology must be driven by the challenges it is being introduced to address. I am already hearing people talk about developments such as AI, machine learning and neural networks as if they are fairy dust to sprinkle on the industry’s problems. That is not how this transformation process works. How are you approaching the challenges that this transformation poses? Karen: At RMS, we start by understanding the challenges and opportunities from our customers’ perspectives and then look at what value we can bring that we have not brought before. Only then can we look at how we deliver the required solution. Moe: It’s about having an “outward-in” perspective. We have amazing technology expertise across modeling, computer science and data science, but to deploy that effectively we must listen to what the market wants. We know that many companies are operating multiple disparate systems within their networks that have simply been built upon again and again. So, we must look at harnessing technology to change that, because where you have islands of data, applications and analysis, you lose fidelity, time and insight and costs rise. Moe: While there is a commonality of purpose spanning insurers, reinsurers and brokers, every organization is different. At RMS, we must incorporate that into our software and our platforms. There is no one-size-fits-all and we can’t force everyone to go down the same analytical path. That’s why we are adopting a more modular approach in terms of our software. Whether the focus is portfolio management or underwriting decision-making, it’s about choosing those modules that best meet your needs. “Data is the primary asset of our industry — it is the source of every risk decision, and every risk is itself an opportunity” Mohsen Rahmana, PhD Chief Risk Modeling Officer, RMS Mohsen: When constructing models, we focus on how we can bring the right technology to solve the specific problems our clients have. This requires a huge amount of critical thinking to bring the best solution to market. How strong is the talent base that is helping to deliver this level of capability? Mohsen: RMS is extremely fortunate to have such a fantastic array of talent. This caliber of expertise is what helps set us apart from competitors, enabling us to push boundaries and advance our modeling capabilities at the speed we are. Recently, we have set up teams of modelers and data and computer scientists tasked with developing a range of innovations. It’s fantastic having this depth of talent, and when you create an environment in which innovative minds can thrive you quickly reap the rewards — and that is what we are seeing. In fact, I have seen more innovation at RMS in the last six months than over the past several years. Moe: I would add though that the sector is not yet attracting the kind of talent seen at firms such as Google, Microsoft or Amazon, and it needs to. These companies are either large-scale customer-service providers capitalizing on big data platforms and leading-edge machine-learning techniques to achieve the scale, simplicity and flexibility their customers demand, or enterprises actually building these core platforms themselves. When you bring new blood into an organization or industry, you generate new ideas that challenge current thinking and practices, from the user interface to the underlying platform or the cost of performance. We need to do a better PR job as a technology sector. The best and brightest people in most cases just want the greatest problems to tackle — and we have a ton of those in our industry. Karen: The critical component of any successful team is a balance of complementary skills and capabilities focused on having a high impact on an interesting set of challenges. If you get that dynamic right, then that combination of different lenses correctly aligned brings real clarity to what you are trying to achieve and how to achieve it. I firmly believe at RMS we have that balance. If you look at the skills, experience and backgrounds of Moe, Mohsen and myself, for example, they couldn’t be more different. Bringing Moe and Mohsen together, however, has quickly sparked great and different thinking. They work incredibly well together despite their vastly different technical focus and career paths. In fact, we refer to them as the “Moe-Moes” and made them matching inscribed giant chain necklaces and presented them at an all-hands meeting recently. Moe: Some of the ideas we generate during our discussions and with other members of the modeling team are incredibly powerful. What’s possible here at RMS we would never have been able to even consider before we started working together. Mohsen: Moe’s vast experience of building platforms at companies such as HP, Intel and Microsoft is a great addition to our capabilities. Karen brings a history of innovation and building market platforms with the discipline and the focus we need to deliver on the vision we are creating. If you look at the huge amount we have been able to achieve in the months that she has been at RMS, that is a testament to the clear direction we now have. Karen: While we do come from very different backgrounds, we share a very well-defined culture. We care deeply about our clients and their needs. We challenge ourselves every day to innovate to meet those needs, while at the same time maintaining a hell-bent pragmatism to ensure we deliver. Mohsen: To achieve what we have set out to achieve requires harmony. It requires a clear vision, the scientific know-how, the drive to learn more, the ability to innovate and the technology to deliver — all working in harmony. Career Highlights Karen White is an accomplished leader in the technology industry, with a 25-year track record of leading, innovating and scaling global technology businesses. She started her career in Silicon Valley in 1993 as a senior executive at Oracle. Most recently, Karen was president and COO at Addepar, a leading fintech company serving the investment management industry with data and analytics solutions. Moe Khosravy (center) has over 20 years of software innovation experience delivering enterprise-grade products and platforms differentiated by data science, powerful analytics and applied machine learning to help transform industries. Most recently he was vice president of software at HP Inc., supporting hundreds of millions of connected devices and clients. Mohsen Rahnama leads a global team of accomplished scientists, engineers and product managers responsible for the development and delivery of all RMS catastrophe models and data. During his 20 years at RMS, he has been a dedicated, hands-on leader of the largest team of catastrophe modeling professionals in the industry.

A Model Operation
September 05, 2018EXPOSURE explores the rationale, challenges and benefits of adopting an outsourced model function Business process outsourcing has become a mainstay of the operational structure of many organizations. In recent years, reflecting new technologies and changing market dynamics, the outsourced function has evolved significantly to fit seamlessly within existing infrastructure. On the modeling front, the exponential increase in data coupled with the drive to reduce expense ratios while enhancing performance levels is making the outsourced model proposition an increasingly attractive one. The Business Rationale The rationale for outsourcing modeling activities spans multiple possible origin points, according to Neetika Kapoor Sehdev, senior manager at RMS. “Drivers for adopting an outsourced modeling strategy vary significantly depending on the company itself and their specific ambitions. It may be a new startup that has no internal modeling capabilities, with outsourcing providing access to every component of the model function from day one.” There is also the flexibility that such access provides, as Piyush Zutshi, director of RMS Analytical Services points out. “That creates a huge value-add in terms of our catastrophe response capabilities — knowing that we are able to report our latest position has made a big difference on this front” Judith Woo Starstone “In those initial years, companies often require the flexibility of an outsourced modeling capability, as there is a degree of uncertainty at that stage regarding potential growth rates and the possibility that they may change track and consider alternative lines of business or territories should other areas not prove as profitable as predicted.” Another big outsourcing driver is the potential to free up valuable internal expertise, as Sehdev explains. “Often, the daily churn of data processing consumes a huge amount of internal analytical resources,” she says, “and limits the opportunities for these highly skilled experts to devote sufficient time to analyzing the data output and supporting the decision-making process.” This all-too-common data stumbling block for many companies is one that not only affects their ability to capitalize fully on their data, but also to retain key analytical staff. “Companies hire highly skilled analysts to boost their data performance,” Zutshi says, “but most of their working day is taken up by data crunching. That makes it extremely challenging to retain that caliber of staff as they are massively overqualified for the role and also have limited potential for career growth.” Other reasons for outsourcing include new model testing. It provides organizations with a sandbox testing environment to assess the potential benefits and impact of a new model on their underwriting processes and portfolio management capabilities before committing to the license fee. The flexibility of outsourced model capabilities can also prove critical during renewal periods. These seasonal activity peaks can be factored into contracts to ensure that organizations are able to cope with the spike in data analysis required as they reanalyze portfolios, renew contracts, add new business and write off old business. “At RMS Analytical Services,” Zutshi explains, “we prepare for data surge points well in advance. We work with clients to understand the potential size of the analytical spike, and then we add a factor of 20 to 30 percent to that to ensure that we have the data processing power on hand should that surge prove greater than expected.” Things to Consider Integrating an outsourced function into existing modeling processes can prove a demanding undertaking, particularly in the early stages where companies will be required to commit time and resources to the knowledge transfer required to ensure a seamless integration. The structure of the existing infrastructure will, of course, be a major influencing factor in the ease of transition. “There are those companies that over the years have invested heavily in their in-house capabilities and developed their own systems that are very tightly bound within their processes,” Sehdev points out, “which can mean decoupling certain aspects is more challenging. For those operations that run much leaner infrastructures, it can often be more straightforward to decouple particular components of the processing.” RMS Analytical Services has, however, addressed this issue and now works increasingly within the systems of such clients, rather than operating as an external function. “We have the ability to work remotely, which means our teams operate fully within their existing framework. This removes the need to decouple any parts of the data chain, and we can fit seamlessly into their processes.” This also helps address any potential data transfer issues companies may have, particularly given increasingly stringent information management legislation and guidelines. There are a number of factors that will influence the extent to which a company will outsource its modeling function. Unsurprisingly, smaller organizations and startup operations are more likely to take the fully outsourced option, while larger companies tend to use it as a means of augmenting internal teams — particularly around data engineering. RMS Analytical Services operate various different engagement models. Managed services are based on annual contracts governed by volume for data engineering and risk analytics. On-demand services are available for one-off risk analytics projects, renewals support, bespoke analysis such as event response, and new IP adoption. “Modeler down the hall” is a third option that provides ad hoc work, while the firm also offers consulting services around areas such as process optimization, model assessment and transition support. Making the Transition Work Starstone Insurance, a global specialty insurer providing a diversified range of property, casualty and specialty insurance to customers worldwide, has been operating an outsourced modeling function for two and a half years. “My predecessor was responsible for introducing the outsourced component of our modeling operations,” explains Judith Woo, head of exposure management at Starstone. “It was very much a cost-driven decision as outsourcing can provide a very cost-effective model.” The company operates a hybrid model, with the outsourced team working on most of the pre- and post-bind data processing, while its internal modeling team focuses on the complex specialty risks that fall within its underwriting remit. “The volume of business has increased over the years as has the quality of data we receive,” she explains. “The amount of information we receive from our brokers has grown significantly. A lot of the data processing involved can be automated and that allows us to transfer much of this work to RMS Analytical Services.” On a day-to-day basis, the process is straightforward, with the Starstone team uploading the data to be processed via the RMS data portal. The facility also acts as a messaging function with the two teams communicating directly. “In fact,” Woo points out, “there are email conversations that take place directly between our underwriters and the RMS Analytical Service team that do not always require our modeling division’s input.” However, reaching this level of integration and trust has required a strong commitment from Starstone to making the relationship work. “You are starting to work with a third-party operation that does not understand your business or its data processes. You must invest time and energy to go through the various systems and processes in detail,” she adds, “and that can take months depending on the complexity of the business. “You are essentially building an extension of your team, and you have to commit to making that integration work. You can’t simply bring them in, give them a particular problem and expect them to solve it without there being the necessary knowledge transfer and sharing of information.” Her internal modeling team of six has access to an outsourced team of 26, she explains, which greatly enhances the firm’s data-handling capabilities. “With such a team, you can import fresh data into the modeling process on a much more frequent basis, for example. That creates a huge value-add in terms of our catastrophe response capabilities — knowing that we are able to report our latest position has made a big difference on this front.” Creating a Partnership As with any working partnership, the initial phases are critical as they set the tone for the ongoing relationship. “We have well-defined due diligence and transition methodologies,” Zutshi states. “During the initial phase, we work to understand and evaluate their processes. We then create a detailed transition methodology, in which we define specific data templates, establish monthly volume loads, lean periods and surge points, and put in place communication and reporting protocols.” At the end, both parties have a full documented data dictionary with business rules governing how data will be managed, coupled with the option to choose from a repository of 1,000+ validation rules for data engineering. This is reviewed on a regular basis to ensure all processes remain aligned with the practices and direction of the organization. “Often, the daily churn of data processing consumes a huge amount of internal analytical resources and limits the opportunities to devote sufficient time to analyzing the data output” — Neetika Kapoor Sehdev, RMS Service level agreements (SLAs) also form also form a central tenet of the relationship plus stringent data compliance procedures. “Robust data security and storage is critical,” says Woo. “We have comprehensive NDAs [non-disclosure agreements] in place that are GDPR compliant to ensure that the integrity of our data is maintained throughout. We also have stringent SLAs in place to guarantee data processing turnaround times. Although, you need to agree on a reasonable time period reflecting the data complexity and also when it is delivered.” According to Sehdev, most SLAs that the analytical team operates require a 24-hour data turnaround rising to 48-72 hours for more complex data requirements, but clients are able to set priorities as needed. “However, there is no point delivering on turnaround times,” she adds, “if the quality of the data supplied is not fit for purpose. That’s why we apply a number of data quality assurance processes, which means that our first-time accuracy level is over 98 percent.” The Value-Add Most clients of RMS Analytical Services have outsourced modeling functions to the division for over seven years, with a number having worked with the team since it launched in 2004. The decision to incorporate their services is not taken lightly given the nature of the information involved and the level of confidence required in their capabilities. “The majority of our large clients bring us on board initially in a data-engineering capacity,” explains Sehdev. “It’s the building of trust and confidence in our ability, however, that helps them move to the next tranche of services.” The team has worked to strengthen and mature these relationships, which has enabled them to increase both the size and scope of the engagements they undertake. “With a number of clients, our role has expanded to encompass account modeling, portfolio roll-up and related consulting services,” says Zutshi. “Central to this maturing process is that we are interacting with them daily and have a dedicated team that acts as the primary touch point. We’re also working directly with the underwriters, which helps boost comfort and confidence levels. “For an outsourced model function to become an integral part of the client’s team,” he concludes, “it must be a close, coordinated effort between the parties. That’s what helps us evolve from a standard vendor relationship to a trusted partner.”

Pushing Back the Water
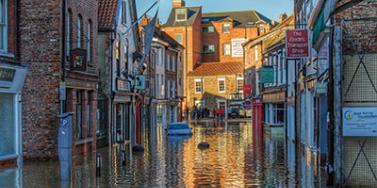
September 05, 2018Flood Re has been tasked with creating a risk-reflective, affordable U.K. flood insurance market by 2039. Moving forward, data resolution that supports critical investment decisions will be key Millions of properties in the U.K. are exposed to some form of flood risk. While exposure levels vary massively across the country, coastal, fluvial and pluvial floods have the potential to impact most locations across the U.K. Recent flood events have dramatically demonstrated this with properties in perceived low-risk areas being nevertheless severely affected. Before the launch of Flood Re, securing affordable household cover in high-risk areas had become more challenging — and for those impacted by flooding, almost impossible. To address this problem, Flood Re — a joint U.K. Government and insurance-industry initiative — was set up in April 2016 to help ensure available, affordable cover for exposed properties. The reinsurance scheme’s immediate aim was to establish a system whereby insurers could offer competitive premiums and lower excesses to highly exposed households. To date it has achieved considerable success on this front. Of the 350,000 properties deemed at high risk, over 150,000 policies have been ceded to Flood Re. Over 60 insurance brands representing 90 percent of the U.K. home insurance market are able to cede to the scheme. Premiums for households with prior flood claims fell by more than 50 percent in most instances, and a per-claim excess of £250 per claim (as opposed to thousands of pounds) was set. While there is still work to be done, Flood Re is now an effective, albeit temporary, barrier to flood risk becoming uninsurable in high-risk parts of the U.K. However, in some respects, this success could be considered low-hanging fruit. A Temporary Solution Flood Re is intended as a temporary solution, granted with a considerable lifespan. By 2039, when the initiative terminates, it must leave behind a flood insurance market based on risk-reflective pricing that is affordable to most households. To achieve this market nirvana, it is also tasked with working to manage flood risks. According to Gary McInally, chief actuary at Flood Re, the scheme must act as a catalyst for this process. “Flood Re has a very clear remit for the longer term,” he explains. “That is to reduce the risk of flooding over time, by helping reduce the frequency with which properties flood and the impact of flooding when it does occur. Properties ought to be presenting a level of risk that is insurable in the future. It is not about removing the risk, but rather promoting the transformation of previously uninsurable properties into insurable properties for the future.” To facilitate this transition to improved property-level resilience, Flood Re will need to adopt a multifaceted approach promoting research and development, consumer education and changes to market practices to recognize the benefit. Firstly, it must assess the potential to reduce exposure levels through implementing a range of resistance (the ability to prevent flooding) and resilience (the ability to recover from flooding) measures at the property level. Second, it must promote options for how the resulting risk reduction can be reflected in reduced flood cover prices and availability requiring less support from Flood Re. According to Andy Bord, CEO of Flood Re: “There is currently almost no link between the action of individuals in protecting their properties against floods and the insurance premium which they are charged by insurers. In principle, establishing such a positive link is an attractive approach, as it would provide a direct incentive for households to invest in property-level protection. “Flood Re is building a sound evidence base by working with academics and others to quantify the benefits of such mitigation measures. We are also investigating ways the scheme can recognize the adoption of resilience measures by householders and ways we can practically support a ‘build-back-better’ approach by insurers.” Modeling Flood Resilience Multiple studies and reports have been conducted in recent years into how to reduce flood exposure levels in the U.K. However, an extensive review commissioned by Flood Re spanning over 2,000 studies and reports found that while helping to clarify potential appropriate measures, there is a clear lack of data on the suitability of any of these measures to support the needs of the insurance market. A 2014 report produced for the U.K. Environment Agency identified a series of possible packages of resistance and resilience measures. The study was based on the agency’s Long-Term Investment Scenario (LTIS) model and assessed the potential benefit of the various packages to U.K. properties at risk of flooding. The 2014 study is currently being updated by the Environment Agency, with the new study examining specific subsets based on the levels of benefit delivered. “It is not about removing the risk, but rather promoting the transformation of previously uninsurable properties into insurable properties” Gary McInally Flood Re Packages considered will encompass resistance and resilience measures spanning both active and passive components. These include: waterproof external walls, flood-resistant doors, sump pumps and concrete flooring. The effectiveness of each is being assessed at various levels of flood severity to generate depth damage curves. While the data generated will have a foundational role in helping support outcomes around flood-related investments, it is imperative that the findings of the study undergo rigorous testing, as McInally explains. “We want to promote the use of the best-available data when making decisions,” he says. “That’s why it was important to independently verify the findings of the Environment Agency study. If the findings differ from studies conducted by the insurance industry, then we should work together to understand why.” To assess the results of key elements of the study, Flood Re called upon the flood modeling capabilities of RMS, and its Europe Inland Flood High-Definition (HD) Models, which provide the most comprehensive and granular view of flood risk currently available in Europe, covering 15 countries including the U.K. The models enable the assessment of flood risk and the uncertainties associated with that risk right down to the individual property and coverage level. In addition, it provides a much longer simulation timeline, capitalizing on advances in computational power through Cloud-based computing to span 50,000 years of possible flood events across Europe, generating over 200,000 possible flood scenarios for the U.K. alone. The model also enables a much more accurate and transparent means of assessing the impact of permanent and temporary flood defenses and their role to protect against both fluvial and pluvial flood events. Putting Data to the Test “The recent advances in HD modeling have provided greater transparency and so allow us to better understand the behavior of the model in more detail than was possible previously,” McInally believes. “That is enabling us to pose much more refined questions that previously we could not address.” While the Environment Agency study provided significant data insights, the LTIS model does not incorporate the capability to model pluvial and fluvial flooding at the individual property level, he explains. RMS used its U.K. Flood HD model to conduct the same analysis recently carried out by the Environment Agency, benefiting from its comprehensive set of flood events together with the vulnerability, uncertainty and loss modeling framework. This meant that RMS could model the vulnerability of each resistance/resilience package for a particular building at a much more granular level. RMS took the same vulnerability data used by the Environment Agency, which is relatively similar to the one used within the model, and ran this through the flood model, to assess the impact of each of the resistance and resilience packages against a vulnerability baseline to establish their overall effectiveness. The results revealed a significant difference between the model numbers generated by the LTIS model and those produced by the RMS Europe Inland Flood HD Models. Since hazard data used by the Environment Agency did not include pluvial flood risk, combined with general lower resolution layers than used in the RMS model, the LTIS study presented an overconcentration and hence overestimation of flood depths at the property level. As a result, the perceived benefits of the various resilience and resistance measures were underestimated — the potential benefits attributed to each package in some instances were almost double those of the original study. The findings can show how using a particular package across a subset of about 500,000 households in certain specific locations, could achieve a potential reduction in annual average losses from flood events of up to 40 percent at a country level. This could help Flood Re understand how to allocate resources to generate the greatest potential and achieve the most significant benefit. A Return on Investment? There is still much work to be done to establish an evidence base for the specific value of property-level resilience and resistance measures of sufficient granularity to better inform flood-related investment decisions. “The initial indications from the ongoing Flood Re cost-benefit analysis work are that resistance measures, because they are cheaper to implement, will prove a more cost-effective approach across a wider group of properties in flood-exposed areas,” McInally indicates. “However, in a post-repair scenario, the cost-benefit results for resilience measures are also favorable.” However, he is wary about making any definitive statements at this early stage based on the research to date. “Flood by its very nature includes significant potential ‘hit-and-miss factors’,” he points out. “You could, for example, make cities such as Hull or Carlisle highly flood resistant and resilient, and yet neither location might experience a major flood event in the next 30 years while the Lake District and West Midlands might experience multiple floods. So the actual impact on reducing the cost of flooding from any program of investment will, in practice, be very different from a simple modeled long-term average benefit. Insurance industry modeling approaches used by Flood Re, which includes the use of the RMS Europe Inland Flood HD Models, could help improve understanding of the range of investment benefit that might actually be achieved in practice.”

Making it Clear
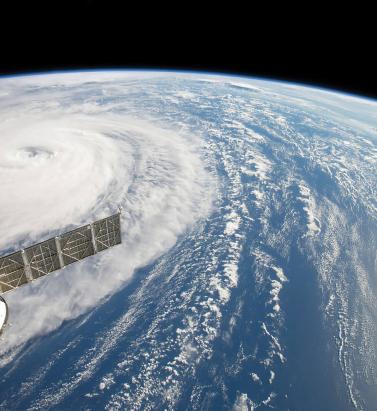
September 05, 2018Pete Dailey of RMS explains why model transparency is critical to client confidence View of Hurricane Harvey from space In the aftermath of Hurricances Harvey, Irma and Maria (HIM), there was much comment on the disparity among the loss estimates produced by model vendors. Concerns have been raised about significant outlier results released by some modelers. “It’s no surprise,” explains Dr. Pete Dailey, vice president at RMS, “that vendors who approach the modeling differently will generate different estimates. But rather than pushing back against this, we feel it’s critical to acknowledge and understand these differences. “At RMS, we develop probabilistic models that operate across the full model space and deliver that insight to our clients. Uncertainty is inherent within the modeling process for any natural hazard, so we can’t rely solely on past events, but rather simulate the full range of plausible future events.” There are multiple components that contribute to differences in loss estimates, including the scientific approaches and technologies used and the granularity of the exposure data. “Increased demand for more immediate data is encouraging modelers to push the envelope” “As modelers, we must be fully transparent in our loss-estimation approach,” he states. “All apply scientific and engineering knowledge to detailed exposure data sets to generate the best possible estimates given the skill of the model. Yet the models always provide a range of opinion when events happen, and sometimes that is wider than expected. Clients must know exactly what steps we take, what data we rely upon, and how we apply the models to produce our estimates as events unfold. Only then can stakeholders conduct the due diligence to effectively understand the reasons for the differences and make important financial decisions accordingly.” Outlier estimates must also be scrutinized in greater detail. “There were some outlier results during HIM, and particularly for Hurricane Maria. The onus is on the individual modeler to acknowledge the disparity and be fully transparent about the factors that contributed to it. And most importantly, how such disparity is being addressed going forward,” says Dailey. “A ‘big miss’ in a modeled loss estimate generates market disruption, and without clear explanation this impacts the credibility of all catastrophe models. RMS models performed quite well for Maria. One reason for this was our detailed local knowledge of the building stock and engineering practices in Puerto Rico. We’ve built strong relationships over the years and made multiple visits to the island, and the payoff for us and our client comes when events like Maria happen.” As client demand for real-time and pre-event estimates grows, the data challenge placed on modelers is increasing. “Demand for more immediate data is encouraging modelers like RMS to push the scientific envelope,” explains Dailey, “as it should. However, we need to ensure all modelers acknowledge, and to the degree possible quantify, the difficulties inherent in real-time loss estimation — especially since it’s often not possible to get eyes on the ground for days or weeks after a major catastrophe.” Much has been said about the need for modelers to revise initial estimates months after an event occurs. Dailey acknowledges that while RMS sometimes updates its estimates, during HIM the strength of early estimates was clear. “In the months following HIM, we didn’t need to significantly revise our initial loss figures even though they were produced when uncertainty levels were at their peak as the storms unfolded in real time,” he states. “The estimates for all three storms were sufficiently robust in the immediate aftermath to stand the test of time. While no one knows what the next event will bring, we’re confident our models and, more importantly, our transparent approach to explaining our estimates will continue to build client confidence.”


