


EXPOSURE
The RMS Magazine with a unique perspective and clear mission “... to provide insight and analysis to help insurance and risk professionals innovate, adapt, and deliver.”

Insurance: The next 10 years
Mohsen Rahnama, Cihan Biyikoglu and Moe Khosravy of RMS look to 2029, consider the…
Times Square, New York City
Author: Helen Yates
Assigning a Return Period to 2017
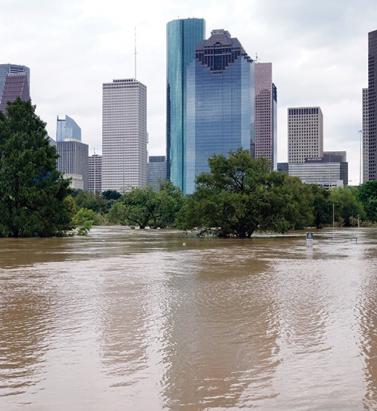
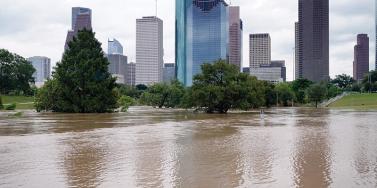
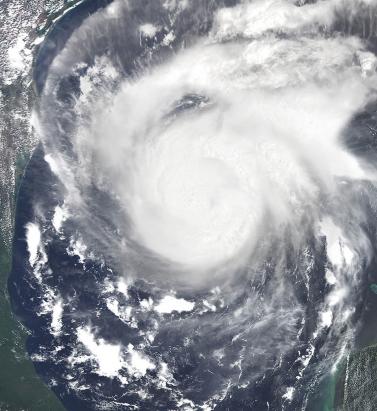
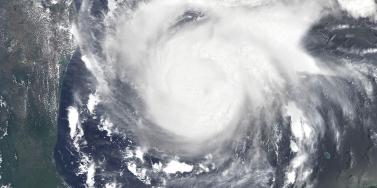
May 11, 2018Hurricanes Harvey, Irma and Maria (HIM) tore through the Caribbean and U.S. in 2017, resulting in insured losses over US$80 billion. Twelve years after Hurricanes Katrina, Rita and Wilma (KRW), EXPOSURE asks if the (re)insurance industry was better prepared for its next ‘terrible trio’ and what lessons can be learned In one sense, 2017 was a typical loss year for the insurance industry in that the majority of losses stemmed from the “peak zone” of U.S. hurricanes. However, not since the 2004-05 season had the U.S. witnessed so many landfalling hurricanes. It was the second most costly hurricane season on record for the (re)insurance industry, when losses in 2005 are adjusted for inflation. According to Aon Benfield, HIM caused total losses over US$220 billion and insured losses over US$80 billion — huge sums in the context of global catastrophe losses for the year of US$344 billion and insured losses of US$134 billion. Overall, weather-related catastrophe losses exceeded 0.4 percent of global GDP in 2017 (based on data from Aon Benfield, Munich Re and the World Bank), the second highest figure since 1990. In that period, only 2005 saw a higher relative catastrophe loss at around 0.5 percent of GDP. But, it seems, (re)insurers were much better prepared to absorb major losses this time around. Much has changed in the 12 years since Hurricane Katrina breached the levees in New Orleans. Catastrophe modeling as a profession has evolved into exposure management, models and underlying data have improved and there is a much greater appreciation of model uncertainty and assumptions, explains Alan Godfrey, head of exposure management at Asta. “Even post-2005 people would still see an event occurring, go to the models and pull out a single event ID … then tell all and sundry this is what we’re going to lose. And that’s an enormous misinterpretation of how the models are supposed to be used. In 2017, people demonstrated a much greater maturity and used the models to advise their own loss estimates, and not the other way around.” It also helped that the industry was extremely well-capitalized moving into 2017. After a decade of operating through a low interest rate and increasingly competitive environment, (re)insurers had taken a highly disciplined approach to capital management. Gone are the days where a major event sparked a series of run-offs. While some (re)insurers have reported higher losses than others, all have emerged intact. “In 2017 the industry has performed incredibly well from an operational point of view,” says Godfrey. “There have obviously been challenges from large losses and recovering capital, but those are almost outside of exposure management.” According to Aon Benfield, global reinsurance capacity grew by 80 percent between 1990 and 2017 (to US$605 billion), against global GDP growth of around 24 percent. The influx of capacity from the capital markets into U.S. property catastrophe reinsurance has also brought about change and innovation, offering new instruments such as catastrophe bonds for transferring extreme risks. Harvey broke all U.S. records for tropical cyclone-driven rainfall with observed cumulative rainfall of 51 inches Much of this growth in non-traditional capacity has been facilitated by better data and more sophisticated analytics, along with a healthy appetite for insurance risk from pension funds and other institutional investors. For insurance-linked securities (ILS), the 2017 North Atlantic hurricane season, Mexico’s earthquakes and California’s wildfires were their first big test. “Some thought that once we had a significant year that capital would leave the market,” says John Huff, president and chief executive of the Association of Bermuda Insurers and Reinsurance (ABIR). “And we didn’t see that. “In January 2018 we saw that capital being reloaded,” he continues. “There is abundant capital in all parts of the reinsurance market. Deploying that capital with a reasonable rate of return is, of course, the objective.” Huff thinks the industry performed extremely well in 2017 in spite of the severity of the losses and a few surprises. “I’ve even heard of reinsurers that were ready with claim payments on lower layers before the storm even hit. The modeling and ability to track the weather is getting more sophisticated. We saw some shifting of the storms — Irma was the best example — but reinsurers were tracking that in real time in order to be able to respond.” The Buffalo Bayou River floods a park in Houston after the arrival of Hurricane Harvey How Harvey Inundated Houston One lesson the industry has learned over three decades of modeling is that models are approximations of reality. Each event has its own unique characteristics, some of which fall outside of what is anticipated by the models. The widespread inland flooding that occurred after Hurricane Harvey made landfall on the Texas coastline is an important illustration of this, explains Huff. Even so, he adds, it continued a theme, with flood losses being a major driver of U.S. catastrophe claims for several years now. “What we’re seeing is flood events becoming the No. 1 natural disaster in the U.S. for people who never thought they were at risk of flood.” Harvey broke all U.S. records for tropical cyclone-driven rainfall with observed cumulative rainfall of 51 inches (129 centimeters). The extreme rainfall generated by Harvey and the unprecedented inland flooding across southeastern Texas and parts of southern Louisiana was unusual. However, nobody was overly surprised by the fact that losses from Harvey were largely driven by water versus wind. Prior events with significant storm surge-induced flooding, including Hurricane Katrina and 2012’s Superstorm Sandy, had helped to prepare (re)insurers, exposure managers and modelers for this eventuality. “The events themselves were very large but they were well within uncertainty ranges and not disproportionate to expectations,” says Godfrey. “Harvey is a new data point — and we don’t have that many — so the scientists will look at it and know that any new data point will lead to tweaks,” he continues. “If anything, it will make people spend a bit more time on their calibration for the non-modeled elements of hurricane losses, and some may conclude that big changes are needed to their own adjustments.” But, he adds: “Nobody is surprised by the fact that flooding post-hurricane causes loss. We know that now. It’s more a case of tweaking and calibrating, which we will be doing for the rest of our lives.” Flood Modeling Hurricane Harvey also underscored the importance of the investment in sophisticated, probabilistic flood models. RMS ran its U.S. Inland Flood HD Model in real time to estimate expected flood losses. “When Hurricane Harvey happened, we had already simulated losses of that magnitude in our flood model, even before the event occurred,” says Dr. Pete Dailey, vice president of product management and responsible for U.S. flood modeling at RMS. “The value of the model is to be able to anticipate extreme tail events well before they occur, so that insurance companies can be prepared in advance for the kind of risk they’re taking on and what potential claims volume they may have after a major event,” he adds. Does this mean that a US$100 billion-plus loss year like 2017 is now a 1-in-6-year event? Harvey has already offered a wealth of new data that will be fed into the flood model. The emergency shutdown of the Houston metropolitan area prevented RMS meteorologists and engineers from accessing the scene in the immediate aftermath, explains Dailey. However, once on the ground they gathered as much information as they could, observing and recording what had actually happened to affected properties. “We go to individual properties to assess the damage visually, record the latitude and longitude of the property, the street address, the construction, occupancy and the number of stories,” he says. “We will also make an estimate of the age of the property. Those basic parameters allow us to go back and take a look at what the model would have predicted in terms of damage and loss, as compared to what we observed.” The fact that insured losses emanating from the flooding were only a fraction of the total economic losses is an inevitable discussion point. The majority of claims paid were for commercial properties, with residential properties falling under the remit of the National Flood Insurance Program (NFIP). Many residential homes were uninsured, however, explains ABIR’s Huff. “The NFIP covers just the smallest amount of people — there are only five million policies — and yet you see a substantial event like Harvey which is largely uninsured because (re)insurance companies only cover commercial flood in the U.S.,” he says. “After Harvey you’ll see a realization that the private market is very well-equipped to get back into the private flood business, and there’s a national dialogue going on now.” Is 2017 the New Normal? One question being asked in the aftermath of the 2017 hurricane season is: What is the return period for a loss year like 2017? RMS estimates that, in terms of U.S. and Caribbean industry insured wind, storm surge and flood losses, the 2017 hurricane season corresponds to a return period between 15 and 30 years. However, losses on the scale of 2017 occur more frequently when considering global perils. Adjusted for inflation, it is seven years since the industry paid out a similar level of catastrophe claims — US$110 billion on the Tohoku earthquake and tsunami, Thai floods and New Zealand earthquake in 2011. Six years prior to that, KRW cost the industry in excess of US$75 billion (well over US$100 billion in today’s money). So, does this mean that a US$100 billion-plus (or equivalent in inflation-adjusted terms) loss year like 2017 is now a one-in-six-year event? As wealth and insurance penetration grows in developing parts of the world, will we begin to see more loss years like 2011, where catastrophe claims are not necessarily driven by the U.S. or Japan peak zones? “Increased insurance penetration does mean that on the whole losses will increase, but hopefully this is proportional to the premiums and capital that we are getting in,” says Asta’s Godfray. “The important thing is understanding correlations and how diversification actually works and making sure that is applied within business models. “In the past, people were able to get away with focusing on the world in a relatively binary fashion,” he continues. “The more people move toward diversified books of business, which is excellent for efficient use of capital, the more important it becomes to understand the correlations between different regions.” “You could imagine in the future, a (re)insurer making a mistake with a very sophisticated set of catastrophe and actuarial models,” he adds. “They may perfectly take into account all of the non-modeled elements but get the correlations between them all wrong, ending up with another year like 2011 where the losses across the globe are evenly split, affecting them far more than their models had predicted.” As macro trends including population growth, increasing wealth, climate change and urbanization influence likely losses from natural catastrophes, could this mean a shorter return period for years like last year, where industry losses exceeded US$134 billion? “When we look at the average value of properties along the U.S. coastline — the Gulf Coast and East Coast — there’s a noticeable trend of increasing value at risk,” says Dailey. “That is because people are building in places that are at risk of wind damage from hurricanes and coastal flooding. And these properties are of a higher value because they are more complex, have a larger square footage and have more stories. Which all leads to a higher total insured value. “The second trend that we see would be from climate change whereby the storms that produce damage along the coastline may be increasing in frequency and intensity,” he continues. “That’s a more difficult question to get a handle on but there’s a building consensus that while the frequency of hurricane landfalls may not necessarily be increasing, those that do make landfall are increasing in intensity.” Lloyd’s chief executive Inga Beale has stated her concerns about the impact of climate change, following the market’s £4.5 billion catastrophe claims bill for 2017. “That’s a significant number, more than double 2016; we’re seeing the impact of climate change to a certain extent, particularly on these weather losses, with the rising sea level that impacts and increases the amount of loss,” she said in an interview with Bloomberg. While a warming climate is expected to have significant implications for the level of losses arising from storms and other severe weather events, it is not yet clear exactly how this will manifest, according to Tom Sabbatelli, senior product manager at RMS. “We know the waters have risen several centimeters in the last couple of decades and we can use catastrophe models to quantify what sort of impact that has on coastal flooding, but it’s also unclear what that necessarily means for tropical cyclone strength. “The oceans may be warming, but there’s still an ongoing debate about how that translates into cyclone intensity, and that’s been going on for a long time,” he continues. “The reason for that is we just don’t know until we have the benefit of hindsight. We haven’t had a number of major hurricanes in the last few years, so does that mean that the current climate is quiet in the Atlantic? Is 2017 an anomaly or are we going back to more regular severe activity? It’s not until you’re ten or 20 years down the line and you look back that you know for sure.”
Bringing Clarity to Slab Claims
May 11, 2018How will a new collaboration between a major Texas insurer, RMS, Accenture and Texas Tech University provide the ability to determine with accuracy the source of slab claim loss? The litigation surrounding “slab claims” in the U.S. in the aftermath of a major hurricane has long been an issue within the insurance industry. When nothing is left of a coastal property but the concrete slab on which it was built, how do claims handlers determine whether the damage was predominantly caused by water or wind? The decision that many insurers take can spark protracted litigation, as was the case following Hurricane Ike, a powerful storm that caused widespread damage across the state after it made landfall over Galveston in September 2008. The storm had a very large footprint for a Category 2 hurricane, with sustained wind speeds of 110 mph and a 22-foot storm surge. Five years on, litigation surrounding how slab claim damage had been wrought rumbled on in the courts. Recognizing the extent of the issue, major coastal insurers knew they needed to improve their methodologies. It sparked a new collaboration between RMS, a major Texas insurer, Accenture and Texas Tech University (TTU). And from this year, the insurer will be able to utilize RMS data, hurricane modeling methodologies, and software analyses to track the likelihood of slab claims before a tropical cyclone makes landfall and document the post-landfall wind, storm surge and wave impacts over time. The approach will help determine the source of the property damage with greater accuracy and clarity, reducing the need for litigation post-loss, thus improving the overall claims experience for both the policyholder and insurer. To provide super accurate wind field data, RMS has signed a contract with TTU to expand a network of mobile meteorological stations that are ultimately positioned in areas predicted to experience landfall during a real-time event. “Our contract is focused on Texas, but they could also be deployed anywhere in the southern and eastern U.S.,” says Michael Young, senior director of product management at RMS. “The rapidly deployable weather stations collect peak and mean wind speed characteristics and transmit via the cell network the wind speeds for inclusion into our tropical cyclone data set. This is in addition to a wide range of other data sources, which this year includes 5,000 new data stations from our partner Earth Networks.” The storm surge component of this project utilizes the same hydrodynamic storm surge model methodologies embedded within the RMS North Atlantic Hurricane Models to develop an accurate view of the timing, extent and severity of storm surge and wave-driven hazards post-landfall. Similar to the wind field modeling process, this approach will also be informed by ground-truth terrain and observational data, such as high-resolution bathymetry data, tide and stream gauge sensors and high-water marks. “The whole purpose of our involvement in this project is to help the insurer get those insights into what’s causing the damage,” adds Jeff Waters, senior product manager at RMS. “The first eight hours of the time series at a particular location might involve mostly damaging surge, followed by eight hours of damaging wind and surge. So, we’ll know, for instance, that a lot of that damage that occurred in the first eight hours was probably caused by surge. It’s a very exciting and pretty unique project to be part of.”


Brazil: Modeling the World's Future Breadbasket
May 10, 2018How a crop modeling collaboration with IRB Brasil Re could help bridge the protection gap and build a more resilient agricultural base for the future in Brazil Brazil is currently the world’s second largest corn exporter, and is set to overtake the U.S. as the globe’s biggest soybean exporter, with the U.S. Department of Agriculture (USDA) predicting a record Brazilian soybean crop of 115 million metric tons in its outlook for 2018. Yet this agricultural powerhouse — responsible for around a quarter of Brazil’s GDP — remains largely underinsured, according to Victor Roldán, vice president and head of Caribbean and Latin America at RMS. A situation that must be addressed given the importance of the sector for the country’s economy and growing weather extremes farmers must contend with under climate change conditions. The effects of climate change over the next 25 years could lead to further heavy crop losses “Natural perils are identified as the industry’s main risk,” he says. “Major droughts or excess of rain have been big drivers of losses for the sector, and their frequency and severity shall increase under future climate change conditions. During 2014 to 2017, El Niño affected Brazil with some of the largest droughts in some areas of the country and excess of rain in others. “There is a need to structure more effective and attractive insurance products to protect the farmers,” he continues. “For this we need better analytics, a better understanding of the perils, exposure and vulnerability.” Worst Drought in 80 Years The worst drought in 80 years reached its height in 2015, with farmers in Sao Paulo losing up to a third of their crops due to the dry weather. Production of soy shrank by 17 percent between 2013 and 2014 while around a fifth of the state’s citrus crops died. Meanwhile, heavy rain and flash floods in the south of the country also detrimentally impacted agricultural output. The effects of climate change over the next 25 years could lead to further heavy crop losses, according to a study carried out by Brazil’s Secretariat of Strategic Issues (SAE). It found that some of the country’s main crops could suffer a serious decline in the areas already under cultivation, anticipating a decline of up to 39 percent in the soybean crop. This could translate into significant financial losses, since the soybean crop currently brings in around US$20 billion in export earnings annually. IRB Brasil Re has been the leader in the agricultural reinsurance sector of the country for decades and has more than 70 years of agricultural claims data. Today agricultural risks represent its second-largest business line after property. However, insurance penetration remains low in the agricultural sector, and IRB has been seeking ways in which to encourage take-up among farmers. The 2015 drought was a turning point, explains Roldán. “As the largest reinsurance player in Brazil, IRB needed to address in a more systematic way the recorded 16.3 percent increase in claims. The increase was due to the drought in the Midwestern region, which adversely affected corn, soybean and coffee crops and, separately an increase in the historical average rainfall level in the Southern region, which caused damage to the crops.” Building a Probabilistic Crop Model A better crop-weather modeling approach and risk analytics of crop perils will help the market to better understand their risks and drive growth in crop insurance penetration. IRB is partnering with RMS to develop the first fully probabilistic hybrid crop model for the agricultural insurance sector in Brazil, which it is planning to roll out to its cedants. The model will assess crop risks linked with weather drivers, such as drought, excess rainfall, temperature variation, hail events, strong wind and other natural hazards that impact crop yield variability. The model will be suited for different crop insurance products such as named perils (hail, frost, etc.), Multiple-Peril Crop Insurance (MPCI) and revenue covers, and will also include livestock and forestry. “Major droughts or excess of rain have been big drivers of losses for the sector, but also climate change is a worrying trend” Victor Roldán RMS “Weather-driven impacts on crop production are complex perils to model given the natural variability in space and time, the localized nature of the hazards and the complex vulnerability response depending on the intensity, but also on the timing of occurrence,” explains Olivier Bode, manager, global agricultural risk at RMS. “For instance, plant vulnerability not only depends on the intensity of the stress but also on the timing of the occurrence, and the crop phenology or growth stage, which in turn depends on the planting date and the selected variety along with the local weather and soil conditions,” he continues. “Thus, exposure information is critical as you need to know which variety the farmer is selecting and its corresponding planting date to make sure you’re representing correctly the impacts that might occur during a growing season. The hybrid crop model developed by RMS for IRB has explicit modules that account for variety specific responses and dynamic representation of crop growth stages.” The model will rely on more than historical data. “That’s the major advantage of using a probabilistic crop-weather modeling approach,” says Bode. “Typically, insurers are looking at historical yield data to compute actuarial losses and they don’t go beyond that. A probabilistic framework allows insurers to go beyond the short historical yield record, adding value by coupling longer weather time series with crop models. They also allow you to capture future possible events that are not recorded in past weather data, for example, drought events that might span over several years, flood occurrences extending over larger or new areas as well as climate change related impacts. This allows you to calculate exceedance probability losses at different return periods for each crop and for specific scenarios.” There is also significant potential to roll out the model to other geographies in the future, with Colombia currently looking like the obvious next step and opportunity. “The El Niño weather phenomenon affects all of Latin America; it decreases rains by more than 60 percent during the rainy seasons in many countries,” explains Roldán. “Like Brazil, Colombia is a very biologically diverse country and features a variety of ecosystems. Currently, most of the country has under-utilized agricultural land.” Colombia is already a key player worldwide in two products: coffee and cut flowers. But the country signed a number of free trade agreements that will give its producers more access to foreign markets. “So, the expansion of agribusiness insurance is urgently needed in Colombia,” says Roldán.
Where Tsunami Warnings Are Etched in Stone
May 10, 2018EXPOSURE looks back at the 2011 Tohoku event and other significant events that have shaped scientific knowledge and understanding of earthquake risk incorporated into the RMS® Japan Earthquake and Tsunami HD Model Hundreds of ancient markers dot the coastline of Japan, some over 600 years old, as a reminder of the danger of tsunami. Today, a new project to construct a 12.5-meter-high seawall stretching nearly 400 kilometers along Japan’s northeast coast is another reminder. Japan is a highly seismically active country and was well prepared for earthquakes and tsunami ahead of the Tohoku Earthquake in 2011. It had strict building codes, protective tsunami barriers, early-warning systems and disaster-response plans. But it was the sheer magnitude, scale and devastation caused by the Tohoku Earthquake and Tsunami that made it stand out from the many thousands of earthquakes that had come before it in modern times. What had not been foreseen in government planning was that an earthquake of this magnitude could occur, nor that it could produce such a sizable tsunami. The Tohoku Earthquake was a magnitude 9.0 event — off the charts as far as the Japanese historical record for earthquakes was concerned. A violent change in the ocean bottom triggered an immense tsunami with waves of up to 40 meters that tore across the northeast coast of the main island of Honshu, traveling up to 10 kilometers inland in the Sendai area. The tsunami breached sea walls and claimed almost everything in its path, taking 16,000 lives (a further 2,000 remain missing, presumed dead) and causing economic losses of US$235 billion. However, while the historical record proved inadequate preparation for the Tohoku event, the geological record shows that events of that magnitude had occurred before records began, explains Mohsen Rahnama, chief risk modeling officer at RMS. “Since the Tohoku event, there’s been a shift … to moving further back in time using a more full consideration of the geological record” Mohsen Rahnama RMS “If you go back in the geological record to 869 in the Tohoku region, there is evidence for a potentially similarly scaled tsunami,” he explains. “Since the Tohoku event, there’s been a shift in the government assessments moving away from a focus on what happened historically to a more full consideration of the geological record.” The geological record, which includes tsunami deposits in coastal lakes and across the Sendai and Ishinomaki plains, shows there were large earthquakes and associated tsunami in A.D. 869, 1611 and 1896. The findings of this research point to the importance of having a fully probabilistic tsunami model at a very high resolution. Rahnama continues: “The Tohoku event really was the ‘perfect’ tsunami hitting the largest exposure concentration at risk to tsunami in Japan. The new RMS tsunami model for Japan includes tsunami events similar to and in a few cases larger than were observed in 2011. Because the exposure in the region is still being rebuilt, the model cannot produce tsunami events with this scale of loss in Tohoku at this time.” Incorporating Secondary Perils RMS has incorporated the lessons from the Tohoku Earthquake and other major earthquakes that have occurred within its model. There have been several large earthquakes around the world, and they all inform thinking about the largest events, particularly how the ground motions they produce are modeled. Crucially, it includes a fully probabilistic tsunami model that is integrated with the earthquake stochastic event set. On understanding strong ground shaking, information across events is utilized. For example, petrochemical facilities around the world are built with relatively consistent construction practices. This means that examination of the damage experienced by these types of facilities in Chile and Japan can inform the understanding of the performance of these facilities in other parts of the world with similar seismic hazard. The Maule Earthquake in Chile in 2010, the Canterbury sequence of earthquakes in New Zealand in 2010 and 2011, and the more recent Kumamoto Earthquakes in Japan in 2016, have added considerably to the data sets. Most notably they have informed scientific understanding of the nature of secondary earthquake perils, including tsunami, fire following earthquake, landslides and liquefaction. The 2016 Kumamoto Earthquake sequence triggered extensive landsliding. The sequence included five events in the range of magnitude 5.5 to 7.0 and caused severe damage in Kumamoto and Oita Prefectures from ground shaking, landsliding, liquefaction and fire following earthquake. “Liquefaction is in the model as a secondary peril. RMS has redesigned and recalibrated the liquefaction model for Japan. The new model directly calculates damage due to vertical deformation due to liquefaction processes,” says Chesley Williams, senior director, product management at RMS. “While the 1964 Niigata Earthquake with its tipped apartment buildings showed that liquefaction damages can be severe in Japan, on a countrywide basis the earthquake risk is driven by the shaking, tsunami and fire following, followed by liquefaction and landslide. For individual exposures, the key driver of the earthquake risk is very site specific, highlighting the importance of high-resolution modeling in Japan.” The RMS model accounts for the clustering of large events on the Nankai Trough. This is an important advancement as an examination of the historical record shows that events on the Nankai Trough have either occurred as full rupturing events (e.g., 1707 Hoei Earthquake) or as pairs of events (e.g., 1944 and 1946 and two events in 1854). This is different from aftershocks, explains Williams. “Clustered events are events on different sources that would have happened in the long-term earthquake record, and the occurrence of one event impacts the timing of the other events. This is a subtle but important distinction. We can model event clustering on the Nankai Trough due to the comprehensive event record informed by both historical events and the geologic record.” The Tohoku event resulted in insurance losses of US$30 billion to US$40 billion, the costliest earthquake event for the insurance industry in history. While the news media focused on the extreme tsunami, the largest proportion of the insurance claims emanated from damage wrought by the strong ground shaking. Interestingly, likely due to cultural constraints, only a relatively low amount of post-event loss amplification was observed. “In general for very large catastrophes, claims costs can exceed the normal cost of settlement due to a unique set of economic, social and operational factors,” says Williams. “Materials and labor become more expensive and claims leakage can be more of an issue, so there are a number of factors that kick in that are captured by the RMS post-event loss amplification modeling. The Japan model explicitly models post-event loss amplification but limits the impacts to be consistent with the observations in recent events in Japan.” Supply chain disruption and contingent business interruption were significant sources of loss following the Tohoku event. This was exacerbated by the level seven meltdown at the Fukushima nuclear power plant that resulted in evacuations, exclusion zones and rolling blackouts. “We sent reconnaissance teams to Japan after the event to understand the characteristics of damage and to undertake case studies for business interruption,” says Williams. “We visited large industrial facilities and talked to them about their downtime, their material requirement and their access to energy sources to better understand what had impacted their ability to get back up and running.” Recent events have re-emphasized that there are significant differences in business interruption by occupancy. “For example, a semiconductor facility is likely going to have a longer downtime than a cement factory,” says Williams. “The recent events have highlighted the impacts on business interruption for certain occupancies by damage to supply sources. These contingent business interruptions are complex, so examination of the case studies investigated in Japan were instrumental for informing the model.” Rebuilding in the seven years since the Tohoku Tsunami struck has been an exercise in resilient infrastructure. With nearly half a million people left homeless, there has been intense rebuilding to restore services, industry and residential property. US$12 billion has been spent on seawalls alone, replacing the 4-meter breakwaters with 12.5-meter-high tsunami barriers. An endless convoy of trucks has been moving topsoil from the hills to the coastline in order to raise the land by over 10 meters in places. Most cities have decided to elevate by several meters, with a focus on rebuilding commercial premises in exposed areas. Some towns have forbidden the construction of homes in flat areas nearest the coasts and relocated residents to higher ground. Tokyo-Yokohama: The World’s Most Exposed Metropolis The Japanese metropolis of Tokyo-Yokohama has the world’s greatest GDP at risk from natural catastrophes. Home to 38 million residents, it has potential for significant economic losses from multiple perils, but particularly earthquakes. According to Swiss Re it is the riskiest metropolitan area in the world. A combination of strict building codes, land use plans and disaster preparedness have significantly reduced the city’s vulnerability in recent decades. Despite the devastation caused by the tsunami, very few casualties (around 100) related to partial or complete building collapse resulting from ground shaking during the magnitude 9.0 Tohoku Earthquake.


A Burgeoning Opportunity
September 04, 2017As traditional (re)insurers hunt for opportunity outside of property catastrophe classes, new probabilistic casualty catastrophe models are becoming available. At the same time, as catastrophe risks are becoming increasingly “manufactured” or human-made, so casualty classes have the potential to be the source of claims after a large “natural” catastrophe. Just as the growing sophistication of property catastrophe models has enabled industry innovation, there is growing excitement that new tools available to casualty (re)insurers could help to expand the market. By improved evaluation of casualty clash exposures, reinsurers will be better able to understand, price and manage their exposures, as well as design new products that cater to underserved areas. However, the casualty market must switch from pursuing a purely defensive strategy. “There is an ever-growing list of exclusions in liability insurance and interest in the product is declining with the proliferation of these exclusions,” explains Dr. Robert Reville, president and CEO of Praedicat, the world’s first liability catastrophe modeling company. “There is a real growth opportunity for the industry to deal with these exclusions and recognize where they can confidently write more business. “Industry practitioners look at what’s happened in property — where modeling has led to a lot of new product ideas, including capital market solutions, and a lot of innovation — and casualty insurers are hungry for that sort of innovation, for the same sort of transformation in liability that happened in property,” he adds. Perils — particularly emerging risks that underwriters have struggled to price, manage and understand — have typically been excluded from casualty products. This includes electromagnetic fields (EMFs), such as those emanating from broadcast antennas and cell phones. Cover for such exposures is restricted, particularly for the U.S. market, where it is often excluded entirely. Some carriers will not offer any cover at all if the client has even a remote exposure to EMF risks. Yet are they being over-apprehensive about the risk? The fear that leads to an over application of exclusions is very tangible. “The latency of the disease development process — or the way a product might be used, with more people becoming exposed over time — causes there to be a build-up of risk that may result in catastrophe,” Reville continues. “Insurers want to be relevant to insuring innovation in product, but they have to come to terms with the latency and the potential for a liability catastrophe that might emerge from it.” Unique Nature of Casualty Catastrophe It is a misconception that casualty is not a catastrophe class of business. Reville points out that the industry’s US$100 billion-plus loss relating to asbestos claims is arguably its biggest-ever catastrophe. Within the Lloyd’s market the overwhelming nature of APH (asbestos, pollution and health) liabilities contributed to the market’s downward spiral in the late 1980s, only brought under control through the formation of the run-off entity Equitas, now owned and managed by Warren Buffett’s Berkshire Hathaway. As the APH claims crisis demonstrated, casualty catastrophes differ from property catastrophes in that they are a “two-tailed loss.” There is the “tail loss” both have in common, which describes the high frequency, low probability characteristics — or high return period — of a major event. But in addition, casualty classes of business are “long-tail” in nature. This means that a policy written in 2017 may not experience a claim until 20 years later, providing an additional challenge from a modeling and reserving perspective. “Casualty insurers are hungry for that sort of innovation, for the same sort of transformation in liability that happened in property” Robert Reville Praedicat Another big difference between casualty clash and property catastrophe from a modeling perspective is that the past is not a good indication of future claims. “By the time asbestos litigation had really taken off, it was already a banned product in the U.S., so it was not as though asbestos claims were any use in trying to figure out where the next environmental disaster or next product liability was going to be,” says Reville. “So, we needed a forward-looking approach to identify where there could be new sources of litigation.” With the world becoming both more interconnected and more litigious, there is every expectation that future casualty catastrophe losses could be much greater and impact multiple classes of business. “The reality is there’s serial aggregation and systemic risk within casualty business, and our answer to that has generally been that it’s too difficult to quantify,” says Nancy Bewlay, chief underwriting officer, global casualty, at XL Catlin. “But the world is changing. We now have technology advances and data collection capabilities we never had before, and public information that can be used in the underwriting process. “Take the Takata airbag recall,” she continues. “In 2016, they had to recall 100 million airbags worldwide. It affected all the major motor manufacturers, who then faced the accumulation potential not only of third-party liability claims, but also product liability and product recall. Everything starts to accumulate and combine within that one industry, and when you look at the economic footprint of that throughout the supply chain there’s a massive potential for a casualty catastrophe when you see how everything is interconnected.” RMS chief research officer Robert Muir-Wood explains: “Another area where we can expect an expansion of modeling applications concerns casualty lines picking up losses from more conventional property catastrophes. This could occur when the cause of a catastrophe can be argued to have ‘non-natural’ origins, and particularly where there are secondary ‘cascade’ consequences of a catastrophe — such as a dam failing after a big earthquake or for claims on ‘professional lines’ coverages of builders and architects — once it is clear that standard property insurance lines will not compensate for all the building damage.” “This could be prevalent in regions with low property catastrophe insurance penetration, such as in California, where just one in ten homeowners has earthquake cover. In the largest catastrophes, we could expect claims to be made against a wide range of casualty lines. The big innovation around property catastrophe in particular was to employ high-resolution GIS [geographic information systems] data to identify the location of all the risk. We need to apply similar location data to casualty coverages, so that we can estimate the combined consequences of a property/casualty clash catastrophe.” One active instance, cited by Muir-Wood, of this shift from property to casualty cover- ages concerns earthquakes in Oklahoma. “There are large amounts of wastewater left over from fracking, and the cheapest way of disposing of it is to pump it down deep boreholes. But this process has been triggering earthquakes, and these earthquakes have started getting quite big — the largest so far in September 2016 had a magnitude of M5.8. “At present the damage to buildings caused by these earthquakes is being picked up by property insurers,” he continues. “But what you will see over time are lawsuits to try and pass the costs back to the operators of the wells themselves. Working with Praedicat, RMS has done some modeling work on how these operators can assess the risk cost of adding a new disposal well. Clearly the larger the earthquake, the less likely it is to occur. However, the costs add up: our modeling shows that an earthquake bigger than M6 right under Oklahoma City could cause more than US$10 billion of damage.” Muir-Wood adds: “The challenge is that casualty insurance tends to cover many potential sources of liability in the contract and the operators of the wells, and we believe their insurers are not currently identifying this particular — and potentially catastrophic —source of future claims. There’s the potential for a really big loss that would eventually fall onto the liability writers of these deep wells … and they are not currently pricing for this risk, or managing their portfolios of casualty lines.” A Modeled Class of Business According to Reville, the explosion of data and development of data science tools have been key to the development of casualty catastrophe modeling. The opportunity to develop probabilistic modeling for casualty classes of business was born in the mid-2000s when Reville was senior economist at the RAND Corporation. At that time, RAND was using data from the RMS® Probabilistic Terrorism Model to help inform the U.S. Congress in its decision on the renewal of the Terrorism Risk Insurance Act (TRIA). Separately, it had written a paper on the scope and scale of asbestos litigation and its potential future course. “As we were working on these two things it occurred to us that here was this US$100 billion loss — this asbestos problem — and adjacently within property catastrophe insurance there was this developed form of analytics that was helping insurers solve a similar problem. So, we decided to work together to try and figure out if there was a way of solving the problem on the liability side as well,” adds Reville. Eventually Praedicat was spun out of the initial project as its own brand, launching its first probabilistic liability catastrophe model in summer 2016. “The industry has evolved a lot over the past five years, in part driven by Solvency II and heightened interest from the regulators and rating agencies,” says Reville. “There is a greater level of concern around the issue, and the ability to apply technologies to understand risk in new ways has evolved a lot.” There are obvious benefits to (re)insurers from a pricing and exposure management perspective. “The opportunity is changing the way we underwrite,” says Bewlay. “Historically, we underwrote by exclusion with a view to limiting our maximum loss potential. We couldn’t get a clear understanding of our portfolio because we weren’t able to. We didn’t have enough meaningful, statistical and credible data.” “We feel they are not being proactive enough because … there’s the potential for a really big loss that would fall onto the liability writers of these deep wells” Robert Muir-Wood RMS Then there are the exciting opportunities for growth in a market where there is intense competition and downward pressure on rates. “Now you can take a view on the ‘what-if’ scenario and ask: how much loss can I handle and what’s the probability of that happening?” she continues. “So, you can take on managed risk. Through the modeling you can better understand your industry classes and what could happen within your portfolio, and can be slightly more opportunistic in areas where previously you may have been extremely cautious.” Not only does this expand the potential range of casualty insurance and reinsurance products, it should allow the industry to better support developments in burgeoning industries. “Cyber is a classic example,” says Bewlay. “If you can start to model the effects of a cyber loss you might decide you’re OK providing cyber in personal lines for individual homeowners in addition to providing cyber in a traditional business or technology environment. “You would start to model all three of these scenarios and what your potential market share would be to a particular event, and how that would impact your portfolio,” she continues. “If you can answer those questions utilizing your classic underwriting and actuarial techniques, a bit of predictive modeling in there — this is the blend of art and science — you can start taking opportunities that possibly you couldn’t before.”


The Peril of Ignoring The Tail
September 04, 2017Drawing on several new data sources and gaining a number of new insights from recent earthquakes on how different fault segments might interact in future earthquakes, Version 17 of the RMS North America Earthquake Models sees the frequency of larger events increasing, making for a fatter tail. EXPOSURE asks what this means for (re)insurers from a pricing and exposure management perspective. Recent major earthquakes, including the M9.0 Tohoku Earthquake in Japan in 2011 and the Canterbury Earthquake Sequence in New Zealand (2010-2011), have offered new insight into the complexities and interdependencies of losses that occur following major events. This insight, as well as other data sources, was incorporated into the latest seismic hazard maps released by the U.S. Geological Survey (USGS). In addition to engaging with USGS on its 2014 update, RMS went on to invest more than 100 person-years of work in implementing the main findings of this update as well as comprehensively enhancing and updating all components in its North America Earthquake Models (NAEQ). The update reflects the deep complexities inherent in the USGS model and confirms the adage that “earthquake is the quintessential tail risk.” Among the changes to the RMS NAEQ models was the recognition that some faults can interconnect, creating correlations of risk that were not previously appreciated. Lessons from Kaikoura While there is still a lot of uncertainty surrounding tail risk, the new data sets provided by USGS and others have improved the understanding of events with a longer return period. “Global earthquakes are happening all of the time, not all large, not all in areas with high exposures,” explains Renee Lee, director, product management at RMS. “Instrumentation has become more advanced and coverage has expanded such that scientists now know more about earthquakes than they did eight years ago when NAEQ was last released in Version 9.0.” This includes understanding about how faults creep and release energy, how faults can interconnect, and how ground motions attenuate through soil layers and over large distances. “Soil plays a very important role in the earthquake risk modeling picture,” says Lee. “Soil deposits can amplify ground motions, which can potentially magnify the building’s response leading to severe damage.” The 2016 M7.8 earthquake in Kaikoura, on New Zealand’s South Island, is a good example of a complex rupture where fault segments connected in more ways than had previously been realized. In Kaikoura, at least six fault segments were involved, where the rupture “jumped” from one fault segment to the next, producing a single larger earthquake. “The Kaikoura quake was interesting in that we did have some complex energy release moving from fault to fault,” says Glenn Pomeroy, CEO of the California Earthquake Authority (CEA). “We can’t hide our heads in the sand and pretend that scientific awareness doesn’t exist. The probability has increased for a very large, but very infrequent, event, and we need to determine how to manage that risk.” San Andreas Correlations Looking at California, the updated models include events that extend from the north of San Francisco to the south of Palm Springs, correlating exposures along the length of the San Andreas fault. While the prospect of a major earthquake impacting both northern and southern California is considered extremely remote, it will nevertheless affect how reinsurers seek to diversify different types of quake risk within their book of business. “In the past, earthquake risk models have considered Los Angeles as being independent of San Francisco,” says Paul Nunn, head of catastrophe risk modeling at SCOR. “Now we have to consider that these cities could have losses at the same time (following a full rupture of the San Andreas Fault). In Kaikoura, at least six fault segments were involved, where the rupture “jumped” from one fault segment to the next “However, it doesn’t make that much difference in the sense that these events are so far out in the tail … and we’re not selling much coverage beyond the 1-in-500-year or 1-in-1,000-year return period. The programs we’ve sold will already have been exhausted long before you get to that level of severity.” While the contribution of tail events to return period losses is significant, as Nunn explains, this could be more of an issue for insurance companies than (re)insurers, from a capitalization standpoint. “From a primary insurance perspective, the bigger the magnitude and event footprint, the more separate claims you have to manage. So, part of the challenge is operational — in terms of mobilizing loss adjusters and claims handlers — but primary insurers also have the risk that losses from tail events could go beyond the (re)insurance program they have bought. “It’s less of a challenge from the perspective of global (re)insurers, because most of the risk we take is on a loss limited basis — we sell layers of coverage,” he continues. “Saying that, pricing for the top layers should always reflect the prospect of major events in the tail and the uncertainty associated with that.” He adds: “The magnitude of the Tohoku earthquake event is a good illustration of the inherent uncertainties in earthquake science and wasn’t represented in modeled scenarios at that time.” While U.S. regulation stipulates that carriers writing quake business should capitalize to the 1-in-200-year event level, in Canada capital requirements are more conservative in an effort to better account for tail risk. “So, Canadian insurance companies should have less overhang out of the top of their (re)insurance programs,” says Nunn. Need for Post-Event Funding For the CEA, the updated earthquake models could reinvigorate discussions around the need for a mechanism to raise additional claims-paying capacity following a major earthquake. Set up after the Northridge Earthquake in 1994, the CEA is a not-for-profit, publicly managed and privately funded earthquake pool. “It is pretty challenging for a stand-alone entity to take on large tail risk all by itself,” says Pomeroy. “We have, from time to time, looked at the possibility of creating some sort of post-event risk-transfer mechanism. “A few years ago, for instance, we had a proposal in front of the U.S. Congress that would have created the ability for the CEA to have done some post-event borrowing if we needed to pay for additional claims,” he continues. “It would have put the U.S. government in the position of guaranteeing our debt. The proposal didn’t get signed into law, but it is one example of how you could create an additional claim-paying capacity for that very large, very infrequent event.” “(Re)insurers will be considering how to adjust the balance between the LA and San Francisco business they’re writing” Paul Nunn SCOR The CEA leverages both traditional and non-traditional risk-transfer mechanisms. “Risk transfer is important. No one entity can take it on alone,” says Pomeroy. “Through risk transfer from insurer to (re)insurer the risk is spread broadly through the entrance of the capital markets as another source for claim-paying capability and another way of diversifying the concentration of the risk. “We manage our exposure very carefully by staying within our risk-transfer guidelines,” he continues. “When we look at spreading our risk, we look at spreading it through a large number of (re)insurance companies from 15 countries around the world. And we know the (re)insurers have their own strict guidelines on how big their California quake exposure should be.” The prospect of a higher frequency of larger events producing a “fatter” tail also raises the prospect of an overall reduction in average annual loss (AAL) for (re)insurance portfolios, a factor that is likely to add to pricing pressure as the industry approaches the key January 1 renewal date, predicts Nunn. “The AAL for Los Angeles coming down in the models will impact the industry in the sense that it will affect pricing and how much probable maximum loss people think they’ve got. Most carriers are busy digesting the changes and carrying out due diligence on the new model updates. “Although the eye-catching change is the possibility of the ‘big one,’ the bigger immediate impact on the industry is what’s happening at lower return periods where we’re selling a lot of coverage,” he says. “LA was a big driver of risk in the California quake portfolio and that’s coming down somewhat, while the risk in San Francisco is going up. So (re)insurers will be considering how to adjust the balance between the LA and San Francisco business they’re writing.”

The Day a Botnet Took Down the Internet
March 17, 2017The Dyn distributed denial of service (DDoS) attack in October 2016 highlighted security flaws inherent in the Internet of Things (IoT). EXPOSURE asks what this means for businesses and insurers as the world becomes increasingly connected. A decade ago, Internet connections were largely limited to desktop computers, laptops, tablets, and smart phones. Since then there has been an explosion of devices with IP addresses, including baby monitors, connected home appliances, motor vehicles, security cameras, webcams, ‘Fitbits’ and other wearables. Gartner predicts there will be 20.8 billion things connected to the Internet by 2020. In a hyper-connected world, governments, corporates, insurers and banks need to better understand the potential for systemic and catastrophic risk arising from a cyber attack seeking to exploit IoT vulnerabilities. With few actual examples of how such attacks could play out, realistic disaster scenarios and cyber modeling are essential tools by which (re)insurers can manage their aggregate exposures and stress test their portfolios. “IF MALICIOUS ACTORS WANTED TO, THEY WOULD ATTACK CORE SERVICES ON THE INTERNET AND I THINK WE’D BE SEEING A NEAR GLOBAL OUTAGE” KEN MUNRO PEN TEST PARTNERS Many IoT devices currently on the market were not designed with strict IT security in mind. Ethical hackers have demonstrated how everything from cars to children’s toys can be compromised. These connected devices are often an organization’s weakest link. The cyber criminals responsible for the 2013 Target data breach are understood to have gained access to the retailer’s systems and the credit card details of over 40 million customers via the organization’s heating, ventilation and air conditioning (HVAC) system. The assault on DNS hosting firm Dyn in October 2016, which brought down multiple websites including Twitter, Netflix, Amazon, Spotify, Reddit, and CNN in Europe and the U.S., was another wake-up call. The DDoS attack was perpetrated using the Mirai virus to compromise IoT systems. Like a parasite, the malware gained control of an estimated 100,000 devices, using them to bombard and overwhelm Dyn’s infrastructure. This is just the tip of the iceberg, according to Ken Munro, partner, Pen Test Partners. “My first thought [following the Dyn attack] was ‘you ain’t seen nothing yet’. That particular incident was probably using the top end of a terabyte of data per second, and that’s nothing. We’ve already seen a botnet that is several orders of magnitude larger than that. If malicious actors wanted to, they would attack core services on the Internet and I think we’d be seeing a near global outage.” In the rush to bring new IoT devices to market, IT security has been somewhat of an afterthought, thinks Munro. The situation is starting to change, though, with consumer watchdogs in Norway, the Netherlands and the U.S. taking action. However, there is a significant legacy problem to overcome and it will be several years before current security weaknesses are tackled in a meaningful way. “I’ve still got our first baby monitor from 10 years ago,” he points out. “The Mirai botnet should have been impossible, but it wasn’t because a whole bunch of security camera manufacturers did a really cheap job. IT security wasn’t on their radar. They were thinking about keeping people’s homes secure without even considering that the device itself might actually be the problem.” In attempting to understand the future impact of such attacks, it is important to gain a better understanding of motivation. For cyber criminals, DDoS attacks using IoT botnets could be linked to extortion attempts or to diverting the attention of IT professionals away from other activities. For state-sponsored actors, the purpose could be more sinister, with the intent to cause widespread disruption, and potentially physical damage and bodily harm. Insurers Stress-Test “Silent” Cyber It is the latter scenario that is of growing concern to risk and insurance managers. Lloyd’s, for instance, has asked syndicates to create at least three internal “plausible but extreme” cyber attack scenarios as stress-tests for cyber catastrophe losses. It has asked them to calculate their total gross aggregate exposure to each scenario across all classes, including “silent” cyber. AIG is also considering how a major cyber attack could impact its book of business. “We are looking at it, not only from our own ERM perspective, but also to understand what probable maximum losses there could be as we start to introduce other products and are able to attach cyber to traditional property and casualty policies,” explains Mark Camillo, head of cyber at AIG. “We look at different types of scenarios and how they would impact a book.” AIG and a number of Lloyd’s insurers have expanded their cyber offerings to include cover for non-damage business interruption and physical damage and bodily harm arising from a cyber incident. Some carriers – including FM Global – are explicitly including cyber in their traditional suite of products. Others have yet to include explicit wording on how traditional products would respond to a cyber incident. “WE HAVE RELEASED A NUMBER OF CYBER-PHYSICAL ATTACK SCENARIOS THAT CAUSE LOSSES TO TRADITIONAL PROPERTY INSURANCE” ANDREW COBURN RMS “I don’t know if the market will move towards exclusions or including affirmative cyber coverage within property and casualty to give insureds a choice as to how they want to purchase it,” states Camillo. “What will change is that there is going to have to be some sort of due diligence to ensure cyber exposures are coded properly and carriers are taking that into consideration in capital requirements for these types of attacks.” In addition to markets such as Lloyd’s, there is growing scrutiny from insurance industry regulators, including the Prudential Regulation Authority in the U.K., on how a major cyber event could impact the insurance industry and its capital buffers. They are putting pressure on those carriers that are currently silent on how their traditional products would respond, to make it clear whether cyber-triggered events would be covered under conventional policies. “The reinsurance market is certainly concerned about, and constantly looking at the potential for, catastrophic events that could happen across a portfolio,” says William Henriques, senior managing director and co-head of the Cyber Practice Group at Aon Benfield. “That has not stopped them from writing cyber reinsurance and there’s enough capacity out there. But as the market grows and gets to US$10 billion, and reinsurers keep supporting that growth, they are going to be watching that accumulation and potential for catastrophic risk and managing that.” Catastrophic Cyber Scenarios In December 2015 and again in December 2016, parts of Ukraine’s power grid were taken down. WIRED magazine noted that many parts of the U.S. grid were less secure than Ukraine’s and would take longer to reboot. It was eerily similar to a fictitious scenario published by Cambridge University’s Centre for Risk Studies in partnership with Lloyd’s in 2015. ‘Business Blackout’ considered the impact of a cyber attack on the US power grid, estimating total economic impact from the 1-in-200 scenario would be US$243 billion, rising to US$1 trillion in its most extreme form. It is not beyond the realms of possibility for a Mirai-style virus targeting smart thermostats to be used to achieve such a blackout, thinks Pen Test Partners’ Ken Munro. “You could simultaneously turn them all on and off at the same time and create huge power spikes on the electricity grid. If you turn it on and off and on again quickly, you’ll knock out the grid – then we would see some really serious consequences.” Smart thermostats could be compromised in other ways, for instance by targeting food and pharmaceutical facilities with the aim to spoil goods. There is a commonly held belief that the industrial and supervisory control and data acquisition systems (ICS/SCADA) used by energy and utility companies are immune to cyber attacks because they are disconnected from the Internet, a protective measure known as “air gapping”. Smart thermostats and other connected devices could render that defense obsolete. In its Cyber Accumulation Management System (CAMS v2.0), RMS considered how silent cyber exposures could impact accumulation risk in the event of major cyber attacks on operations technology, using the Ukrainian power grid attack as an example. “We’ve released a number of cyber-physical attack scenarios that cause losses to traditional property insurance,” explains Andrew Coburn, senior vice president at RMS and a founder and member of the executive team of the Cambridge Centre for Risk Studies. “We’re working with our clients on trying to figure out what level of stress test should be running,” he explains. “The CAMS system we’ve released is about running large numbers of scenarios and we have extended that to look at silent cover, things in conventional insurance policies that could potentially be triggered by a cyber attack, such as fires and explosions.” Multiple lines of business could be impacted by a cyber event thinks Coburn, including nearly all property classes, including aviation and aerospace. “We have included some scenarios for marine and cargo insurance, offshore energy lines of business, industrial property, large numbers of general liability and professional lines, and, quite importantly, financial institutions professional indemnity, D&O and specialty lines.” “The IoT is a key element of the systemic potential of cyber attacks,” he says. “Most of the systemic risk is about looking at your tail risk. Insurers need to look at how much capital they need to support each line of business, how much reinsurance they need to buy and how they structure their risk capital.” RMS CAMS v2.0 Scenarios Cyber-Induced Fires in Commercial Office Buildings Hackers exploit vulnerabilities in the smart battery management system of a common brand of laptop, sending their lithium-ion batteries into thermal runaway state. The attack is coordinated to occur on one night. A small proportion of infected laptops that are left on charge overnight overheat and catch fire, and some unattended fires in commercial office buildings spread to cause major losses. Insurers face claims for a large numbers of fires in their commercial property and homeowners’ portfolios. Cyber-Enabled Marine Cargo Theft From Port Cyber criminals gain access to a port management system in use at several major ports. They identify high value cargo shipments and systematically switch and steal containers passing through the ports over many months. When the process of theft is finally discovered, the hackers scramble the data in the system, disabling the ports from operating for several days. Insurers face claims for cargo loss and business interruption in their marine lines. ICS-Triggered Fires in Industrial Processing Plants External saboteurs gain access to the process control network of large processing plants, and spoof the thermostats of the industrial control systems (ICS), causing heat-sensitive processes to overheat and ignite flammable materials in storage facilities. Insurers face sizeable claims for fire and explosions in a number of major industrial facilities in their large accounts and facultative portfolio. PCS-Triggered Explosions on Oil Rigs A disgruntled employee gains access to a Network Operations Centre (NOC) controlling a field of oil rigs, and manipulates several of the Platform Control Systems (PCS) to cause structural misalignment of well heads, damage to several rigs, oil and gas release, and fires. At least one platform has a catastrophic explosion. Insurers face significant claims to multiple production facilities in their offshore energy book. Regional Power Outage From Cyber Attack on U.S. Power Generation A well-resourced cyber team infiltrates malware into the control systems of U.S. power generating companies that creates desynchronization in certain types of generators. Sufficient generators are damaged to cause a cascading regional power outage that is complex to repair. Restoration of power to 90 percent of customers takes two weeks. Insurers face claims in many lines of business, including large commercial accounts, energy, homeowners and speciality lines. The scenario is published as a Lloyd’s Emerging Risk Report ‘Business Blackout’ by Cambridge Centre for Risk Studies and was released in RMS CAMS v1.1. Regional Power Outage From Cyber Attack on UK Power Distribution A nation-state plants ‘Trojan Horse’ rogue hardware in electricity distribution substations, which are activated remotely to curtail power distribution and cause rolling blackouts intermittently over a multi-week campaign. Insurers face claims in many lines of business, including large commercial accounts, energy, homeowners and specialty lines. The scenario is published as ‘Integrated Infrastructure’ by Cambridge Centre for Risk Studies, and was released in RMS CAMS v1.1.
