


EXPOSURE
The RMS Magazine with a unique perspective and clear mission “... to provide insight and analysis to help insurance and risk professionals innovate, adapt, and deliver.”

Insurance: The next 10 years
Mohsen Rahnama, Cihan Biyikoglu and Moe Khosravy of RMS look to 2029, consider the…
Times Square, New York City
Author: Helen Yates


Opening Pandora's Box
May 20, 2019With each new stride in hazard research and science comes the ability to better calculate and differentiate risk Efforts by RMS scientists and engineers to better understand liquefaction vulnerability is shedding new light on the secondary earthquake hazard. However, this also makes it more likely that, unless they can charge for the risk, (re)insurance appetite will diminish for some locations while also increasing in other areas. A more differentiated approach to underwriting and pricing is an inevitable consequence of investment in academic research. Once something has been learned, it cannot be unlearned, explains Robert Muir-Wood, chief research officer at RMS. “In the old days, everybody paid the same for insurance because no one had the means to actually determine how risk varied from location to location, but once you learn how to differentiate risk well, there’s just no going back. It’s like Pandora’s box has been opened. “There are two general types of liquefaction that are just so severe that no one should build on them” Tim Ancheta RMS “At RMS we are neutral on risk,” he adds. “It’s our job to work for all parties and provide the best neutral science-based perspective on risk, whether that’s around climate change in California or earthquake risk in New Zealand. And we and our clients believe that by having the best science-based assessment of risk they can make effective decisions about their risk management.” Spotting a Gap in the Science On September 28, 2018, a large and shallow M7.5 earthquake struck Central Sulawesi, Indonesia, triggering a tsunami over 2 meters in height. The shaking and tsunami caused widespread devastation in and around the provincial capital Palu, but according to a report published by the GEER Association, it was liquefaction and landslides that caused thousands of buildings to collapse in a catastrophe that claimed over 4,000 lives. It was the latest example of a major earthquake that showed that liquefaction — where the ground moves and behaves as if it is a liquid — can be a much bigger driver of loss than previously thought. The Tōhoku Earthquake in Japan during 2011 and the New Zealand earthquakes in Christchurch in 2010 and 2011 were other high-profile examples. The earthquakes in New Zealand caused a combined insurance industry loss of US$22.8-US$26.2 billion, with widespread liquefaction undermining the structural integrity of hundreds of buildings. Liquefaction has been identified by a local engineer as causing 50 percent of the loss. Now, research carried out by RMS scientists is helping insurers and other stakeholders to better understand the impact that liquefaction can have on earthquake-related losses. It is also helping to pinpoint other parts of the world that are highly vulnerable to liquefaction following earthquake. “Before Christchurch we had not appreciated that you could have a situation where a midrise building may be completely undamaged by the earthquake shaking, but the liquefaction means that the building has suffered differential settlement leaving the floors with a slight tilt, sufficient to be declared a 100 percent loss,” explains Muir-Wood. “We realized for the first time that you actually have to model the damage separately,” he continues. “Liquefaction is completely separate to the damage caused by shaking. But in the past we treated them as much of the same. Separating out the hazards has big implications for how we go about modeling the risk, or identifying other situations where you are likely to have extreme liquefaction at some point in the future.” The Missing Link Tim Ancheta, a risk modeler for RMS based in Newark, California, is responsible for developing much of the understanding about the interaction between groundwater depth and liquefaction. Using data from the 2011 earthquake in Christchurch and boring data from numerous sites across California to calculate groundwater depth, he has been able to identify sites that are particularly prone to liquefaction. “I was hired specifically for evaluating liquefaction and trying to develop a model,” he explains. “That was one of the key goals for my position. Before I joined RMS about seven years back, I was a post-doctoral researcher at PEER — the Pacific Earthquake Engineering Research Center at Berkeley — working on ground motion research. And my doctoral thesis was on the spatial variability of ground motions.” Joining RMS soon after the earthquakes in Christchurch had occurred meant that Ancheta had access to a wealth of new data on the behavior of liquefaction. For the first time, it showed the significance of ground- water depth in determining where the hazard was likely to occur. Research, funded by the New Zealand government, included a survey of liquefaction observations, satellite imagery, a time series of groundwater levels as well as the building responses. It also included data collected from around 30,000 borings. “All that had never existed on such a scale before,” says Ancheta. “And the critical factor here was they investigated both liquefaction sites and non-liquefaction sites — prior surveys had only focused on the liquefaction sites.” Whereas the influence of soil type on liquefaction had been reasonably well understood prior to his research, previous studies had not adequately incorporated groundwater depth. “The key finding was that if you don’t have a clear understanding of where the groundwater is shallow or where it is deep, or the transition — which is important — where you go from a shallow to deep groundwater depth, you can’t turn on and off the liquefaction properly when an earthquake happens,” reveals Ancheta. Ancheta and his team have gone on to collect and digitize groundwater data, geology and boring data in California, Japan, Taiwan and India with a view to gaining a granular understanding of where liquefaction is most likely to occur. “Many researchers have said that liquefaction properties are not regionally dependent, so that if you know the geologic age or types of soils, then you know approximately how susceptible soils can be to liquefaction. So an important step for us is to validate that claim,” he explains. The ability to use groundwater depth has been one of the factors in predicting potential losses that has significantly reduced uncertainty within the RMS suite of earthquake models, concentrating the losses in smaller areas rather than spreading them over an entire region. This has clear implications for (re)insurers and policymakers, particularly as they seek to determine whether there are any “no-go” areas within cities. “There are two general types of liquefaction that are just so severe that no one should build on them,” says Ancheta. “One is lateral spreading where the extensional strains are just too much for buildings. In New Zealand, lateral spreading was observed at numerous locations along the Avon River, for instance.” California is altogether more challenging, he explains. “If you think about all the rivers that flow through Los Angeles or the San Francisco Bay Area, you can try and model them in the same way as we did with the Avon River in Christchurch. We discovered that not all rivers have a similar lateral spreading on either side of the riverbank. Where the river courses have been reworked with armored slopes or concrete linings — essentially reinforcement — it can actually mitigate liquefaction-related displacements.” The second type of severe liquefaction is called “flow slides” triggered by liquefaction, which is where the soil behaves almost like a landslide. This was the type of liquefaction that occurred in Central Sulawesi when the village of Balaroa was entirely destroyed by rivers of soil, claiming entire neighborhoods. “It’s a type of liquefaction that is extremely rare,” he adds. “but they can cause tens to hundreds of meters of displacement, which is why they are so devastating. But it’s much harder to predict the soils that are going to be susceptible to them as well as you can for other types of liquefaction surface expressions.” Ancheta is cognizant of the fact that a no-build zone in a major urban area is likely to be highly contentious from the perspective of homeowners, insurers and policymakers, but insists that now the understanding is there, it should be acted upon. “The Pandora’s box for us in the Canterbury Earthquake Sequence was the fact that the research told us where the lateral spreading would occur,” he says. “We have five earthquakes that produced lateral spreading so we knew with some certainty where the lateral spreading would occur and where it wouldn’t occur. With severe lateral spreading you just have to demolish the buildings affected because they have been extended so much.”
Living in a World of Constant Catastrophes
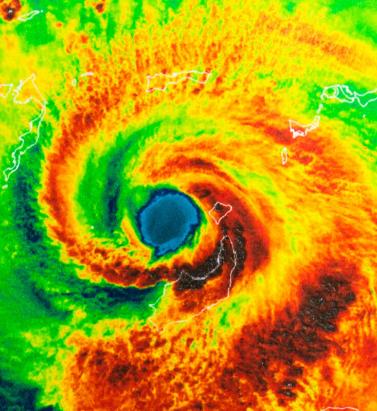
May 20, 2019(Re)insurance companies are waking up to the reality that we are in a riskier world and the prospect of ‘constant catastrophes’ has arrived, with climate change a significant driver In his hotly anticipated annual letter to shareholders in February 2019, Warren Buffett, the CEO of Berkshire Hathaway and acclaimed “Oracle of Omaha,” warned about the prospect of “The Big One” — a major hurricane, earthquake or cyberattack that he predicted would “dwarf Hurricanes Katrina and Michael.” He warned that “when such a mega-catastrophe strikes, we will get our share of the losses and they will be big — very big.” The use of new technology, data and analytics will help us prepare for unpredicted ‘black swan’ events and minimize the catastrophic losses Mohsen Rahnama RMS The question insurance and reinsurance companies need to ask themselves is whether they are prepared for the potential of an intense U.S. landfalling hurricane, a Tōhoku-size earthquake event and a major cyber incident if these types of combined losses hit their portfolio each and every year, says Mohsen Rahnama, chief risk modeling officer at RMS. “We are living in a world of constant catastrophes,” he says. “The risk is changing, and carriers need to make an educated decision about managing the risk. “So how are (re)insurers going to respond to that? The broader perspective should be on managing and diversifying the risk in order to balance your portfolio and survive major claims each year,” he continues. “Technology, data and models can help balance a complex global portfolio across all perils while also finding the areas of opportunity.” A Barrage of Weather Extremes How often, for instance, should insurers and reinsurers expect an extreme weather loss year like 2017 or 2018? The combined insurance losses from natural disasters in 2017 and 2018 according to Swiss Re sigma were US$219 billion, which is the highest-ever total over a two-year period. Hurricanes Harvey, Irma and Maria delivered the costliest hurricane loss for one hurricane season in 2017. Contributing to the total annual insurance loss in 2018 was a combination of natural hazard extremes, including Hurricanes Michael and Florence, Typhoons Jebi, Trami and Mangkhut, as well as heatwaves, droughts, wildfires, floods and convective storms. While it is no surprise that weather extremes like hurricanes and floods occur every year, (re)insurers must remain diligent about how such risks are changing with respect to their unique portfolios. Looking at the trend in U.S. insured losses from 1980–2018, the data clearly shows losses are increasing every year, with climate-related losses being the primary drivers of loss, especially in the last four decades (even allowing for the fact that the completeness of the loss data over the years has improved). Measuring Climate Change With many non-life insurers and reinsurers feeling bombarded by the aggregate losses hitting their portfolios each year, insurance and reinsurance companies have started looking more closely at the impact that climate change is having on their books of business, as the costs associated with weather-related disasters increase. The ability to quantify the impact of climate change risk has improved considerably, both at a macro level and through attribution research, which considers the impact of climate change on the likelihood of individual events. The application of this research will help (re)insurers reserve appropriately and gain more insight as they build diversified books of business. Take Hurricane Harvey as an example. Two independent attribution studies agree that the anthropogenic warming of Earth’s atmosphere made a substantial difference to the storm’s record-breaking rainfall, which inundated Houston, Texas, in August 2017, leading to unprecedented flooding. In a warmer climate, such storms may hold more water volume and move more slowly, both of which lead to heavier rainfall accumulations over land. Attribution studies can also be used to predict the impact of climate change on the return-period of such an event, explains Pete Dailey, vice president of model development at RMS. “You can look at a catastrophic event, like Hurricane Harvey, and estimate its likelihood of recurring from either a hazard or loss point of view. For example, we might estimate that an event like Harvey would recur on average say once every 250 years, but in today’s climate, given the influence of climate change on tropical precipitation and slower moving storms, its likelihood has increased to say a 1-in-100-year event,” he explains. We can observe an incremental rise in sea level annually — it’s something that is happening right in front of our eyes Pete Dailey RMS “This would mean the annual probability of a storm like Harvey recurring has increased more than twofold from 0.4 percent to 1 percent, which to an insurer can have a dramatic effect on their risk management strategy.” Climate change studies can help carriers understand its impact on the frequency and severity of various perils and throw light on correlations between perils and/or regions, explains Dailey. “For a global (re)insurance company with a book of business spanning diverse perils and regions, they want to get a handle on the overall effect of climate change, but they must also pay close attention to the potential impact on correlated events. “For instance, consider the well-known correlation between the hurricane season in the North Atlantic and North Pacific,” he continues. “Active Atlantic seasons are associated with quieter Pacific seasons and vice versa. So, as climate change affects an individual peril, is it also having an impact on activity levels for another peril? Maybe in the same direction or in the opposite direction?” Understanding these “teleconnections” is just as important to an insurer as the more direct relationship of climate to hurricane activity in general, thinks Dailey. “Even though it’s hard to attribute the impact of climate change to a particular location, if we look at the impact on a large book of business, that’s actually easier to do in a scientifically credible way,” he adds. “We can quantify that and put uncertainty around that quantification, thus allowing our clients to develop a robust and objective view of those factors as a part of a holistic risk management approach.” Of course, the influence of climate change is easier to understand and measure for some perils than others. “For example, we can observe an incremental rise in sea level annually — it’s something that is happening right in front of our eyes,” says Dailey. “So, sea-level rise is very tangible in that we can observe the change year over year. And we can also quantify how the rise of sea levels is accelerating over time and then combine that with our hurricane model, measuring the impact of sea-level rise on the risk of coastal storm surge, for instance.” Each peril has a unique risk signature with respect to climate change, explains Dailey. “When it comes to a peril like severe convective storms — tornadoes and hail storms for instance — they are so localized that it’s difficult to attribute climate change to the future likelihood of such an event. But for wildfire risk, there’s high correlation with climate change because the fuel for wildfires is dry vegetation, which in turn is highly influenced by the precipitation cycle.” Satellite data from 1993 through to the present shows there is an upward trend in the rate of sea-level rise, for instance, with the current rate of change averaging about 3.2 millimeters per year. Sea-level rise, combined with increasing exposures at risk near the coastline, means that storm surge losses are likely to increase as sea levels rise more quickly. “In 2010, we estimated the amount of exposure within 1 meter above the sea level, which was US$1 trillion, including power plants, ports, airports and so forth,” says Rahnama. “Ten years later, the exact same exposure was US$2 trillion. This dramatic exposure change reflects the fact that every centimeter of sea-level rise is subjected to a US$2 billion loss due to coastal flooding and storm surge as a result of even small hurricanes. “And it’s not only the climate that is changing,” he adds. “It’s the fact that so much building is taking place along the high-risk coastline. As a result of that, we have created a built-up environment that is actually exposed to much of the risk.” Rahnama highlighted that because of an increase in the frequency and severity of events, it is essential to implement prevention measures by promoting mitigation credits to minimize the risk. He says: “How can the market respond to the significant losses year after year. It is essential to think holistically to manage and transfer the risk to the insurance chain from primary to reinsurance, capital market, ILS, etc.,” he continues. “The art of risk management, lessons learned from past events and use of new technology, data and analytics will help to prepare for responding to unpredicted ‘black swan’ type of events and being able to survive and minimize the catastrophic losses.” Strategically, risk carriers need to understand the influence of climate change whether they are global reinsurers or local primary insurers, particularly as they seek to grow their business and plan for the future. Mergers and acquisitions and/or organic growth into new regions and perils will require an understanding of the risks they are taking on and how these perils might evolve in the future. There is potential for catastrophe models to be used on both sides of the balance sheet as the influence of climate change grows. Dailey points out that many insurance and reinsurance companies invest heavily in real estate assets. “You still need to account for the risk of climate change on the portfolio, whether you’re insuring properties or whether you actually own them, there’s no real difference.” In fact, asset managers are more inclined to a longer-term view of risk when real estate is part of a long-term investment strategy. Here, climate change is becoming a critical part of that strategy. “What we have found is that often the team that handles asset management within a (re)insurance company is an entirely different team to the one that handles catastrophe modeling,” he continues. “But the same modeling tools that we develop at RMS can be applied to both of these problems of managing risk at the enterprise level. “In some cases, a primary insurer may have a one-to-three-year plan, while a major reinsurer may have a five-to-10-year view because they’re looking at a longer risk horizon,” he adds. “Every time I go to speak to a client — whether it be about our U.S. Inland Flood HD Model or our North America Hurricane Models — the question of climate change inevitably comes up. So, it’s become apparent this is no longer an academic question, it’s actually playing into critical business decisions on a daily basis.” Preparing for a Low-carbon Economy Regulation also has an important role in pushing both (re)insurers and large corporates to map and report on the likely impact of climate change on their business, as well as explain what steps they have taken to become more resilient. In the U.K., the Prudential Regulation Authority (PRA) and Bank of England have set out their expectations regarding firms’ approaches to managing the financial risks from climate change. Meanwhile, a survey carried out by the PRA found that 70 percent of U.K. banks recognize the risk climate change poses to their business. Among their concerns are the immediate physical risks to their business models — such as the exposure to mortgages on properties at risk of flood and exposure to countries likely to be impacted by increasing weather extremes. Many have also started to assess how the transition to a low-carbon economy will impact their business models and, in many cases, their investment and growth strategy. “Financial policymakers will not drive the transition to a low-carbon economy, but we will expect our regulated firms to anticipate and manage the risks associated with that transition,” said Bank of England Governor Mark Carney, in a statement. The transition to a low-carbon economy is a reality that (re)insurance industry players will need to prepare for, with the impact already being felt in some markets. In Australia, for instance, there is pressure on financial institutions to withdraw their support from major coal projects. In the aftermath of the Townsville floods in February 2019 and widespread drought across Queensland, there have been renewed calls to boycott plans for Australia’s largest thermal coal mine. To date, 10 of the world’s largest (re)insurers have stated they will not provide property or construction cover for the US$15.5 billion Carmichael mine and rail project. And in its “Mining Risk Review 2018,” broker Willis Towers Watson warned that finding insurance for coal “is likely to become increasingly challenging — especially if North American insurers begin to follow the European lead.”


IFRS17: Under the Microscope
September 05, 2018How new accounting standards could reduce demand for reinsurance as cedants are forced to look more closely at underperforming books of business They may not be coming into effect until January 1, 2021, but the new IFRS 17 accounting standards are already shaking up the insurance industry. And they are expected to have an impact on the January 1, 2019, renewals as insurers ready themselves for the new regime. Crucially, IFRS 17 will require insurers to recognize immediately the full loss on any unprofitable insurance business. “The standard states that reinsurance contracts must now be valued and accounted for separate to the underlying contracts, meaning that traditional ‘netting down’ (gross less reinsured) and approximate methods used for these calculations may no longer be valid,” explained PwC partner Alex Bertolotti in a blog post. “Even an individual reinsurance contract could be material in the context of the overall balance sheet, and so have the potential to create a significant mismatch between the value placed on reinsurance and the value placed on the underlying risks,” he continued. “This problem is not just an accounting issue, and could have significant strategic and operational implications as well as an impact on the transfer of risk, on tax, on capital and on Solvency II for European operations.” In fact, the requirements under IFRS 17 could lead to a drop in reinsurance purchasing, according to consultancy firm Hymans Robertson, as cedants are forced to question why they are deriving value from reinsurance rather than the underlying business on unprofitable accounts. “This may dampen demand for reinsurance that is used to manage the impact of loss making business,” it warned in a white paper. Cost of Compliance The new accounting standards will also be a costly compliance burden for many insurance companies. Ernst & Young estimates that firms with over US$25 billion in Gross Written Premium (GWP) could be spending over US$150 million preparing for IFRS 17. Under the new regime, insurers will need to account for their business performance at a more granular level. In order to achieve this, it is important to capture more detailed information on the underlying business at the point of underwriting, explained Corina Sutter, director of government and regulatory affairs at RMS. This can be achieved by deploying systems and tools that allow insurers to capture, manage and analyze such granular data in increasingly high volumes, she said. “It is key for those systems or tools to be well-integrated into any other critical data repositories, analytics systems and reporting tools. “From a modeling perspective, analyzing performance at contract level means precisely understanding the risk that is being taken on by insurance firms for each individual account,” continued Sutter. “So, for P&C lines, catastrophe risk modeling may be required at account level. Many firms already do this today in order to better inform their pricing decisions. IFRS 17 is a further push to do so. “It is key to use tools that not only allow the capture of the present risk, but also the risk associated with the future expected value of a contract,” she added. “Probabilistic modeling provides this capability as it evaluates risk over time.”


Taking Cloud Adoption to the Core
September 05, 2018Insurance and reinsurance companies have been more reticent than other business sectors in embracing Cloud technology. EXPOSURE explores why it is time to ditch “the comfort blanket” The main benefits of Cloud computing are well-established and include scale, efficiency and cost effectiveness. The Cloud also offers economical access to huge amounts of computing power, ideal to tackle the big data/big analytics challenge. And exciting innovations such as microservices — allowing access to prebuilt, Cloud-hosted algorithms, artificial intelligence (AI) and machine learning applications, which can be assembled to build rapidly deployed new services — have the potential to transform the (re)insurance industry. And yet the industry has continued to demonstrate a reluctance in moving its core services onto a Cloud-based infrastructure. While a growing number of insurance and reinsurance companies are using Cloud services (such as those offered by Amazon Web Services, Microsoft Azure and Google Cloud) for nonessential office and support functions, most have been reluctant to consider Cloud for their mission-critical infrastructure. In its research of Cloud adoption rates in regulated industries, such as banking, insurance and health care, McKinsey found, “Many enterprises are stuck supporting both their inefficient traditional data-center environments and inadequately planned Cloud implementations that may not be as easy to manage or as affordable as they imagined.” No Magic Bullet It also found that “lift and shift” is not enough, where companies attempt to move existing, monolithic business applications to the Cloud, expecting them to be “magically endowed with all the dynamic features.” “We’ve come up against a lot of that when explaining the difference what a cloud-based risk platform offers,” says Farhana Alarakhiya, vice president of products at RMS. “Basically, what clients are showing us is their legacy offering placed on a new Cloud platform. It’s potentially a better user interface, but it’s not really transforming the process.” Now is the time for the market-leading (re)insurers to make that leap and really transform how they do business, she says. “It’s about embracing the new and different and taking comfort in what other industries have been able to do. A lot of Cloud providers are making it very easy to deliver analytics on the Cloud. So, you’ve got the story of agility, scalability, predictability, compliance and security on the Cloud and access to new analytics, new algorithms, use of microservices when it comes to delivering predictive analytics.” This ease to tap into highly advanced analytics and new applications, unburdened from legacy systems, makes the Cloud highly attractive. Hussein Hassanali, managing partner at VTX Partners, a division of Volante Global, commented: “Cloud can also enhance long-term pricing adequacy and profitability driven by improved data capture, historical data analytics and automated links to third-party market information. Further, the ‘plug-and-play’ aspect allows you to continuously innovate by connecting to best-in-class third-party applications.” While moving from a server-based platform to the Cloud can bring numerous advantages, there is a perceived unwillingness to put high-value data into the environment, with concerns over security and the regulatory implications that brings. This includes data protection rules governing whether or not data can be moved across borders. “There are some interesting dichotomies in terms of attitude and reality,” says Craig Beattie, analyst at Celent Consulting. “Cloud-hosting providers in western Europe and North America are more likely to have better security than (re)insurers do in their internal data centers, but the board will often not support a move to put that sort of data outside of the company’s infrastructure. “Today, most CIOs and executive boards have moved beyond the knee-jerk fears over security, and the challenges have become more practical,” he continues. “They will ask, ‘What can we put in the Cloud? What does it cost to move the data around and what does it cost to get the data back? What if it fails? What does that backup look like?’” With a hybrid Cloud solution, insurers wanting the ability to tap into the scalability and cost efficiencies of a software-as-a-service (SaaS) model, but unwilling to relinquish their data sovereignty, dedicated resources can be developed in which to place customer data alongside the Cloud infrastructure. But while a private or hybrid solution was touted as a good compromise for insurers nervous about data security, these are also more costly options. The challenge is whether the end solution can match the big Cloud providers with global footprints that have compliance and data sovereignty issues already covered for their customers. “We hear a lot of things about the Internet being cheap — but if you partially adopt the Internet and you’ve got significant chunks of data, it gets very costly to shift those back and forth,” says Beattie. A Cloud-first approach Not moving to the Cloud is no longer a viable option long term, particularly as competitors make the transition and competition and disruption change the industry beyond recognition. Given the increasing cost and complexity involved in updating and linking legacy systems and expanding infrastructure to encompass new technology solutions, Cloud is the obvious choice for investment, thinks Beattie. “If you’ve already built your on-premise infrastructure based on classic CPU-based processing, you’ve tied yourself in and you’re committed to whatever payback period you were expecting,” he says. “But predictive analytics and the infrastructure involved is moving too quickly to make that capital investment. So why would an insurer do that? In many ways it just makes sense that insurers would move these services into the Cloud. “State-of-the-art for machine learning processing 10 years ago was grids of generic CPUs,” he adds. “Five years ago, this was moving to GPU-based neural network analyses, and now we’ve got ‘AI chips’ coming to market. In an environment like that, the only option is to rent the infrastructure as it’s needed, lest we invest in something that becomes legacy in less time than it takes to install.” Taking advantage of the power and scale of Cloud computing also advances the march toward real-time, big data analytics. Ricky Mahar, managing partner at VTX Partners, a division of Volante Global, added: “Cloud computing makes companies more agile and scalable, providing flexible resources for both power and space. It offers an environment critical to the ability of companies to fully utilize the data available and capitalize on real-time analytics. Running complex analytics using large data sets enhances both internal decision-making and profitability.” As discussed, few (re)insurers have taken the plunge and moved their mission-critical business to a Cloud-based SaaS platform. But there are a handful. Among these first movers are some of the newer, less legacy-encumbered carriers, but also some of the industry’s more established players. The latter includes U.S.-based life insurer MetLife, which announced it was collaborating with IBM Cloud last year to build a platform designed specifically for insurers. Meanwhile Munich Re America is offering a Cloud-hosted AI platform to its insurer clients. “The ice is thawing and insurers and reinsurers are changing,” says Beattie. “Reinsurers [like Munich Re] are not just adopting Cloud but are launching new innovative products on the Cloud.” What’s the danger of not adopting the Cloud? “If your reasons for not adopting the Cloud are security-based, this reason really doesn’t hold up any more. If it is about reliability, scalability, remember that the largest online enterprises such as Amazon, Netflix are all Cloud-based,” comments Farhana Alarakhiya. “The real worry is that there are so many exciting, groundbreaking innovations built in the Cloud for the (re)insurance industry, such as predictive analytics, which will transform the industry, that if you miss out on these because of outdated fears, you will damage your business. The industry is waiting for transformation, and it’s progressing fast in the Cloud.”


Are We Moving Off The Baseline?
September 05, 2018How is climate change influencing natural perils and weather extremes, and what should reinsurance companies do to respond? Reinsurance companies may feel they are relatively insulated from the immediate effects of climate change on their business, given that most property catastrophe policies are renewed on an annual basis. However, with signs that we are already moving off the historical baseline when it comes to natural perils, there is evidence to suggest that underwriters should already be selectively factoring the influence of climate change into their day-to-day decision-making. Most climate scientists agree that some of the extreme weather anticipated by the United Nations Intergovernmental Panel on Climate Change (IPCC) in 2013 is already here and can be linked to climate change in real time via the burgeoning field of extreme weather attribution. “It’s a new area of science that has grown up in the last 10 to 15 years,” explains Dr. Robert Muir-Wood, chief research officer at RMS. “Scientists run two climate models for the whole globe, both of them starting in 1950. One keeps the atmospheric chemistry static since then, while the other reflects the actual increase in greenhouse gases. By simulating thousands of years of these alternative worlds, we can find the difference in the probability of a particular weather extreme.” “Underwriters should be factoring the influence of climate change into their day-to-day decision-making” For instance, climate scientists have run their models in an effort to determine how much the intensity of the precipitation that caused such devastating flooding during last year’s Hurricane Harvey can be attributed to anthropogenic climate change. Research conducted by scientists at the World Weather Attribution (WWA) project has found that the record rainfall produced by Harvey was at least three times more likely to be due to the influence of global warming. This suggests, for certain perils and geographies, reinsurers need to be considering the implications of an increased potential for certain climate extremes in their underwriting. “If we can’t rely on the long-term baseline, how and where do we modify our perspective?” asks Muir-Wood. “We need to attempt to answer this question peril by peril, region by region and by return period. You cannot generalize and say that all perils are getting worse everywhere, because they’re not. In some countries and perils there is evidence that the changes are already material, and then in many other areas the jury is out and it’s not clear.” Keeping Pace With the Change While the last IPCC Assessment Report (AR5) was published in 2014 (the next is due in 2021), there is some consensus on how climate change is beginning to influence natural perils and climate extremes. Many regional climates naturally have large variations at interannual and even interdecadal timescales, which makes observation of climate change, and validation of predictions, more difficult. “There is always going to be uncertainty when it comes to climate change,” emphasizes Swenja Surminski, head of adaptation research at the Grantham Research Institute on Climate Change and the Environment, part of the London School of Economics and Political Science (LSE). “But when you look at the scientific evidence, it’s very clear what’s happening to temperature, how the average temperature is increasing, and the impact that this can have on fundamental things, including extreme events.” According to the World Economic Forum’s Global Risks Report in 2018, “Too little has been done to mitigate climate change and … our own analysis shows that the likelihood of missing the Paris Agreement target of limiting global warming to two degrees Celsius or below is greater than the likelihood of achieving it.” The report cites extreme weather events and natural disasters as the top two “most likely” risks to happen in the next 10 years and the second- and third-highest risks (in the same order) to have the “biggest impact” over the next decade, after weapons of mass destruction. The failure of climate change mitigation and adaptation is also ranked in the top five for both likelihood and impact. It notes that 2017 was among the three hottest years on record and the hottest ever without an El Niño. It is clear that climate change is already exacerbating climate extremes, says Surminski, causing dry regions to become drier and hot regions to become hotter. “By now, based on our scientific understanding and also thanks to modeling, we get a much better picture of what our current exposure is and how that might be changing over the next 10, 20, even 50 to 100 years,” she says. “There is also an expectation we will have more freak events, when suddenly the weather produces really unexpected, very unusual phenomena,” she continues. “That’s not just climate change. It’s also tied into El Niño and other weather phenomena occurring, so it’s a complex mix. But right now, we’re in a much better position to understand what’s going on and to appreciate that climate change is having an impact.” Pricing for Climate Change For insurance and reinsurance underwriters, the challenge is to understand the extent to which we have already deviated from the historical record and to manage and price for that appropriately. It is not an easy task given the inherent variability in existing weather patterns, according to Andy Bord, CEO of Flood Re, the U.K.’s flood risk pool, which has a panel of international reinsurers. “The existing models are calibrated against data that already includes at least some of the impact of climate change,” he says. “Some model vendors have also recently produced models that aim to assess the impact of climate change on the future level of flood risk in the U.K. We know at least one larger reinsurer has undertaken their own climate change impact analyses. “We view improving the understanding of the potential variability of weather given today’s climate as being the immediate challenge for the insurance industry, given the relatively short-term view of markets,” he adds. The need for underwriters to appreciate the extent to which we may have already moved off the historical baseline is compounded by the conflicting evidence on how climate change is influencing different perils. And by the counterinfluence or confluence, in many cases, of naturally occurring climate patterns, such as El Niño and the Atlantic Multidecadal Oscillation (AMO). The past two decades have seen below-normal European windstorm activity, for instance, and evidence builds that the unprecedented reduction in Arctic sea ice during the autumn months is the main cause, according to Dr. Stephen Cusack, director of model development at RMS. “In turn, the sea ice declines have been driven both by the ‘polar amplification’ aspect of anthropogenic climate change and the positive phase of the AMO over the past two decades, though their relative roles are uncertain. “We view improving the understanding of the potential variability of weather given today’s climate as being the immediate challenge for the insurance industry, given the relatively short-term view of markets” Andy Bord Flood Re “The (re)insurance market right now is saying, ‘Your model has higher losses than our recent experience.’ And what we are saying is that the recent lull is not well understood, and we are unsure how long it will last. Though for pricing future risk, the question is when, and not if, the rebound in European windstorm activity happens. Regarding anthropogenic climate change, other mechanisms will strengthen and counter the currently dominant ‘polar amplification’ process. Also, the AMO goes into positive and negative phases,” he continues. “It’s been positive for the last 20 to 25 years and that’s likely to change within the next decade or so.” And while European windstorm activity has been somewhat muted by the AMO, the same cannot be said for North Atlantic hurricane activity. Hurricanes Harvey, Irma and Maria (HIM) caused an estimated US$92 billion in insured losses, making 2017 the second costliest North Atlantic hurricane season, according to Swiss Re Sigma. “The North Atlantic seems to remain in an active phase of hurricane activity, irrespective of climate change influences that may come on top of it,” the study states. While individual storms are never caused by one factor alone, stressed the Sigma study, “Some of the characteristics observed in HIM are those predicted to occur more frequently in a warmer world.” In particular, it notes the high level of rainfall over Houston and hurricane intensification. While storm surge was only a marginal contributor to the losses from Hurricane Harvey, Swiss Re anticipates the probability of extreme storm surge damage in the northeastern U.S. due to higher seas will almost double in the next 40 years. “From a hurricane perspective, we can talk about the frequency of hurricanes in a given year related to the long-term average, but what’s important from the climate change point of view is that the frequency and the intensity on both sides of the distribution are increasing,” says Dr. Pete Dailey, vice president at RMS. “This means there’s more likelihood of quiet years and more likelihood of very active years, so you’re moving away from the mean, which is another way of thinking about moving away from the baseline. “So, we need to make sure that we are modeling the tail of the distribution really well, and that we’re capturing the really wet years — the years where there’s a higher frequency of torrential rain in association with events that we model.” The Edge of Insurability Over the long term, the industry likely will be increasingly insuring the impact of anthropogenic climate change. One question is whether we will see “no-go” areas in the future, where the risk is simply too high for insurance and reinsurance companies to take on. As Robert Muir-Wood of RMS explains, there is often a tension between the need for (re)insurers to charge an accurate price for the risk and the political pressure to ensure cover remains available and affordable. He cites the community at Queen’s Cove in Grand Bahama, where homes were unable to secure insurance given the repeated storm surge flood losses they have sustained over the years from a number of hurricanes. Unable to maintain a mortgage without insurance, properties were left to fall into disrepair. “Natural selection came up with a solution,” says Muir-Wood, whereby some homeowners elevated buildings on concrete stilts thereby making them once again insurable. “In high-income, flood-prone countries, such as Holland, there has been sustained investment in excellent flood defenses,” he says. “The challenge in developing countries is there may not be the money or the political will to build adequate flood walls. In a coastal city like Jakarta, Indonesia, where the land is sinking as a result of pumping out the groundwater, it’s a huge challenge. “It’s not black and white as to when it becomes untenable to live somewhere. People will find a way of responding to increased incidence of flooding. They may simply move their life up a level, as already happens in Venice, but insurability will be a key factor and accommodating the changes in flood hazard is going to be a shared challenge in coastal areas everywhere.” Political pressure to maintain affordable catastrophe insurance was a major driver of the U.S. residual market, with state-backed Fair Access to Insurance Requirements (FAIR) plans providing basic property insurance for homes that are highly exposed to natural catastrophes. Examples include the California Earthquake Association, Texas Windstorm Insurance Association and Florida Citizens Property Insurance Corporation (and state reinsurer, the FHCF). However, the financial woes experienced by FEMA’s National Flood Insurance Program (NFIP), currently the principal provider of residential flood insurance in the U.S., demonstrates the difficulties such programs face in terms of being sustainable over the long term. With the U.K.’s Flood Re scheme, investment in disaster mitigation is a big part of the solution, explains CEO Andy Bord. However, even then he acknowledges that “for some homes at the very greatest risk of flooding, the necessary investment needed to reduce risks and costs would simply be uneconomic.”

When the Lights Went Out
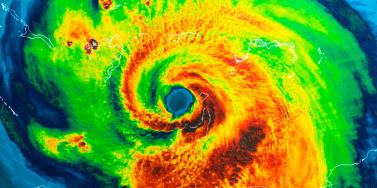
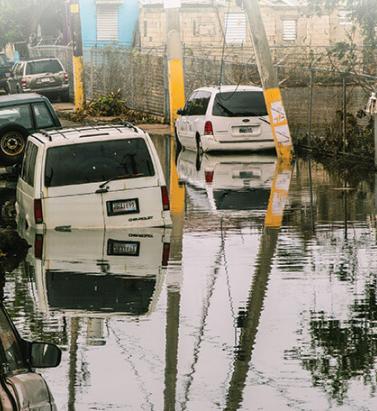
September 05, 2018How poor infrastructure, grid blackouts and runaway business interruption has hampered Puerto Rico’s recovery in the aftermath of Hurricane Maria As the 2018 North Atlantic hurricane season continues, Puerto Rico has yet to recover from destructive events of the previous year. In September 2017, Category 4 Hurricane Maria devastated several Caribbean islands, including Puerto Rico, and left a trail of destruction in its path. For many, Maria was one of the worst natural catastrophes to hit a U.S. territory, causing an estimated US$65 billion to US$115 billion in damage and claiming as many as 4,500 to 5,000 lives. The damage wrought has further strained the island’s sluggish economy. Puerto Rico had over US$70 billion in public debt when Maria hit. Economic forecasts for 2018 to 2020, considering the impact of Hurricane Maria, suggest Puerto Rico’s GDP will decline by 7 to 8 percent in 2018 and likely remain in a negative range of 5 to 7 percent for the next few years. “Resilience is also about the financial capacity to come back and do the reconstruction work” Pooya Sarabandi RMS Power outages, business interruption (BI) and contingent BI (CBI) — including supply chain disruption — have hampered the economy’s recovery. “Resilience is also about the financial capacity to come back and do the reconstruction work,” explains Pooya Sarabandi, global head of data analy- tics at RMS. “You’re now into this chicken- and-egg situation where the Puerto Rican government already has a lot of public debt and doesn’t have reserves, and meanwhile the federal U.S. government is only willing to provide a certain level of funding.” Maria’s devastating impact on Puerto Rico demonstrates the lasting effect a major catastrophe can have when it affects a small, isolated region with a concentrated industry and lack of resilience in infrastructure and lifelines. Whereas manufacturers based on the U.S. mainland have contingencies to tap into — the workforce, raw materials and components, and infrastructure in other parts of the country during times of need — there is not the same opportunity to do this on an island, explains Sarabandi. Rolling Blackouts Following Maria’s landfall, residences and businesses experienced power outages throughout the island. Severe physical damage to electric power generation plants, transmission and distribution systems — including solar and wind power generation plants — plunged the island into a prolonged period of rolling blackouts. Around 80 percent of utility poles were damaged in the event, leaving most of the island without electricity. Two weeks after the storm, 90 percent of the island was still without power. A month on, roughly 85 percent of customers were not connected to the power grid. Three months later, this figure was reported to be about half of Puerto Ricans. And finally, after six months, about 15 percent of residents did not have electricity. “There’s no real damage on the grid itself,” says Victor Roldan, head of Caribbean and Latin America at RMS. “Most of the damage is on the distribution lines around the island. Where they had the better infrastructure in the capital, San Juan, they were able to get it back up and running in about two weeks. But there are still parts of the island without power due to bad distribution infrastructure. And that’s where the business interruption is mostly coming from. “There are reports that 50 percent of all Maria claims for Puerto Rico will be CBI related,” adds Roldan. “Insurers were very competitive, and CBI was included in commercial policies without much thought to the consequences. Policyholders probably paid a fifth of the premiums they should have, way out of kilter with the risk. The majority of CBI claims will be power related, the businesses didn’t experience physical damage, but the loss of power has hit them financially.” Damage to transportation infrastructure, including railways and roads, only delayed the pace of recovery. The Tren Urbano, the island’s only rail line that serves the San Juan metropolitan area (where roughly 60 percent of Puerto Ricans live), started limited service for the first time almost three months after Hurricane Maria struck. There were over 1,500 reported instances of damage to roads and bridges across the island. San Juan’s main airport, the busiest in the Caribbean, was closed for several weeks. A Concentration of Risk Roughly half of Puerto Rico’s economy is based on manufacturing activities, with around US$50 billion in GDP coming from industries such as pharmaceutical, medical devices, chemical, food, beverages and tobacco. Hurricane Maria had a significant impact on manufacturing output in Puerto Rico, particularly on the pharmaceutical and medical devices industries, which is responsible for 30 percent of the island’s GDP. According to Anthony Phillips, chairman of Willis Re Latin America and Caribbean, the final outcome of the BI loss remains unknown but has exceeded expectations due to the length of time in getting power reinstalled. “It’s hard to model the BI loss when you depend on the efficiency of the power companies,” he says. “We used the models and whilst personal lines appeared to come in within expectations, commercial lines has exceeded them. This is mainly due to BI and the inability of the Puerto Rico Electric Power Authority (PREPA) to get things up and running.” Home to more than 80 pharmaceutical manufacturing facilities, many of which are operated by large multinational companies, Puerto Rico’s pharmaceutical hub was a significant aggregation of risk from a supply chain and insurance perspective. Although only a few of the larger pharmaceutical plants were directly damaged by the storm, operations across the sector were suspended or reduced, in some cases for weeks or even months, due to power outages, lack of access and logistics. “The perception of the Business Interruption insurers anticipated, versus the reality, was a complete mismatch” Mohsen Rahnama RMS “The perception of the BI insurers anticipated, versus the reality, was a complete mismatch,” says Mohsen Rahnama, chief risk modeling officer at RMS. “All the big names in pharmaceuticals have operations in Puerto Rico because it’s more cost- effective for production. And they’re all global companies and have backup processes in place and cover for business interruption. However, if there is no diesel on the island for their generators, and if materials cannot get to the island, then there are implications across the entire chain of supply.” While most of the plants were equipped with backup power generation units, manu- facturers struggled due to long-term lack of connection to the island’s only power grid. The continuous functioning of on-site generators was not only key to resuming production lines, power was also essential for refrigeration and storage of the pharmaceuticals. Five months on, 85 medicines in the U.S. were classified by the Food and Drug Administration (FDA) as “in shortage.” There are several reasons why Puerto Rico’s recovery stalled. Its isolation from the U.S. mainland and poor infrastructure were both key factors, highlighted by comparing the island’s recovery to recovery operations following U.S. mainland storms, such as Hurricane Harvey in Texas last year and 2012’s Superstorm Sandy. Not only did Sandy impact a larger area when it hit New York and New Jersey, it also caused severe damage to all transmission and distribution systems in its path. However, recovery and restoration took weeks, not months. It is essential to incorporate the vulnerabilities created by an aggregation of risk, inadequate infrastructure and lack of contingency options into catastrophe and pricing models, thinks Roldan. “There is only one power company and the power company is facing bankruptcy,” he says. “It hasn’t invested in infrastructure in years. Maria wasn’t even the worst-case scenario because it was not a direct hit to San Juan. So, insurers need to be prepared and underwriting business interruption risks in a more sophisticated manner and not succumbing to market pressures.” CBI Impact on Hospitality and Tourism Large-magnitude, high-consequence events have a lasting impact on local populations. Businesses can face increased levels of disruption and loss of revenue due to unavailability of customers, employees or both. These resourcing issues need to be properly considered in the scenario-planning stage, particularly for sectors such as hospitality and tourism. Puerto Rico’s hospitality and tourism sectors are a significant source of its GDP. While 69 percent of hotels and 61 percent of casinos were operational six weeks after Maria struck, according to the Puerto Rico Tourism Company, other factors continued to deter visitors. It was not until the end of February 2018, five months after the event, that roughly 80 percent of Puerto Rico’s hotels and restaurants were back in business with tourists returning to the island. This suggests a considerable loss of income due to indirect business interruption in the hospitality and tourism industry.
The Future for Flood Protection
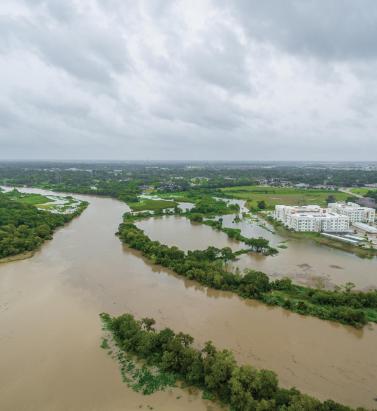
September 05, 2018With innovation in the flood market increasing, EXPOSURE explores whether high-definition (HD) flood models are one of the keys to closing the protection gap In August 2017, Hurricane Harvey brought the highest level of rainfall associated with a tropical cyclone in the U.S. since records began, causing catastrophic flooding in some of the most populated areas of the Texas coast, including Houston. The percentage of losses attributed to inland flood versus wind damage was significant, altering the historical view that precipitation resulting from a tropical storm or hurricane is an attritional loss and highlighting the need for stochastic modeling. Total economic losses resulting from Harvey were around US$85 billion and insured losses were US$30 billion, revealing a significant protection gap, particularly where inland flood damage was concerned. Around 200,000 homes were inundated by the floods, and yet 80 percent of homes in the Houston area were uninsured. Hurricane Harvey Impacts – Aftermath An innovative catastrophe bond has suggested one way this protection gap could be reduced in the future, particularly as a private flood insurance market develops in the U.S. FloodSmart Re, which was announced at the end of July 2018, secured US$500 million of reinsurance protection on behalf of FEMA’s National Flood Insurance Program (NFIP). Reinsurer Hannover Re was acting as the ceding reinsurer for the transaction, sitting between the NFIP and its Bermuda-based special purpose insurer. “It’s a landmark transaction — the first time in history that the U.S. federal government is sponsoring a catastrophe bond,” says John Seo, co-founder and managing principal at Fermat Capital. “It’s just tremendous and I couldn’t be more excited. Events like Harvey are going to accelerate the development of the flood market in terms of risk transfer to the insurance-linked securities (ILS) market. “You have to have more efficient risk pooling and risk sharing mechanisms,” he adds. “There’s over US$200 trillion dollars of capital in the world, so there’s obviously enough to efficiently absorb event risk. So, it’s about, how do you get it out into that larger capital base in an efficient way?” While the bond only provides cover for flooding arising from named storms, either due to storm surge or rainfall, it is a “good test case for the ILS market’s appetite for flood risks,” according to ILS blog Artemis. While “it is not a broad flood coverage, it will likely help to make it more palatable to cat bond investors given their comfort with modeling the probability of named storms, tropical storms and hurricanes.” According to Cory Anger, global head of ILS origination and structuring at GC Securities, the ILS market is certainly showing an appetite for flood risk — including inland flood risk — with several catastrophe bonds completed during 2017 for European flood risk (Generali’s Lion II), Japanese flood risk (MSI and ADI’s Akibare Series 2018-1 Notes) and U.S. flood risk. “Both public and private sector entities see value from utilizing capital markets’ capacity to manage flood risk,” she says. “We think there are other geographic regions that would be interested in ILS capacity that haven’t yet tapped the ILS markets. Given the recent success of FEMA/NFIP’s FloodSmart Re Series 2018-1 Notes, we expect FEMA/NFIP to continue to utilize ILS capacity (along with traditional reinsurance capital) to support future U.S. flood risk transfer opportunities.” The ILS sector has grown significantly over the past 15 years, with deals becoming more complex and innovative over time. Many market commentators feel the market was put to the test following the major natural catastrophe losses in 2017. Not only did bonds pay out where they were triggered, fresh capital re-entered, demonstrating investors’ confidence in the sector and its products. “I’m hearing people starting to coin the phrase that 2018 is the ‘great reload,’” says Seo. “This is something I have been saying for quite some years: That the traditional hard-soft, soft-hard market cycle is over. It’s not that you can’t have an event so large that it doesn’t impact the market, but when it comes to capital markets, high yields are actually a siren call for capital. “I don’t think anyone doubts that had 2017 occurred in the absence of the ILS market it would have been a completely different story, and we would have had a traditional hard market scenario in 2018,” he adds. FloodSmart Re has clearly demonstrated the strong investor interest in such transactions. According to Anger, GC Securities acted as the structuring agent for the transaction and was one of two book runners. More than 35 capital markets investors provided fully collateralized protection to FEMA/NFIP on the landmark catastrophe bond. “The appetite for new perils is generally strong, so there’s always strong interest when new risks are brought to market,” says Ben Brookes, managing director of capital and resilience solutions at RMS. He thinks improvements in the underlying data quality along with high-definition flood models make it more likely that inland flood could be included as a peril in future catastrophe bond issuances on behalf of private insurers, on an indemnity basis. “In the early days of the cat bond market, new perils would typically be issued with parametric triggers, because investors were skeptical that sufficient data quality was achieved or that the indemnity risks were adequately captured by cat models. But that changed as investor comfort grew, and a lot of capital entered the market and you saw all these deals becoming indemnity. Increased comfort with risk modeling was a big part of that.” The innovative Blue Wings catastrophe bond, which covered insurer Allianz for severe U.K. flood risk (and some U.S. and Canadian quake) and was completed in 2007, is a good example. The parametric bond used an index to calculate flood depths at over 50 locations across the U.K., was ahead of its time and is the only U.K. flood catastrophe bond that has come to market. According to Anger, as models have become more robust for flood risk — whether due to tropical cyclone (storm surge and excess precipitation) or inland flooding (other than from tropical cyclone) — the investor base has been open to trigger selection (e.g., indemnity or parametric). “In general, insurers are preferring indemnity-triggered solutions,” she adds, “which the ILS market has concurrently been open to. Additionally, for this peril, the ILS community has been open to per occurrence and annual aggregate structures, which gives flexibility to sponsors to incorporate ILS capital in their risk transfer programs.” As the private market develops, cat bond sponsors from the insurance market would be more likely to bundle inland flood risk in with other perils, thinks Charlotte Acton, director of capital and resilience solutions at RMS. “A degree of hurricane-induced inland flood risk is already present on a non-modeled basis within some transactions in the market,” she says. “And Harvey illustrates the value in comprehensive modeling of flooding associated with named storms. “So, for a broader portfolio, in most cases, inland flood would be one piece of the picture as it will be exposed to multiple perils. However, a stand-alone inland flood bond is possible for a public sector or corporate sponsor that has specific exposure to flood risk.” With inland flood, as with all other perils, sophisticated models help to make markets. “A fund would look at the risk in and of itself in the deal, but of course they’d also want to understand the price and returns perspective as well,” says Brookes. “Models play into that quite heavily. You can’t price a bond well, and understand the returns of a bond, unless you understand the risk of it.” As the ILS market makes increasing use of indemnity protection through ultimate net loss (UNL) triggers, sophisticated HD flood modeling will be essential in order to transfer the peril to the capital markets. This allows clear parameters to be set around different hours clauses and deductible structures, for instance, in addition to modeling all causes of flood and the influence of local defenses. “It’s a landmark transaction — the first time in history that the U.S. Federal Government is sponsoring a catastrophe bond” John SEO Fermat capital Jillian Williams, chief underwriting officer at Leadenhall Capital Partners, notes that ILS is increasingly bundling together multiple perils in an effort to gain diversification. “Diversification is important for any investment strategy, as you are always trying to minimize the risk of losing large amounts in one go,” she says. “Cat bonds (144A’s) currently have defined perils, but collateralized reinsurance and private cat bonds can cover all perils. Complexities and flow of information to all parties will be a challenge for cat bonds to move from defined perils to UNL all perils. “Any new peril or structure in a cat bond will generate many questions, even if they don’t have a major impact on the potential losses,” she continues. “Investors will want to know why the issuers want to include these new perils and structures and how the associated risk is calculated. For UNL, all flood (not just sea surge) would be included in the cat bond, so the definition of the peril, its complexities, variables and its correlation to other perils will need to be evaluated and represented in the flood models used.” She thinks the potential to transfer more flood to the capital markets is there, but that the complexity of the peril are challenges that need to be overcome, particularly in the U.S. “Flood coverage is already starting to move into the capital markets, but there are many issues that need to be worked through before it can be moved to a 144A transaction in a UNL format for many territories,” says Williams. “Just one of the complexities is that flood risk may be covered by government pools. “To move flood perils from government pools to private insurers is like any evolution, it can take time, particularly if existing coverage is subsidized,” she adds. “For private insurers, the complexity is not just about flood modeling but also about ensuring risk-adequate pricing and navigating through government legislation.”
