


EXPOSURE
The RMS Magazine with a unique perspective and clear mission “... to provide insight and analysis to help insurance and risk professionals innovate, adapt, and deliver.”

Insurance: The next 10 years
Mohsen Rahnama, Cihan Biyikoglu and Moe Khosravy of RMS look to 2029, consider the…
Times Square, New York City
Tag: PETE DAILEY
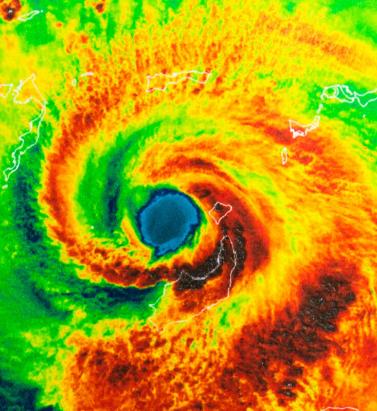
Living in a World of Constant Catastrophes
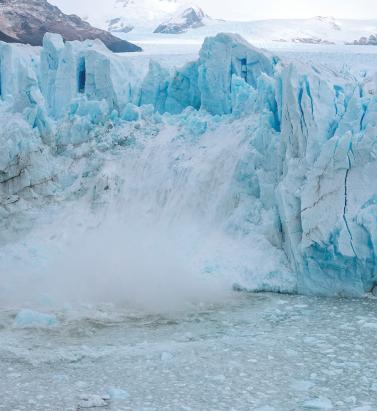
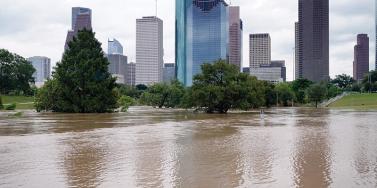
May 20, 2019(Re)insurance companies are waking up to the reality that we are in a riskier world and the prospect of ‘constant catastrophes’ has arrived, with climate change a significant driver In his hotly anticipated annual letter to shareholders in February 2019, Warren Buffett, the CEO of Berkshire Hathaway and acclaimed “Oracle of Omaha,” warned about the prospect of “The Big One” — a major hurricane, earthquake or cyberattack that he predicted would “dwarf Hurricanes Katrina and Michael.” He warned that “when such a mega-catastrophe strikes, we will get our share of the losses and they will be big — very big.” The use of new technology, data and analytics will help us prepare for unpredicted ‘black swan’ events and minimize the catastrophic losses Mohsen Rahnama RMS The question insurance and reinsurance companies need to ask themselves is whether they are prepared for the potential of an intense U.S. landfalling hurricane, a Tōhoku-size earthquake event and a major cyber incident if these types of combined losses hit their portfolio each and every year, says Mohsen Rahnama, chief risk modeling officer at RMS. “We are living in a world of constant catastrophes,” he says. “The risk is changing, and carriers need to make an educated decision about managing the risk. “So how are (re)insurers going to respond to that? The broader perspective should be on managing and diversifying the risk in order to balance your portfolio and survive major claims each year,” he continues. “Technology, data and models can help balance a complex global portfolio across all perils while also finding the areas of opportunity.” A Barrage of Weather Extremes How often, for instance, should insurers and reinsurers expect an extreme weather loss year like 2017 or 2018? The combined insurance losses from natural disasters in 2017 and 2018 according to Swiss Re sigma were US$219 billion, which is the highest-ever total over a two-year period. Hurricanes Harvey, Irma and Maria delivered the costliest hurricane loss for one hurricane season in 2017. Contributing to the total annual insurance loss in 2018 was a combination of natural hazard extremes, including Hurricanes Michael and Florence, Typhoons Jebi, Trami and Mangkhut, as well as heatwaves, droughts, wildfires, floods and convective storms. While it is no surprise that weather extremes like hurricanes and floods occur every year, (re)insurers must remain diligent about how such risks are changing with respect to their unique portfolios. Looking at the trend in U.S. insured losses from 1980–2018, the data clearly shows losses are increasing every year, with climate-related losses being the primary drivers of loss, especially in the last four decades (even allowing for the fact that the completeness of the loss data over the years has improved). Measuring Climate Change With many non-life insurers and reinsurers feeling bombarded by the aggregate losses hitting their portfolios each year, insurance and reinsurance companies have started looking more closely at the impact that climate change is having on their books of business, as the costs associated with weather-related disasters increase. The ability to quantify the impact of climate change risk has improved considerably, both at a macro level and through attribution research, which considers the impact of climate change on the likelihood of individual events. The application of this research will help (re)insurers reserve appropriately and gain more insight as they build diversified books of business. Take Hurricane Harvey as an example. Two independent attribution studies agree that the anthropogenic warming of Earth’s atmosphere made a substantial difference to the storm’s record-breaking rainfall, which inundated Houston, Texas, in August 2017, leading to unprecedented flooding. In a warmer climate, such storms may hold more water volume and move more slowly, both of which lead to heavier rainfall accumulations over land. Attribution studies can also be used to predict the impact of climate change on the return-period of such an event, explains Pete Dailey, vice president of model development at RMS. “You can look at a catastrophic event, like Hurricane Harvey, and estimate its likelihood of recurring from either a hazard or loss point of view. For example, we might estimate that an event like Harvey would recur on average say once every 250 years, but in today’s climate, given the influence of climate change on tropical precipitation and slower moving storms, its likelihood has increased to say a 1-in-100-year event,” he explains. We can observe an incremental rise in sea level annually — it’s something that is happening right in front of our eyes Pete Dailey RMS “This would mean the annual probability of a storm like Harvey recurring has increased more than twofold from 0.4 percent to 1 percent, which to an insurer can have a dramatic effect on their risk management strategy.” Climate change studies can help carriers understand its impact on the frequency and severity of various perils and throw light on correlations between perils and/or regions, explains Dailey. “For a global (re)insurance company with a book of business spanning diverse perils and regions, they want to get a handle on the overall effect of climate change, but they must also pay close attention to the potential impact on correlated events. “For instance, consider the well-known correlation between the hurricane season in the North Atlantic and North Pacific,” he continues. “Active Atlantic seasons are associated with quieter Pacific seasons and vice versa. So, as climate change affects an individual peril, is it also having an impact on activity levels for another peril? Maybe in the same direction or in the opposite direction?” Understanding these “teleconnections” is just as important to an insurer as the more direct relationship of climate to hurricane activity in general, thinks Dailey. “Even though it’s hard to attribute the impact of climate change to a particular location, if we look at the impact on a large book of business, that’s actually easier to do in a scientifically credible way,” he adds. “We can quantify that and put uncertainty around that quantification, thus allowing our clients to develop a robust and objective view of those factors as a part of a holistic risk management approach.” Of course, the influence of climate change is easier to understand and measure for some perils than others. “For example, we can observe an incremental rise in sea level annually — it’s something that is happening right in front of our eyes,” says Dailey. “So, sea-level rise is very tangible in that we can observe the change year over year. And we can also quantify how the rise of sea levels is accelerating over time and then combine that with our hurricane model, measuring the impact of sea-level rise on the risk of coastal storm surge, for instance.” Each peril has a unique risk signature with respect to climate change, explains Dailey. “When it comes to a peril like severe convective storms — tornadoes and hail storms for instance — they are so localized that it’s difficult to attribute climate change to the future likelihood of such an event. But for wildfire risk, there’s high correlation with climate change because the fuel for wildfires is dry vegetation, which in turn is highly influenced by the precipitation cycle.” Satellite data from 1993 through to the present shows there is an upward trend in the rate of sea-level rise, for instance, with the current rate of change averaging about 3.2 millimeters per year. Sea-level rise, combined with increasing exposures at risk near the coastline, means that storm surge losses are likely to increase as sea levels rise more quickly. “In 2010, we estimated the amount of exposure within 1 meter above the sea level, which was US$1 trillion, including power plants, ports, airports and so forth,” says Rahnama. “Ten years later, the exact same exposure was US$2 trillion. This dramatic exposure change reflects the fact that every centimeter of sea-level rise is subjected to a US$2 billion loss due to coastal flooding and storm surge as a result of even small hurricanes. “And it’s not only the climate that is changing,” he adds. “It’s the fact that so much building is taking place along the high-risk coastline. As a result of that, we have created a built-up environment that is actually exposed to much of the risk.” Rahnama highlighted that because of an increase in the frequency and severity of events, it is essential to implement prevention measures by promoting mitigation credits to minimize the risk. He says: “How can the market respond to the significant losses year after year. It is essential to think holistically to manage and transfer the risk to the insurance chain from primary to reinsurance, capital market, ILS, etc.,” he continues. “The art of risk management, lessons learned from past events and use of new technology, data and analytics will help to prepare for responding to unpredicted ‘black swan’ type of events and being able to survive and minimize the catastrophic losses.” Strategically, risk carriers need to understand the influence of climate change whether they are global reinsurers or local primary insurers, particularly as they seek to grow their business and plan for the future. Mergers and acquisitions and/or organic growth into new regions and perils will require an understanding of the risks they are taking on and how these perils might evolve in the future. There is potential for catastrophe models to be used on both sides of the balance sheet as the influence of climate change grows. Dailey points out that many insurance and reinsurance companies invest heavily in real estate assets. “You still need to account for the risk of climate change on the portfolio, whether you’re insuring properties or whether you actually own them, there’s no real difference.” In fact, asset managers are more inclined to a longer-term view of risk when real estate is part of a long-term investment strategy. Here, climate change is becoming a critical part of that strategy. “What we have found is that often the team that handles asset management within a (re)insurance company is an entirely different team to the one that handles catastrophe modeling,” he continues. “But the same modeling tools that we develop at RMS can be applied to both of these problems of managing risk at the enterprise level. “In some cases, a primary insurer may have a one-to-three-year plan, while a major reinsurer may have a five-to-10-year view because they’re looking at a longer risk horizon,” he adds. “Every time I go to speak to a client — whether it be about our U.S. Inland Flood HD Model or our North America Hurricane Models — the question of climate change inevitably comes up. So, it’s become apparent this is no longer an academic question, it’s actually playing into critical business decisions on a daily basis.” Preparing for a Low-carbon Economy Regulation also has an important role in pushing both (re)insurers and large corporates to map and report on the likely impact of climate change on their business, as well as explain what steps they have taken to become more resilient. In the U.K., the Prudential Regulation Authority (PRA) and Bank of England have set out their expectations regarding firms’ approaches to managing the financial risks from climate change. Meanwhile, a survey carried out by the PRA found that 70 percent of U.K. banks recognize the risk climate change poses to their business. Among their concerns are the immediate physical risks to their business models — such as the exposure to mortgages on properties at risk of flood and exposure to countries likely to be impacted by increasing weather extremes. Many have also started to assess how the transition to a low-carbon economy will impact their business models and, in many cases, their investment and growth strategy. “Financial policymakers will not drive the transition to a low-carbon economy, but we will expect our regulated firms to anticipate and manage the risks associated with that transition,” said Bank of England Governor Mark Carney, in a statement. The transition to a low-carbon economy is a reality that (re)insurance industry players will need to prepare for, with the impact already being felt in some markets. In Australia, for instance, there is pressure on financial institutions to withdraw their support from major coal projects. In the aftermath of the Townsville floods in February 2019 and widespread drought across Queensland, there have been renewed calls to boycott plans for Australia’s largest thermal coal mine. To date, 10 of the world’s largest (re)insurers have stated they will not provide property or construction cover for the US$15.5 billion Carmichael mine and rail project. And in its “Mining Risk Review 2018,” broker Willis Towers Watson warned that finding insurance for coal “is likely to become increasingly challenging — especially if North American insurers begin to follow the European lead.”

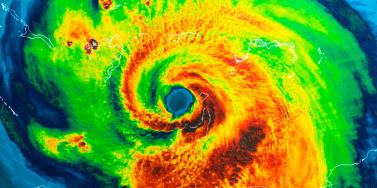
Are We Moving Off The Baseline?
September 05, 2018How is climate change influencing natural perils and weather extremes, and what should reinsurance companies do to respond? Reinsurance companies may feel they are relatively insulated from the immediate effects of climate change on their business, given that most property catastrophe policies are renewed on an annual basis. However, with signs that we are already moving off the historical baseline when it comes to natural perils, there is evidence to suggest that underwriters should already be selectively factoring the influence of climate change into their day-to-day decision-making. Most climate scientists agree that some of the extreme weather anticipated by the United Nations Intergovernmental Panel on Climate Change (IPCC) in 2013 is already here and can be linked to climate change in real time via the burgeoning field of extreme weather attribution. “It’s a new area of science that has grown up in the last 10 to 15 years,” explains Dr. Robert Muir-Wood, chief research officer at RMS. “Scientists run two climate models for the whole globe, both of them starting in 1950. One keeps the atmospheric chemistry static since then, while the other reflects the actual increase in greenhouse gases. By simulating thousands of years of these alternative worlds, we can find the difference in the probability of a particular weather extreme.” “Underwriters should be factoring the influence of climate change into their day-to-day decision-making” For instance, climate scientists have run their models in an effort to determine how much the intensity of the precipitation that caused such devastating flooding during last year’s Hurricane Harvey can be attributed to anthropogenic climate change. Research conducted by scientists at the World Weather Attribution (WWA) project has found that the record rainfall produced by Harvey was at least three times more likely to be due to the influence of global warming. This suggests, for certain perils and geographies, reinsurers need to be considering the implications of an increased potential for certain climate extremes in their underwriting. “If we can’t rely on the long-term baseline, how and where do we modify our perspective?” asks Muir-Wood. “We need to attempt to answer this question peril by peril, region by region and by return period. You cannot generalize and say that all perils are getting worse everywhere, because they’re not. In some countries and perils there is evidence that the changes are already material, and then in many other areas the jury is out and it’s not clear.” Keeping Pace With the Change While the last IPCC Assessment Report (AR5) was published in 2014 (the next is due in 2021), there is some consensus on how climate change is beginning to influence natural perils and climate extremes. Many regional climates naturally have large variations at interannual and even interdecadal timescales, which makes observation of climate change, and validation of predictions, more difficult. “There is always going to be uncertainty when it comes to climate change,” emphasizes Swenja Surminski, head of adaptation research at the Grantham Research Institute on Climate Change and the Environment, part of the London School of Economics and Political Science (LSE). “But when you look at the scientific evidence, it’s very clear what’s happening to temperature, how the average temperature is increasing, and the impact that this can have on fundamental things, including extreme events.” According to the World Economic Forum’s Global Risks Report in 2018, “Too little has been done to mitigate climate change and … our own analysis shows that the likelihood of missing the Paris Agreement target of limiting global warming to two degrees Celsius or below is greater than the likelihood of achieving it.” The report cites extreme weather events and natural disasters as the top two “most likely” risks to happen in the next 10 years and the second- and third-highest risks (in the same order) to have the “biggest impact” over the next decade, after weapons of mass destruction. The failure of climate change mitigation and adaptation is also ranked in the top five for both likelihood and impact. It notes that 2017 was among the three hottest years on record and the hottest ever without an El Niño. It is clear that climate change is already exacerbating climate extremes, says Surminski, causing dry regions to become drier and hot regions to become hotter. “By now, based on our scientific understanding and also thanks to modeling, we get a much better picture of what our current exposure is and how that might be changing over the next 10, 20, even 50 to 100 years,” she says. “There is also an expectation we will have more freak events, when suddenly the weather produces really unexpected, very unusual phenomena,” she continues. “That’s not just climate change. It’s also tied into El Niño and other weather phenomena occurring, so it’s a complex mix. But right now, we’re in a much better position to understand what’s going on and to appreciate that climate change is having an impact.” Pricing for Climate Change For insurance and reinsurance underwriters, the challenge is to understand the extent to which we have already deviated from the historical record and to manage and price for that appropriately. It is not an easy task given the inherent variability in existing weather patterns, according to Andy Bord, CEO of Flood Re, the U.K.’s flood risk pool, which has a panel of international reinsurers. “The existing models are calibrated against data that already includes at least some of the impact of climate change,” he says. “Some model vendors have also recently produced models that aim to assess the impact of climate change on the future level of flood risk in the U.K. We know at least one larger reinsurer has undertaken their own climate change impact analyses. “We view improving the understanding of the potential variability of weather given today’s climate as being the immediate challenge for the insurance industry, given the relatively short-term view of markets,” he adds. The need for underwriters to appreciate the extent to which we may have already moved off the historical baseline is compounded by the conflicting evidence on how climate change is influencing different perils. And by the counterinfluence or confluence, in many cases, of naturally occurring climate patterns, such as El Niño and the Atlantic Multidecadal Oscillation (AMO). The past two decades have seen below-normal European windstorm activity, for instance, and evidence builds that the unprecedented reduction in Arctic sea ice during the autumn months is the main cause, according to Dr. Stephen Cusack, director of model development at RMS. “In turn, the sea ice declines have been driven both by the ‘polar amplification’ aspect of anthropogenic climate change and the positive phase of the AMO over the past two decades, though their relative roles are uncertain. “We view improving the understanding of the potential variability of weather given today’s climate as being the immediate challenge for the insurance industry, given the relatively short-term view of markets” Andy Bord Flood Re “The (re)insurance market right now is saying, ‘Your model has higher losses than our recent experience.’ And what we are saying is that the recent lull is not well understood, and we are unsure how long it will last. Though for pricing future risk, the question is when, and not if, the rebound in European windstorm activity happens. Regarding anthropogenic climate change, other mechanisms will strengthen and counter the currently dominant ‘polar amplification’ process. Also, the AMO goes into positive and negative phases,” he continues. “It’s been positive for the last 20 to 25 years and that’s likely to change within the next decade or so.” And while European windstorm activity has been somewhat muted by the AMO, the same cannot be said for North Atlantic hurricane activity. Hurricanes Harvey, Irma and Maria (HIM) caused an estimated US$92 billion in insured losses, making 2017 the second costliest North Atlantic hurricane season, according to Swiss Re Sigma. “The North Atlantic seems to remain in an active phase of hurricane activity, irrespective of climate change influences that may come on top of it,” the study states. While individual storms are never caused by one factor alone, stressed the Sigma study, “Some of the characteristics observed in HIM are those predicted to occur more frequently in a warmer world.” In particular, it notes the high level of rainfall over Houston and hurricane intensification. While storm surge was only a marginal contributor to the losses from Hurricane Harvey, Swiss Re anticipates the probability of extreme storm surge damage in the northeastern U.S. due to higher seas will almost double in the next 40 years. “From a hurricane perspective, we can talk about the frequency of hurricanes in a given year related to the long-term average, but what’s important from the climate change point of view is that the frequency and the intensity on both sides of the distribution are increasing,” says Dr. Pete Dailey, vice president at RMS. “This means there’s more likelihood of quiet years and more likelihood of very active years, so you’re moving away from the mean, which is another way of thinking about moving away from the baseline. “So, we need to make sure that we are modeling the tail of the distribution really well, and that we’re capturing the really wet years — the years where there’s a higher frequency of torrential rain in association with events that we model.” The Edge of Insurability Over the long term, the industry likely will be increasingly insuring the impact of anthropogenic climate change. One question is whether we will see “no-go” areas in the future, where the risk is simply too high for insurance and reinsurance companies to take on. As Robert Muir-Wood of RMS explains, there is often a tension between the need for (re)insurers to charge an accurate price for the risk and the political pressure to ensure cover remains available and affordable. He cites the community at Queen’s Cove in Grand Bahama, where homes were unable to secure insurance given the repeated storm surge flood losses they have sustained over the years from a number of hurricanes. Unable to maintain a mortgage without insurance, properties were left to fall into disrepair. “Natural selection came up with a solution,” says Muir-Wood, whereby some homeowners elevated buildings on concrete stilts thereby making them once again insurable. “In high-income, flood-prone countries, such as Holland, there has been sustained investment in excellent flood defenses,” he says. “The challenge in developing countries is there may not be the money or the political will to build adequate flood walls. In a coastal city like Jakarta, Indonesia, where the land is sinking as a result of pumping out the groundwater, it’s a huge challenge. “It’s not black and white as to when it becomes untenable to live somewhere. People will find a way of responding to increased incidence of flooding. They may simply move their life up a level, as already happens in Venice, but insurability will be a key factor and accommodating the changes in flood hazard is going to be a shared challenge in coastal areas everywhere.” Political pressure to maintain affordable catastrophe insurance was a major driver of the U.S. residual market, with state-backed Fair Access to Insurance Requirements (FAIR) plans providing basic property insurance for homes that are highly exposed to natural catastrophes. Examples include the California Earthquake Association, Texas Windstorm Insurance Association and Florida Citizens Property Insurance Corporation (and state reinsurer, the FHCF). However, the financial woes experienced by FEMA’s National Flood Insurance Program (NFIP), currently the principal provider of residential flood insurance in the U.S., demonstrates the difficulties such programs face in terms of being sustainable over the long term. With the U.K.’s Flood Re scheme, investment in disaster mitigation is a big part of the solution, explains CEO Andy Bord. However, even then he acknowledges that “for some homes at the very greatest risk of flooding, the necessary investment needed to reduce risks and costs would simply be uneconomic.”
Assigning a Return Period to 2017
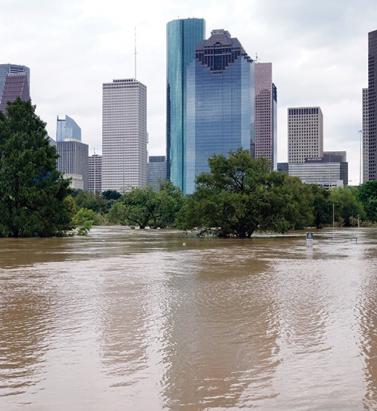
May 11, 2018Hurricanes Harvey, Irma and Maria (HIM) tore through the Caribbean and U.S. in 2017, resulting in insured losses over US$80 billion. Twelve years after Hurricanes Katrina, Rita and Wilma (KRW), EXPOSURE asks if the (re)insurance industry was better prepared for its next ‘terrible trio’ and what lessons can be learned In one sense, 2017 was a typical loss year for the insurance industry in that the majority of losses stemmed from the “peak zone” of U.S. hurricanes. However, not since the 2004-05 season had the U.S. witnessed so many landfalling hurricanes. It was the second most costly hurricane season on record for the (re)insurance industry, when losses in 2005 are adjusted for inflation. According to Aon Benfield, HIM caused total losses over US$220 billion and insured losses over US$80 billion — huge sums in the context of global catastrophe losses for the year of US$344 billion and insured losses of US$134 billion. Overall, weather-related catastrophe losses exceeded 0.4 percent of global GDP in 2017 (based on data from Aon Benfield, Munich Re and the World Bank), the second highest figure since 1990. In that period, only 2005 saw a higher relative catastrophe loss at around 0.5 percent of GDP. But, it seems, (re)insurers were much better prepared to absorb major losses this time around. Much has changed in the 12 years since Hurricane Katrina breached the levees in New Orleans. Catastrophe modeling as a profession has evolved into exposure management, models and underlying data have improved and there is a much greater appreciation of model uncertainty and assumptions, explains Alan Godfrey, head of exposure management at Asta. “Even post-2005 people would still see an event occurring, go to the models and pull out a single event ID … then tell all and sundry this is what we’re going to lose. And that’s an enormous misinterpretation of how the models are supposed to be used. In 2017, people demonstrated a much greater maturity and used the models to advise their own loss estimates, and not the other way around.” It also helped that the industry was extremely well-capitalized moving into 2017. After a decade of operating through a low interest rate and increasingly competitive environment, (re)insurers had taken a highly disciplined approach to capital management. Gone are the days where a major event sparked a series of run-offs. While some (re)insurers have reported higher losses than others, all have emerged intact. “In 2017 the industry has performed incredibly well from an operational point of view,” says Godfrey. “There have obviously been challenges from large losses and recovering capital, but those are almost outside of exposure management.” According to Aon Benfield, global reinsurance capacity grew by 80 percent between 1990 and 2017 (to US$605 billion), against global GDP growth of around 24 percent. The influx of capacity from the capital markets into U.S. property catastrophe reinsurance has also brought about change and innovation, offering new instruments such as catastrophe bonds for transferring extreme risks. Harvey broke all U.S. records for tropical cyclone-driven rainfall with observed cumulative rainfall of 51 inches Much of this growth in non-traditional capacity has been facilitated by better data and more sophisticated analytics, along with a healthy appetite for insurance risk from pension funds and other institutional investors. For insurance-linked securities (ILS), the 2017 North Atlantic hurricane season, Mexico’s earthquakes and California’s wildfires were their first big test. “Some thought that once we had a significant year that capital would leave the market,” says John Huff, president and chief executive of the Association of Bermuda Insurers and Reinsurance (ABIR). “And we didn’t see that. “In January 2018 we saw that capital being reloaded,” he continues. “There is abundant capital in all parts of the reinsurance market. Deploying that capital with a reasonable rate of return is, of course, the objective.” Huff thinks the industry performed extremely well in 2017 in spite of the severity of the losses and a few surprises. “I’ve even heard of reinsurers that were ready with claim payments on lower layers before the storm even hit. The modeling and ability to track the weather is getting more sophisticated. We saw some shifting of the storms — Irma was the best example — but reinsurers were tracking that in real time in order to be able to respond.” The Buffalo Bayou River floods a park in Houston after the arrival of Hurricane Harvey How Harvey Inundated Houston One lesson the industry has learned over three decades of modeling is that models are approximations of reality. Each event has its own unique characteristics, some of which fall outside of what is anticipated by the models. The widespread inland flooding that occurred after Hurricane Harvey made landfall on the Texas coastline is an important illustration of this, explains Huff. Even so, he adds, it continued a theme, with flood losses being a major driver of U.S. catastrophe claims for several years now. “What we’re seeing is flood events becoming the No. 1 natural disaster in the U.S. for people who never thought they were at risk of flood.” Harvey broke all U.S. records for tropical cyclone-driven rainfall with observed cumulative rainfall of 51 inches (129 centimeters). The extreme rainfall generated by Harvey and the unprecedented inland flooding across southeastern Texas and parts of southern Louisiana was unusual. However, nobody was overly surprised by the fact that losses from Harvey were largely driven by water versus wind. Prior events with significant storm surge-induced flooding, including Hurricane Katrina and 2012’s Superstorm Sandy, had helped to prepare (re)insurers, exposure managers and modelers for this eventuality. “The events themselves were very large but they were well within uncertainty ranges and not disproportionate to expectations,” says Godfrey. “Harvey is a new data point — and we don’t have that many — so the scientists will look at it and know that any new data point will lead to tweaks,” he continues. “If anything, it will make people spend a bit more time on their calibration for the non-modeled elements of hurricane losses, and some may conclude that big changes are needed to their own adjustments.” But, he adds: “Nobody is surprised by the fact that flooding post-hurricane causes loss. We know that now. It’s more a case of tweaking and calibrating, which we will be doing for the rest of our lives.” Flood Modeling Hurricane Harvey also underscored the importance of the investment in sophisticated, probabilistic flood models. RMS ran its U.S. Inland Flood HD Model in real time to estimate expected flood losses. “When Hurricane Harvey happened, we had already simulated losses of that magnitude in our flood model, even before the event occurred,” says Dr. Pete Dailey, vice president of product management and responsible for U.S. flood modeling at RMS. “The value of the model is to be able to anticipate extreme tail events well before they occur, so that insurance companies can be prepared in advance for the kind of risk they’re taking on and what potential claims volume they may have after a major event,” he adds. Does this mean that a US$100 billion-plus loss year like 2017 is now a 1-in-6-year event? Harvey has already offered a wealth of new data that will be fed into the flood model. The emergency shutdown of the Houston metropolitan area prevented RMS meteorologists and engineers from accessing the scene in the immediate aftermath, explains Dailey. However, once on the ground they gathered as much information as they could, observing and recording what had actually happened to affected properties. “We go to individual properties to assess the damage visually, record the latitude and longitude of the property, the street address, the construction, occupancy and the number of stories,” he says. “We will also make an estimate of the age of the property. Those basic parameters allow us to go back and take a look at what the model would have predicted in terms of damage and loss, as compared to what we observed.” The fact that insured losses emanating from the flooding were only a fraction of the total economic losses is an inevitable discussion point. The majority of claims paid were for commercial properties, with residential properties falling under the remit of the National Flood Insurance Program (NFIP). Many residential homes were uninsured, however, explains ABIR’s Huff. “The NFIP covers just the smallest amount of people — there are only five million policies — and yet you see a substantial event like Harvey which is largely uninsured because (re)insurance companies only cover commercial flood in the U.S.,” he says. “After Harvey you’ll see a realization that the private market is very well-equipped to get back into the private flood business, and there’s a national dialogue going on now.” Is 2017 the New Normal? One question being asked in the aftermath of the 2017 hurricane season is: What is the return period for a loss year like 2017? RMS estimates that, in terms of U.S. and Caribbean industry insured wind, storm surge and flood losses, the 2017 hurricane season corresponds to a return period between 15 and 30 years. However, losses on the scale of 2017 occur more frequently when considering global perils. Adjusted for inflation, it is seven years since the industry paid out a similar level of catastrophe claims — US$110 billion on the Tohoku earthquake and tsunami, Thai floods and New Zealand earthquake in 2011. Six years prior to that, KRW cost the industry in excess of US$75 billion (well over US$100 billion in today’s money). So, does this mean that a US$100 billion-plus (or equivalent in inflation-adjusted terms) loss year like 2017 is now a one-in-six-year event? As wealth and insurance penetration grows in developing parts of the world, will we begin to see more loss years like 2011, where catastrophe claims are not necessarily driven by the U.S. or Japan peak zones? “Increased insurance penetration does mean that on the whole losses will increase, but hopefully this is proportional to the premiums and capital that we are getting in,” says Asta’s Godfray. “The important thing is understanding correlations and how diversification actually works and making sure that is applied within business models. “In the past, people were able to get away with focusing on the world in a relatively binary fashion,” he continues. “The more people move toward diversified books of business, which is excellent for efficient use of capital, the more important it becomes to understand the correlations between different regions.” “You could imagine in the future, a (re)insurer making a mistake with a very sophisticated set of catastrophe and actuarial models,” he adds. “They may perfectly take into account all of the non-modeled elements but get the correlations between them all wrong, ending up with another year like 2011 where the losses across the globe are evenly split, affecting them far more than their models had predicted.” As macro trends including population growth, increasing wealth, climate change and urbanization influence likely losses from natural catastrophes, could this mean a shorter return period for years like last year, where industry losses exceeded US$134 billion? “When we look at the average value of properties along the U.S. coastline — the Gulf Coast and East Coast — there’s a noticeable trend of increasing value at risk,” says Dailey. “That is because people are building in places that are at risk of wind damage from hurricanes and coastal flooding. And these properties are of a higher value because they are more complex, have a larger square footage and have more stories. Which all leads to a higher total insured value. “The second trend that we see would be from climate change whereby the storms that produce damage along the coastline may be increasing in frequency and intensity,” he continues. “That’s a more difficult question to get a handle on but there’s a building consensus that while the frequency of hurricane landfalls may not necessarily be increasing, those that do make landfall are increasing in intensity.” Lloyd’s chief executive Inga Beale has stated her concerns about the impact of climate change, following the market’s £4.5 billion catastrophe claims bill for 2017. “That’s a significant number, more than double 2016; we’re seeing the impact of climate change to a certain extent, particularly on these weather losses, with the rising sea level that impacts and increases the amount of loss,” she said in an interview with Bloomberg. While a warming climate is expected to have significant implications for the level of losses arising from storms and other severe weather events, it is not yet clear exactly how this will manifest, according to Tom Sabbatelli, senior product manager at RMS. “We know the waters have risen several centimeters in the last couple of decades and we can use catastrophe models to quantify what sort of impact that has on coastal flooding, but it’s also unclear what that necessarily means for tropical cyclone strength. “The oceans may be warming, but there’s still an ongoing debate about how that translates into cyclone intensity, and that’s been going on for a long time,” he continues. “The reason for that is we just don’t know until we have the benefit of hindsight. We haven’t had a number of major hurricanes in the last few years, so does that mean that the current climate is quiet in the Atlantic? Is 2017 an anomaly or are we going back to more regular severe activity? It’s not until you’re ten or 20 years down the line and you look back that you know for sure.”

Breaching the Flood Insurance Barrier
September 04, 2017With many short-term reauthorizations of the National Flood Insurance Program, EXPOSURE considers how the private insurance market can bolster its presence in the U.S. flood arena and overcome some of the challenges it faces. According to Federal Emergency Management Agency (FEMA), as of June 30, 2017, the National Flood Insurance Program (NFIP) had around five million policies in force, representing a total in-force written premium exceeding US$3.5 billion and an overall exposure of about US$1.25 trillion. Florida alone accounts for over a third of those policies, with over 1.7 million in force in the state, representing premiums of just under US$1 billion. However, with the RMS Exposure Source Database estimating approximately 85 million residential properties alone in the U.S., the NFIP only encompasses a small fraction of the overall number of properties exposed to flood, considering floods can occur throughout the country. Factors limiting the reach of the program have been well documented: the restrictive scope of NFIP policies, the fact that mandatory coverage applies only to special flood hazard plains, the challenges involved in securing elevation certificates, the cost and resource demands of conducting on-site inspections, the poor claims performance of the NFIP, and perhaps most significant the refusal by many property owners to recognize the threat posed by flooding. At the time of writing, the NFIP is once again being put to the test as Hurricane Harvey generates catastrophic floods across Texas. As the affected regions battle against these unprecedented conditions, it is highly likely that the resulting major losses will add further impetus to the push for a more substantive private flood insurance market. The Private Market Potential While the private insurance sector shoulders some of the flood coverage, it is a drop in the ocean, with RMS estimating the number of private flood policies to be around 200,000. According to Dan Alpay, line underwriter for flood and household at Hiscox London Market, private insurers represent around US$300 to US$400 million of premium — although he adds that much of this is in “big- ticket policies” where flood has been included as part of an all-risks policy. “In terms of stand-alone flood policies,” he says, “the private market probably only represents about US$100 million in premiums — much of which has been generated in the last few years, with the opening up of the flood market following the introduction of the Biggert-Waters Flood Insurance Reform Act of 2012 and the Homeowner Flood Insurance Affordability Act of 2014.” But it is clear therefore that the U.S. flood market represents one of the largest untapped insurance opportunities in the developed world, with trillions of dollars of property value at risk across the country. “It is extremely rare to have such a huge potential market like this,” says Alpay, “and we are not talking about a risk that the market does not understand. It is U.S. catastrophe business, which is a sector that the private market has extensive experience in. And while most insurers have not provided specific cover for U.S. flood before, they have been providing flood policies in many other countries for many years, so have a clear understanding of the peril characteristics. And I would also say that much of the experience gained on the U.S. wind side is transferable to the flood sector.” Yet while the potential may be colossal, the barriers to entry are also significant. First and foremost, there is the challenge of going head-to-head with the NFIP itself. While there is concerted effort on the part of the U.S. government to facilitate a greater private insurer presence in the flood market as part of its reauthorization, the program has presided over the sector for almost 50 years and competing for those policies will be no easy task. “The main problem is changing consumer behavior,” believes Alpay. “How do we get consumers who have been buying policies through the NFIP since 1968 to appreciate the value of a private market product and trust that it will pay out in the event of a loss? While you may be able to offer a product that on paper is much more comprehensive and provides a better deal for the insured, many will still view it as risky given their inherent trust in the government.” For many companies, the aim is not to compete with the program, but rather to source opportunities beyond the flood zones, accessing the potential that exists outside of the mandatory purchase requirements. But to do this, property owners who are currently not located in these zones need to understand that they are actually in an at-risk area and need to consider purchasing flood cover. This can be particularly challenging in locations where homeowners have never experienced a damaging flood event. Another market opportunity lies in providing coverage for large industrial facilities and high-value commercial properties, according to Pete Dailey, vice president of product management at RMS. “Many businesses already purchase NFIP policies,” he explains, “in fact those with federally insured mortgages and locations in high-risk flood zones are required to do so. “However,” he continues, “most businesses with low-to-moderate flood risk are unaware that their business policy excludes flood damage to the building, its contents and losses due to business interruption. Even those with NFIP coverage have a US$500,000 limit and could benefit from an excess policy. Insurers eager to expand their books by offering new product options to the commercial lines will facilitate further expansion of the private market.” Assessing the Flood Level But to be able to effectively target this market, insurers must first be able to ascertain what the flood exposure levels really are. The current FEMA flood mapping database spans 20,000 individual plains. However, much of this data is out of date, reflecting limited resources, which, coupled with a lack of consistency in how areas have been mapped using different contractors, means their risk assessment value is severely limited. While a proposal to use private flood mapping studies instead of FEMA maps is being considered, the basic process of maintaining flood plain data is an immense problem given the scale. With the U.S. exposed to flood in virtually every location, this makes it a high-resolution peril, meaning there is a long list of attributes and inter-dependent dynamic factors influencing what flood risk in a particular area might be. With 100 years of scientific research, the physics of flooding itself is well understood, the issue has been generating the data and creating the model at sufficient resolution to encompass all of the relevant factors from an insurance perspective. In fact, to manage the scope of the data required to release the RMS U.S. Flood Hazard Maps for a small number of return periods required the firm to build a supercomputer, capitalizing on immense Cloud-based technology to store and manage the colossal streams of information effectively. With such data now available, insurers are in a much better position to generate functional underwriting maps – FEMA maps were never drawn up for underwriting purposes. The new hazard maps provide actual gradient and depth of flooding data, to get away from the ‘in’ or ‘out’ discussion, allowing insurers to provide detail, such as if a property is exposed to two to three feet of flooding at a 1-in-100 return period. No Clear Picture Another hindrance to establishing a clear flood picture is the lack of a systematic database of the country’s flood defense network. RMS estimates that the total network encompasses some 100,000 miles of flood defenses; however, FEMA’s levy network accounts for approximately only 10 percent of this. Without the ability to model existing flood defenses accurately, higher frequency, lower risk events are overestimated. To help counter this lack of defense data, RMS developed the capability within its U.S. Inland Flood HD Model to identify the likelihood of such measures being present and, in turn, assess the potential protection levels. Data shortage is also limiting the potential product spectrum. If an insurer is not able to demonstrate to a ratings agency or regulator what the relationship between different sources of flood risk (such as storm surge and river flooding) is for a given portfolio, then it could reduce the range of flood products they can offer. Insurers also need the tools and the data to differentiate the more complicated financial relationships, exclusions and coverage options relative to the nature of the events that could occur. Launching into the Sector In May 2016, Hiscox London Market launched its FloodPlus product into the U.S. homeowners sector, following the deregulation of the market. Distributed through wholesale brokers in the U.S., the policy is designed to offer higher limits and a wider scope than the NFIP. “We initially based our product on the NFIP policy with slightly greater coverage,” Alpay explains, “but we soon realized that to firmly establish ourselves in the market we had to deliver a policy of sufficient value to encourage consumers to shift from the NFIP to the private market. “As we were building the product and setting the limits,” he continues, “we also looked at how to price it effectively given the lack of granular flood information. We sourced a lot of data from external vendors in addition to proprietary modeling which we developed ourselves, which enabled us to build our own pricing system. What that enabled us to do was to reduce the process time involved in buying and activating a policy from up to 30 days under the NFIP system to a matter of minutes under FloodPlus.” This sort of competitive edge will help incentivize NFIP policyholders to make a switch. “We also conducted extensive market research through our coverholders,” he adds, “speaking to agents operating within the NFIP system to establish what worked and what didn’t, as well as how claims were handled.” “We soon realized that to firmly establish ourselves … we had to deliver a policy of sufficient value to encourage consumers to shift from the NFIP to the private market” Dan Alpay Hiscox London Market Since launch, the product has been amended on three occasions in response to customer demand. “For example, initially the product offered actual cash value on contents in line with the NFIP product,” he adds. “However, after some agent feedback, we got comfortable with the idea of providing replacement cost settlement, and we were able to introduce this as an additional option which has proved successful.” To date, coverholder demand for the product has outstripped supply, he says. “For the process to work efficiently, we have to integrate the FloodPlus system into the coverholder’s document issuance system. So, given the IT integration process involved plus the education regarding the benefits of the product, it can’t be introduced too quickly if it is to be done properly.” Nevertheless, growing recognition of the risk and the need for coverage is encouraging to those seeking entry into this emerging market. A Market in the Making The development of a private U.S. flood insurance market is still in its infancy, but the wave of momentum is building. Lack of relevant data, particularly in relation to loss history, is certainly dampening the private sector’s ability to gain market traction. However, as more data becomes available, modeling capabilities improve, and insurer products gain consumer trust by demonstrating their value in the midst of a flood event, the market’s potential will really begin to flow. “Most private insurers,” concludes Alpay, “are looking at the U.S. flood market as a great opportunity to innovate, to deliver better products than those currently available, and ultimately to give the average consumer more coverage options than they have today, creating an environment better for everyone involved.” The same can be said for the commercial and industrial lines of business where stakeholders are actively searching for cost savings and improved risk management. Climate Complications As the private flood market emerges, so too does the debate over how flood risk will adjust to a changing climate. “The consensus today among climate scientists is that climate change is real and that global temperatures are indeed on the rise,” says Pete Dailey, vice president of product management at RMS. “Since warmer air holds more moisture, the natural conclusion is that flood events will become more common and more severe. Unfortunately, precipitation is not expected to increase uniformly in time or space, making it difficult to predict where flood risk would change in a dramatic way.” Further, there are competing factors that make the picture uncertain. “For example,” he explains, “a warmer environment can lead to reduced winter snowpack, and, in turn, reduced springtime melting. Thus, in regions susceptible to springtime flooding, holding all else constant, warming could potentially lead to reduced flood losses.” For insurers, these complications can make risk selection and portfolio management more complex. “While the financial implications of climate change are uncertain,” he concludes, “insurers and catastrophe modelers will surely benefit from climate change research and byproducts like better flood hazard data, higher resolution modeling and improved analytics being developed by the climate science community.”
