


EXPOSURE
The RMS Magazine with a unique perspective and clear mission “... to provide insight and analysis to help insurance and risk professionals innovate, adapt, and deliver.”

Insurance: The next 10 years
Mohsen Rahnama, Cihan Biyikoglu and Moe Khosravy of RMS look to 2029, consider the…
Times Square, New York City
Tag: Hurricane
Can the Florida Insurance Market Withstand a US$100 Billion Repeat of Hurricane Andrew?
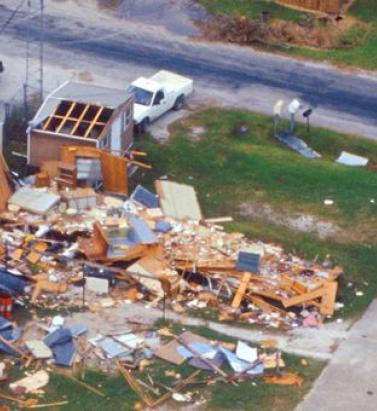
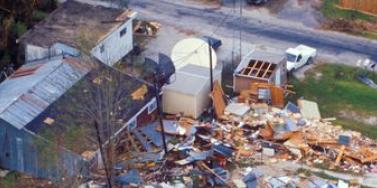
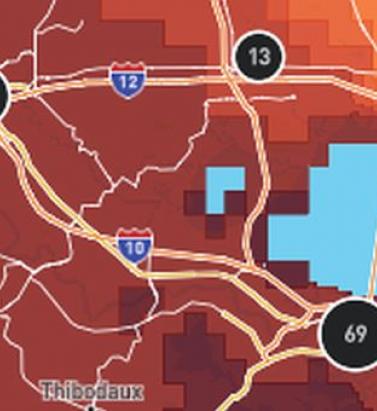
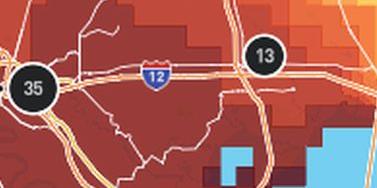
August 23, 2022Hurricane Andrew’s landfall in Florida in 1992 changed the face of property catastrophe insurance and kick-started many new initiatives, including the development of hurricane risk modeling. However, with significant exposure growth, the impact of social inflation, and climate change complications, the insurance market could struggle to respond to a repeat of Andrew. The wide-ranging impact of Hurricane Andrew on the Florida insurance market is a familiar story within the risk management world. However, 30 years on from August 24, 1992, when Andrew made landfall in Dade County, Florida, memories appear to be getting shorter, as the insurance industry once more seems to be in danger of underestimating its exposure to a Category 5 storm hitting the state. Image from the GOES-7 satellite shows Hurricane Andrew at its peak intensity on August 23, 1992, before making landfall near Homestead, Florida. Image source: NOAAWhen Hurricane Andrew came ashore as the first named tropical storm of the 1992 North Atlantic hurricane season, it followed a seven-year hiatus in major hurricane activity in Florida. Industry predictions at the time were that it would cost insurers around US$4 billion to US$5 billion, but Andrew ended up costing the insurance industry US$15 billion (in 1992 values) for Florida claims, and it caused the deaths of 44 people in the state. Following Hurricane Andrew, more than 650,000 claims were filed, leaving eight insurers becoming insolvent and a further three driven into insolvency the following year. Fast forward to today, and RMS® predictions for a repeat of Andrew would see the insured loss for wind and surge in the range of US$80 billion (GR) and US$90 billion (GU), in which other non-modeled losses and social inflation could lead to a US$100 billion event. Aftermath of Andrew The losses from Hurricane Andrew vindicated the need for catastrophe modeling solutions including the use of multiple simulated storms beyond those previously experienced in history. Catastrophe models enabled the new Bermuda reinsurance market: eight new reinsurers were established without the need for their own historical experience. In time, catastrophe models would enable the creation of insurance-linked securities such as catastrophe bonds, to tap into capital markets for alternatives to reinsurance. Without Hurricane Andrew, it might have taken much longer for this revolution to happen. The crisis caused by Andrew certainly precipitated some rapid and innovative changes to help manage a much larger hurricane risk cost than previously recognized, allowing the market to prepare for the hyperactive Florida hurricane seasons of 2004 and 2005. However, the following years were unusually quiet for intense storms landfalling in Florida, encouraging actions that further raised insurers’ hurricane risk costs. Among these was the 25 percent roof replacement rule in 2007, which mandated that if 25 percent or more of a roof is ‘repaired, replaced or recovered’ in any 12-month period, then the entire roofing system or roof section must be brought up to the latest building code. “Until the hurricanes returned with a vengeance in 2017,” says Peter Datin, senior director of modeling at RMS, “the significant additional cost imposed on insurers due to this code update was not clear.” Development of Hurricane Modeling Before Hurricane Andrew, exposure mapping by the insurance industry involved tracking premiums at a fairly coarse ‘Cresta Zone’ resolution. Post-Andrew, as modelers provided insurers with the ability to model exposures at a finer scale, insurers recognized how higher resolution data could provide a more accurate assessment of risk. RMS released its first hurricane model in 1993. Since then, there have been many updates and innovations, from basin-wide stochastic tracks, coupled ocean-atmosphere storm surge modeling, and significant enhancements in damage assessment modeling. After Hurricane Katrina in 2005, Robert Muir-Wood, chief research officer at RMS, coined the term ‘post-event loss amplification’ (PLA) to cover all processes that can raise losses after a major catastrophe, such as demand surge and claims inflation. Auguste Boissonnade, vice president of model development at RMS, who designed the first RMS hurricane model, worked on how to quantify these different factors in generating the overall insurance loss after cat events. Hurricane Katrina floodingFor the most extreme catastrophes, when damage requires the long-term evacuation of large parts of a city, the definition of a “super catastrophe” (or “super-cat”) event applies, where secondary consequences can be a significant component of the original damage. The flooding of New Orleans after Hurricane Katrina was such a super-cat. “With the hurricane catastrophes of 2004 and 2005 came the realization that cat loss models needed to allow for undervaluation of insured exposures as well as the secondary impact of economic, social, and political factors that could amplify the losses,” Boissonnade says. After major hurricanes, RMS vulnerability modelers review lessons that can be learned from the events and the resulting claims data. “Through claims analyses, it has been possible to quantify the degree to which changes in wind design codes have reduced damage and losses to buildings and incorporate those learnings into cat models,” added Datin. Current Market Dynamics The average cost of an annual homeowner’s policy in Florida is expected to soar to US$4,231 this year, almost three times the U.S. annual average, according to the Insurance Information Institute. Five Florida market insurers have already gone insolvent so far in 2022, faced with rising claims costs and increased costs for reinsurance. Meanwhile, the number of policies written by Citizens, a post-Andrew creation, has risen to over a million, as insurers have either gone insolvent, withdrawn capacity from the market, or had their ratings downgraded, making it harder for insureds to secure coverage that will meet their mortgage lenders’ approval. In July 2022, rating agency Demotech wrote to 17 insurers warning them they could be downgraded from A (exceptional) to S (substantial) or M (moderate), potentially impacting millions of policyholders whose mortgage providers demand home insurance from the strongest-rated carriers. Florida legislators then looked to circumvent the use of Demotech ratings with a new stopgap measure, where Citizens take on a reinsurance role to pay claims for insolvent insurers. At the same time, insurers are struggling to secure reinsurance capacity, and Citizens only managed to get a third of its desired reinsurance cover, making it harder for carriers to deploy sufficient capacity to meet the demand for hurricane coverage. There has also been a huge increase in the volume of catastrophe claims in recent years, driven by social inflation and undervaluation of exposures. Likely Impact of Andrew Now “Our prediction that a repeat of Andrew today could cause as much as US$100 billion in insured losses is based in large part on changes in exposure and population since 1992, coupled with updated predictions of the impact of wind and storm surge, with significant anticipated post-event loss amplification. Together these components reveal a more complete picture of potential economic and insured losses,” says Mohsen Rahnama, chief risk modeling officer at RMS. Combined wind and surge losses for a repeat of Hurricane Andrew are estimated at US$87 billion. Post-event loss amplification, whether it is from a slow recovery, supply chain issues from COVID-19, or current inflationary trends, could take the ultimate loss closer to US$100 billion. The impact of storm surge, particularly with the climate change-related rise in sea levels, is also more pronounced now compared to estimates at the time of Andrew. South Florida property developmentAdded to this is the significant demographic shift in Florida. As of this year, the population of Florida is estimated at over 22 million – a 61 percent increase from the number of people in 1992. Building counts in Andrew’s wind and surge footprints have increased by 40 percent to 1.9 million and by 32 percent to 55,000 respectively. Economic exposure has also increased by 77 percent in the wind footprint and 67 percent in the surge footprint. And in Miami-Dade County, the number of high-rise buildings that are over 15 stories has tripled since 1992, many of which are now potentially in Andrew’s surge footprint. “While the wind was the main driver of loss in 1992, the number of new, high-valued buildings near the coast suggests that storm surge losses may play an increasing role in a repeat of this event,” says Rahnama. In constant-dollar terms, economic exposure has grown substantially within both Andrew’s wind and surge footprints, based on an analysis of the total built floor area (see Figure 1). On top of this, cost inflation since 1992 has been substantial, with replacement costs in Florida estimated to have increased between two times and 2.5 times since 1992, based on historical construction cost indices. Figure 1: Exposure growth in Hurricane Andrew’s footprint (in constant dollars). Source: RMSOne key uncertainty in estimating the losses from a repeat of Hurricane Andrew concerns the impact of claims litigation. “Irma in 2017 was the first significant hurricane to make landfall since the 25 percent roof replacement rule was expanded in 2017 to all buildings across Florida, and it contributed to a significant increase in claims frequency and severity, as roof damage sustained during the storm attracted many roofing contractors, who handed over their exaggerated claims to be pursued by attorneys,” recalls Datin. An estimated US$15 billion has been paid to claimants by insurers in Florida since 2013, driven by assignment of benefits (AOB) cases, where litigation has capitalized on the 25 percent roof replacement rule, with a significant portion of the cost being driven by attorney’s fees on both sides. However, a new law passed by the Florida legislature in May 2022 changed the 25 percent roof replacement rule to exempt roofs “built, repaired, or replaced in compliance with the 2007 Florida Building Code, or any subsequent editions of the Florida Building Code.” “This means that only the damaged portion of the roof on newly built or upgraded roofs needs to be repaired after a damaging wind event instead of the entire roof or roofing system. Most importantly for insurers, the right of the contractor or assignee to obtain compensation for attorney fees – that drives up the cost of claims even further – has been removed,” adds Datin. Muir-Wood adds: “There is further hope for insurers following a recent appeal court ruling in Florida which could provide the blueprint for insurers to successfully argue against contractors in such lawsuits. Here we have at least one factor that is now being brought under control, which has significantly raised the insurance costs of hurricane losses. However, insurers will be watching closely to see if there is any reduction in social inflation because of recent legislative measures.” Can the US$100 Billion Repeat of Andrew be Prevented? Should another Category 5 hurricane make landfall in southeast Florida today, not only will the insured loss be more considerable, but the insurance industry will face major challenges that could severely impact its ability to withstand the event. What can the risk management industry do to mitigate losses? Risk modeling has advanced dramatically. “Insurers need to collect detailed data on their exposures and values and then employ high-resolution modeling alongside all those factors that can affect the ultimate loss, whether from post-event loss amplification or from more resilient construction standards,” says Muir-Wood. The spirit of the industry working together with regulators, similar to post-Andrew, needs to be resurrected. “To help insurance carriers to remain competitive, regulators and legislators have been working with the industry to prevent claims litigation from getting out of control and potentially threatening the viability of hurricane insurance in Florida,” adds Boissonnade. “And legislators also need to keep a close eye on how claims respond to the changes to the 25 percent roof replacement rule, and in measures that reduce the need for litigation, so as to reduce vexatious claims,” he adds. Datin acknowledges the role that risk modelers can play, “The catastrophe modeling community has already helped drive positive change in Florida by demonstrating the impacts of building codes and the effects of AOB-driven claims inflation on modeled risk.” In addition, says Rahnama: “It’s crucial that modeling for hurricane risk takes greater account of the effects of climate change on global warming and sea level rise, and the impact those will ultimately on wind and storm surge in the event of another hurricane like Andrew. Let’s not sleepwalk into another Andrew-type scenario. The insights are there, and the warning signs have flashed – we just need to learn from history.”
RMS HWind Hurricane Forecasting and Response and ExposureIQ: Exposure Management Without the Grind
June 19, 2022Accessing data in real-time to assess and manage an insurance carrier’s potential liabilities from a loss event remains the holy grail for exposure management teams and is high on a business’ overall wish list A 2021 PwC Pulse Survey of U.S. risk management leaders found that risk executives are increasingly taking advantage of “tech solutions for real-time and automated processes, including dynamic risk monitoring (30 percent), new risk management tech solutions (25 percent), data analytics (24 percent) [and] integrated risk management tools on a single platform (19 percent)”. PwC suggested that as part of an organization’s wider digital and business transformation process, risk management teams should therefore: “use technologies that work together, draw on common data sources, build enterprise-wide analytics and define common sets of metrics.” Separately, Deloitte’s 2021 third-party risk management (TPRM) survey found that 53 percent of respondents across a range of industry sectors wanted to improve real-time information, risk metrics, and reporting in their organizations. With the pandemic providing the unlikely backdrop for driving innovation across the business world, the Deloitte survey explained the statistic with the suggestion that one impact of COVID-19 “has been a greater need for real-time continuous assessment and alerts, rather than traditional point-in-time third-party assessment.” Event Forecasting and Response with HWind and ExposureIQ Natural catastrophe events are a risk analytics flash point. And while growing board-level awareness of the importance of real-time reporting might seem like a positive, without marrying the data with the right tools to gather and process that data, together with a more integrated approach to risk management and modeling functions, the pain points for exposure managers on the event frontline, are unlikely to be relieved. RMS® ExposureIQ™ is an exposure management application available on the cloud-native RMS Intelligent Risk Platform™, which enables clients to centralize exposure data, process it, write direct reports and then run deterministic scenarios to quickly and accurately assess their exposure. When an event is threatening or impacts risks, an exposure management team needs to rapidly process the available data to work out their overall exposure and the likely effect on insured assets. The integration of event response data such as HWind into the ExposureIQ application is where the acquisition of this hazard data really starts to make a difference. The 2022 North Atlantic hurricane season, for example, is upon us, and access to regular, real-time data is relied upon as a crucial part of event response to tropical cyclones. With reliable event response analytics, updated in real-time, businesses can get fully prepared and ensure solvency through additional reinsurance cover, more accurately reserve funds, and confidently communicate risk to all stakeholders. The National Oceanic and Atmospheric Administration’s (NOAA) National Hurricane Center (NHC) has long been viewed as a valuable resource for forecasts on the expected track and severity of hurricanes. However, according to Callum Higgins, product manager, global climate, at RMS, “There are some limitations with what you get [from the NHC]. Forecasts lack detailed insights into the spatial variability of hazard severity and while uncertainty is accounted for, this is based on historical data rather than the forecast uncertainty specific to the storm. Hurricane Henri in 2021 was a good example of this. While the ultimate landfall location fell outside the NHC ‘cone of uncertainty’ four days in advance of landfall, given the large model uncertainty in the track for Henri, HWind forecasts were able to account for this possibility.” Introducing HWind RMS HWind provides observation-based tropical cyclone data for both real-time and historical events and was originally developed as a data service for the NHC by renowned meteorologist Dr. Mark Powell. It combines the widest set of observations for a particular storm in order to create the most accurate representation of its wind field. Since RMS acquired HWind in 2015, it has continually evolved as a solution that can be leveraged more easily by insurers to benefit individual use cases. HWind provides snapshots (instantaneous views of the storm’s wind field) and cumulative footprints (past swaths of the maximum wind speeds) every six hours. In addition, RMS delivers hurricane forecast data that includes a series of forecast scenarios of both the wind and surge hazard, enabling users to understand the potential severity of the event up to five days in advance of landfall. “Because HWind real-time products are released up to every six hours, you can adapt your response as forecasts shift. After an event has struck you very quickly get a good view of which areas have been impacted and to what level of severity,” explains Higgins. The level of detail is another key differentiator. In contrast to the NHC forecasts, which do not include a detailed wind field, HWind provides much more data granularity, with forecast wind and surge scenarios developed by leveraging the RMS North Atlantic Hurricane Models. Snapshots and cumulative footprints, meanwhile, represent the wind field on a 1x1 kilometer grid. And while the NHC does provide uncertainty metrics in its forecasts, such as the “cone of uncertainty” around where the center of the storm will track, these are typically based on historical statistics. “HWind accounts for the actual level of model convergence for a particular storm. That provides you with the insights you need to make decisions around how much confidence to place in each forecast, including whether a more conservative approach is required in cases of heightened uncertainty,” Higgins explains. HWind’s observational approach and access to more than 30 data sources, some of which are exclusive to RMS, means users are better able to capture a particular wind field and apply that data across a wide variety of use cases. Some HWind clients – most notably, Swiss Re – also use it as a trigger for parametric insurance policies. “That’s a critical component for some of our clients,” says Higgins. “For a parametric trigger, you want to make sure you have as accurate as possible a view of the wind speed experienced at underwritten locations when a hurricane strikes.” Real-time data is only one part of the picture. The HWind Enhanced Archive is a catalog of data – including high-resolution images, snapshots, and footprints from historical hurricanes extending back almost 30 years that can be used to validate historical claims and loss experience. “When we're creating forecasts in real-time, we only have the information of what has come before [in that particular storm],” says Higgins. “With the archive, we can take advantage of the data that comes in after we produce the snapshots and use all of that to produce an enhanced archive to improve what we do in real-time.” Taking the Stress out of Event Response “Event response is quite a stressful time for the insurance industry, because they've got to make business decisions based around what their losses could be,” Higgins adds. “At the time of these live events, there's always increased scrutiny around their exposure and reporting.” HWind has plugged the gap in the market for a tool that can provide earlier, more frequent, and more detailed insights into the potential impact of a hurricane before, during, and following landfall. “The key reason for having HWind available with ExposureIQ is to have it all in one place,” explains Higgins. “There are many different sources of information out there, and during a live event the last thing you want to do is be scrambling across websites trying to see who's released what and then pull it across to your environment, so you can overlay it on your live portfolio of risks. As soon as we release the accumulation footprints, they are uploaded directly into the application, making it faster and more convenient for users to generate an understanding of potential loss for their specific portfolios." RMS applications such as ExposureIQ, and the modeling application Risk Modeler™, all use the same cloud-native Intelligent Risk Platform. This allows for a continuous workflow, allowing users to generate both accumulation analytics as well as modeled losses from the same set of exposure data. During an event, for example, with the seven hurricane scenarios that form part of the HWind data flow, the detailed wind fields and tracks (see Figure below) and the storm surge footprints for each scenario can be viewed on the ExposureIQ application for clients to run accumulations against. The application has a robust integrated mapping service that allows users to view their losses and hot spots on a map, and it also includes the functionality to switch to see the same data distributed in loss tables if that is preferred. “Now that we have both those on view in the cloud, you can overlay the footprint files on top of your exposures, and quickly see it before you even run [the accumulations],” says Higgins. Figure 1: RMS HWind forecast probability of peak gusts greater than 80 miles per hour from Hurricane Ida at 1200UTC August 29, 2021, overlaid on exposure data within the RMS ExposureIQ applicationOne-Stop-Shop This close interaction between HWind and the ExposureIQ application indicates another advantage of the RMS product suite – the use of consistent event response data across the platform so exposure mapping and modeling are all in one place. “The idea is that by having it on the cloud, it is much more performant; you can analyze online portfolios a lot more quickly, and you can get those reports to your board a lot faster than previously,” says Higgins. In contrast to other solutions in the market, which typically use third-party hazard tools and modeling platforms, the RMS suite has a consistent model methodology flowing through the entire product chain. “That's really where the sweet spot of ExposureIQ is – this is all one connected ecosystem,” commented Higgins. “I get my data into ExposureIQ and it is in the same format as Risk Modeler, so I don't need to convert anything. Both products use a consistent financial model too – so you are confident the underlying policy and reinsurance terms are being applied in the same way.” The modular nature of the RMS application ecosystem means that, in addition to hurricane risks, data on perils such as floods, earthquakes, and wildfires are also available – and then processed by the relevant risk modeling tool to give clients insights on their potential losses. “With that indication of where you might expect to experience claims, and how severe those claims might be, you can start to reach out to policyholders to understand if they've been affected.” At this point, clients are then in a good position to start building their claims deployment strategy, preparing claims adjusters to visit impacted sites and briefing reserving and other teams on when to start processing payments. But even before a hurricane has made landfall, clients can make use of forecast wind fields to identify locations that might be affected in advance of the storm and warn policyholders to prepare accordingly. “That can not only help policyholders to protect their property but also mitigate insurance losses as well,” says Higgins. “Similarly, you can use it to apply an underwriting moratorium in advance of a storm. Identify areas that are likely to be impacted, and then feed that into underwriting processes to ensure that no one can write a policy in the region when a storm is approaching.” The First Unified Risk Modeling Platform Previously, before moving to an integrated, cloud-based platform, these tools would likely have been hosted using on-premises servers with all the significant infrastructure costs that implies. Now, in addition to accessing a full suite of products via a single cloud-native platform, RMS clients can also leverage the company’s three decades of modeling expertise, benefiting from a strong foundation of trusted exposure data to help manage their exposures. “A key goal for a lot of people responding to events is initially to understand what locations are affected, how severely they're affected, and what their total exposed limit is, and to inform things like deploying claims adjusters,” says Higgins. And beyond the exposure management function, argues Higgins, it’s about gearing up for the potential pain of those claims, the processes that go around that, and the communication to the board. “These catastrophic events can have a significant impact on a company’s revenue, and the full implications – and any potential mitigation – needs to be well understood.” Find out more about the award-winning ExposureIQ.
Deconstructing Social Inflation
September 22, 2021After the loss creep associated with Hurricane Irma in 2017, (re)insurers are keen to quantify how social inflation could exacerbate claims costs in the future. The challenge lies in eliminating the more persistent, longer-term trends, allowing these factors to be explicitly modeled and reducing the “surprise factor” the next time a major storm blows through. A few days after Hurricane Irma passed over Marco Island, Florida, on September 10, 2017, RMS® deployed a reconnaissance team to offer some initial feedback on the damage that was sustained. Most properties on the island had clay tile roofs and while the team noted some dislodged or broken tiles, damage did not appear to be severe. A year later, when Peter Datin, senior director of modeling at RMS, decided to revisit the area, he was shocked by what he saw. “There were so many roofing contractors still on the island, and almost every house seemed to be getting a full roof replacement. We found out that US$900 million worth of roofing permits for repairs had been filed in Marco Island alone.” Trying to find the exact shape and color for tile replacements was a challenge, forcing contractors to replace the entire roof for aesthetic reasons. Then there is Florida's “25 percent rule,” which previously applied to High-Velocity Hurricane Zones in South Florida (Miami-Dade and Broward Counties) before expanding statewide under the 2017 Florida Building Code. Under the rule, if a loss assessor or contractor determines that a quarter or more of the roof has been damaged in the last 12 months, it cannot simply be repaired, and 100 percent must be replaced. This begins to explain why, in the aftermath of Hurricane Irma and to a lesser extent Hurricane Michael in 2018, claims severity and loss creep were such an issue. “We looked at some modeling aspects in terms of the physical meaning of this,” says Datin. “If we were to directly implement an engineering or physics-based approach, what does that mean? How does it impact the vulnerability curve? "We went through this exercise last summer and found that if you hit that threshold of the 25 percent roof damage ratio, particularly for low wind speeds, that's a fourfold increase on your claims. At certain wind speeds, it can therefore have a very material increase on the losses being paid. It’s not quite that straightforward to implement on the vulnerability curve, but it is very significant.” But issues such as the 25 percent rule do not tell the whole story, and in a highly litigious market such as Florida, determining whether a roof needs a complete replacement is not just down to physics. Increasingly, the confluence of additional factors that fall under the broad description of “social inflation” are also having a meaningful impact on the total cost of claims. What Is Social Inflation? Broadly, social inflation refers to all the ways in which insurers’ claims costs rise over and above general economic inflation (i.e., growth in wages and prices), which will influence the cost of repairs and/or replacing damaged property. It therefore captures the growth in costs connected to the following: unanticipated emerging perils associated with, for example, new materials or technologies, shifts in the legal environment, evolving social attitudes and preferences towards equitable risk absorption, and demographic and political developments. (Source: Geneva Association) Florida's “David and Goliath” Law A major driver is the assertive strategies of the plaintiffs' bar, compounded by the three-year window in which to file a claim and the use and potential abuse of practices such as assignment of benefits (AOB). The use of public adjusters and broader societal attitudes towards insurance claiming also need to be taken into consideration. Meanwhile, the expansion of coverage terms and conditions in the loss-free years between 2005 and 2017 and generous policy interpretations play their part in driving up claims frequency and severity. What Is Assignment of Benefits (AOB)? An assignment of benefits, or AOB, is a document signed by a policyholder that allows a third party, such as a water extraction company, a roofer or a plumber to '”stand in the shoes” of the insured and seek payment directly from the policyholder's insurance company for the cost of repairs. AOBs have long been part of Florida’s insurance marketplace. (Source: Florida Office of Insurance Regulation) More recently, the effects of COVID-19 has impacted the cost of repairs, in turn increasing insurers' loss ratios. (Re)insurers naturally want to better understand how social inflation is likely to impact their cost of claims. But determining the impact of social inflation on the “claims signal” is far from simple. From a modeling perspective, the first step is deselecting the different elements that contribute toward social inflation and understanding which trends are longer term in nature. The recently released Version 21 of the RMS North Atlantic Hurricane Models incorporates an alternative view of vulnerability for clients and reflects the changing market conditions applicable to Florida residential lines, including the 25 percent roof replacement rule. However, the effects of social inflation are still largely considered non-modeled. They are removed from available data where possible, during the model development process. Any residual impacts are implicitly represented in the model. “Quantifying the impacts of social inflation is a complex task, partly because of the uncertainty in how long these factors will persist,” says Jeff Waters, senior product manager at RMS. “The question is, going forward, how much of an issue is social inflation really going to be for the next three, five or 10 years? Should we start thinking more about ways in which to explicitly account for these social inflation factors or give model users the ability to manually fold in these different factors? “One issue is that social inflation really ramped up over the last few years,” he continues. “It's especially true in Florida following events like Hurricanes Irma and Michael. At RMS, we have been working hard trying to determine which of these signals are caused by social inflation and which are caused by other things happening in Florida. Certainly, the view of vulnerability in Version 21 starts to reflect these elevated risk factors.” AOB had a clear impact on claims from Irma and Michael. Florida's “David and Goliath” law was intended to level the playing field between policyholders and economically powerful insurers, notes the Insurance Information Institute's Jeff Dunsavage. Instead, the law offered an incentive for attorneys to file thousands of AOB-related suits. The ease with which unscrupulous contractors can “find” damage and make claims within three years of a catastrophe loss has further exacerbated the problem. Waters points out that in 2006 there were only around 400 AOB lawsuits in the market. By 2018, that number had risen to over 135,000. In a decade that had seen very few storms, it was difficult to predict how significant an impact AOB would have on hurricane-related claims, until Irma struck. Of the Irma and Michael claims investigated by RMS, roughly 20 percent were impacted by AOB. “From a claims severity standpoint, the cost of those claims increased up to threefold on average compared to claims that were not affected by AOB," says Waters. Insurers on the Brink The problem is not just limited to recent hurricane events. Due to the Sunshine State's increased litigation, insurers are continuing to face a barrage of AOB non-catastrophe claims, including losses relating to water and roof damage. Reforms introduced in 2019 initially helped rein in the more opportunistic claims, but notifications dialed back up again after attorneys were able to find and exploit loopholes. Amid pressures on the court system due to COVID-19, reform efforts are continuing. In April 2021, the Florida Legislature passed a new law intended to curb market abuse of litigation and roofing contractor practices, among other reforms. Governor Ron DeSantis said the law had been a reaction to “mounting insurance costs” for homeowners. As loss ratios rose, carriers have been passing some of the additional costs back onto the policyholders in the form of additional premiums (around US$680 per family on average). Meanwhile, some carriers have begun to offer policies with limited AOB rights, or none at all, in an effort to get more control over the spiraling situation. “There are some pushes in the legislature to try to curb some of the more litigious behavior on the part of the trial lawyers,” says Matthew Nielsen, senior director, regulatory affairs at RMS. Nielsen thinks the 2021 hurricane season could be telling in terms of separating out some of the more permanent changes in the market where social inflation is concerned. The National Oceanic and Atmospheric Administration (NOAA) still predicts another above-average season in the North Atlantic, but currently does not anticipate the historic level of storm activity seen in 2020. “What's going to happen when the next hurricane makes landfall, and which of these elements are actually going to still be here?” asks Nielsen. “What nobody wants to see again is the kind of chaos that came after 2004 and 2005, when there were questions about the health of the insurance market and what the roles of the Florida Hurricane Catastrophe Fund (FHCF) and Florida Citizens Property Insurance Corporation were going to be.” “Ultimately, we're trying to figure out which of these social inflation signals are going to stick around, and the difficulty is separating the long-term signals from the short-term ones,” he continues. “The 25 percent roof replacement rule is written into legislation, and so that is going to be the new reality going forward. On the other hand, we don't want to include something that is a temporary blip on the radar.”


Like Moths to the Flame
September 06, 2019Why is it that, in many different situations and perils, people appear to want to relocate toward the risk? What is the role of the private insurance and reinsurance industry in curbing their clients’ risk tropism? Florida showed rapid percentage growth in terms of exposure and number of policyholders If the Great Miami Hurricane of 1926 were to occur again today it would result in insurance losses approaching US$200 billion. Even adjusted for inflation, that is hundreds of times more than the US$100 million damage toll in 1926. Over the past 100 years, the Florida coast has developed exponentially, with wealthy individuals drawn to buying lavish coastal properties — and the accompanying wind and storm-surge risks. Since 2000, the number of people living in coastal areas of Florida increased by 4.2 million, or 27 percent, to 19.8 million in 2015, according to the U.S. Census Bureau. This is an example of unintended “risk tropism,” explains Robert Muir-Wood, chief research officer at RMS. Just as the sunflower is a ‘heliotrope’, turning toward the sun, research has shown how humans have an innate drive to live near water, on a river or at the beach, often at increased risk of flood hazards. “There is a very strong human desire to find the perfect primal location for your house. It is something that is built deeply into the human psyche,” Muir-Wood explains. “People want to live with the sound of the sea, or in the forest ‘close to nature,’ and they are drawn to these locations thinking about all the positives and amenity values, but not really understanding or evaluating the accompanying risk factors. “People will pay a lot to live right next to the ocean,” he adds. “It’s an incredibly powerful force and they will invest in doing that, so the price of land goes up by a factor of two or three times when you get close to the beach.” Even when beachfront properties are wiped out in hurricane catastrophes, far from driving individuals away from a high-risk zone, research shows they simply “build back bigger,” says Muir-Wood. “The disaster can provide the opportunity to start again, and wealthier people move in and take the opportunity to rebuild grander houses. At least the new houses are more likely to be built to code, so maybe the reduction in vulnerability partly offsets the increased exposure at risk.” Risk tropism can also be found with the encroachment of high-value properties into the wildlands of California, leading to a big increase in wildfire insurance losses. Living close to trees can be good for mental health until those same trees bring a conflagration. Insurance losses due to wildfire exceeded US$10 billion in 2017 and have already breached US$12 billion for last year’s Camp, Hill and Woolsey Fires, according to the California Department of Insurance. It is not the number of fires that have increased, but the number of houses consumed by the fires. “Insurance tends to stop working when you have levels of risk above one percent […] People are unprepared to pay for it” Robert Muir-Wood RMS Muir-Wood notes that the footprint of the 2017 Tubbs Fire, with claims reaching to nearly US$10 billion, was very similar to the area burned during the Hanley Fire of 1964. The principal difference in outcome is driven by how much housing has been developed in the path of the fire. “If a fire like that arrives twice in one hundred years to destroy your house, then the amount you are going to have to pay in insurance premium is going to be more than 2 percent of the value per year,” he says. “People will think that’s unjustified and will resist it, but actually insurance tends to stop working when you have levels of risk cost above 1 percent of the property value, meaning, quite simply, that people are unprepared to pay for it.” Risk tropism can also be found in the business sector, in the way that technology companies have clustered in Silicon Valley: a tectonic rift within a fast-moving tectonic plate boundary. The tectonics have created the San Francisco Bay and modulate the climate to bring natural air-conditioning. “Why is it that, around the world, the technology sector has picked locations — including Silicon Valley, Seattle, Japan and Taiwan — that are on plate boundaries and are earthquake prone?” asks Muir-Wood. “There seems to be some ideal mix of mountains and water. The Bay Area is a very attractive environment, which has brought the best students to the universities and has helped companies attract some of the smartest people to come and live and work in Silicon Valley,” he continues. “But one day there will be a magnitude 7+ earthquake in the Bay Area that will bring incredible disruption, that will affect the technology firms themselves.” Insurance and reinsurance companies have an important role to play in informing and dissuading organizations and high net worth individuals from being drawn toward highly exposed locations; they can help by pricing the risk correctly and maintaining underwriting discipline. The difficulty comes when politics and insurance collide. The growth of Fair Access to Insurance Requirements (FAIR) plans and beach plans, offering more affordable insurance in parts of the U.S. that are highly exposed to wind and quake perils, is one example of how this function is undermined. At its peak, the size of the residual market in hurricane-exposed states was US$885 billion, according to the Insurance Information Institute (III). It has steadily been reduced, partly as a result of the influx of non-traditional capacity from the ILS market and competitive pricing in the general reinsurance market. However, in many cases the markets-of-last-resort remain some of the largest property insurers in coastal states. Between 2005 and 2009 (following Hurricanes Charley, Frances, Ivan and Jeanne in 2004), the plans in Mississippi, Texas and Florida showed rapid percentage growth in terms of exposure and number of policyholders. A factor fueling this growth, according to the III, was the rise in coastal properties. As long as state-backed insurers are willing to subsidize the cost of cover for those choosing to locate in the riskiest locations, private (re)insurance will fail as an effective check on risk tropism, thinks Muir-Wood. “In California there are quite a few properties that have not been able to get standard fire insurance,” he observes. “But there are state or government-backed schemes available, and they are being used by people whose wildfire risk is considered to be too high.”
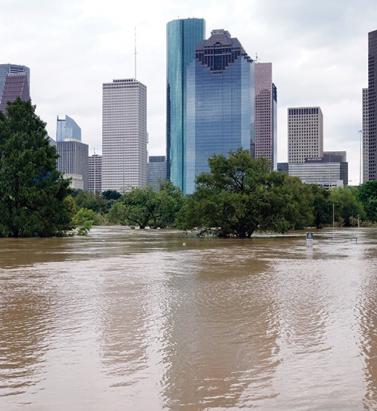
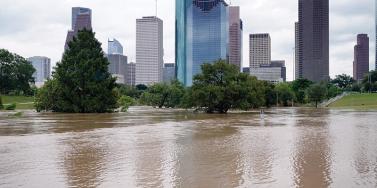
Living in a World of Constant Catastrophes
May 20, 2019(Re)insurance companies are waking up to the reality that we are in a riskier world and the prospect of ‘constant catastrophes’ has arrived, with climate change a significant driver In his hotly anticipated annual letter to shareholders in February 2019, Warren Buffett, the CEO of Berkshire Hathaway and acclaimed “Oracle of Omaha,” warned about the prospect of “The Big One” — a major hurricane, earthquake or cyberattack that he predicted would “dwarf Hurricanes Katrina and Michael.” He warned that “when such a mega-catastrophe strikes, we will get our share of the losses and they will be big — very big.” The use of new technology, data and analytics will help us prepare for unpredicted ‘black swan’ events and minimize the catastrophic losses Mohsen Rahnama RMS The question insurance and reinsurance companies need to ask themselves is whether they are prepared for the potential of an intense U.S. landfalling hurricane, a Tōhoku-size earthquake event and a major cyber incident if these types of combined losses hit their portfolio each and every year, says Mohsen Rahnama, chief risk modeling officer at RMS. “We are living in a world of constant catastrophes,” he says. “The risk is changing, and carriers need to make an educated decision about managing the risk. “So how are (re)insurers going to respond to that? The broader perspective should be on managing and diversifying the risk in order to balance your portfolio and survive major claims each year,” he continues. “Technology, data and models can help balance a complex global portfolio across all perils while also finding the areas of opportunity.” A Barrage of Weather Extremes How often, for instance, should insurers and reinsurers expect an extreme weather loss year like 2017 or 2018? The combined insurance losses from natural disasters in 2017 and 2018 according to Swiss Re sigma were US$219 billion, which is the highest-ever total over a two-year period. Hurricanes Harvey, Irma and Maria delivered the costliest hurricane loss for one hurricane season in 2017. Contributing to the total annual insurance loss in 2018 was a combination of natural hazard extremes, including Hurricanes Michael and Florence, Typhoons Jebi, Trami and Mangkhut, as well as heatwaves, droughts, wildfires, floods and convective storms. While it is no surprise that weather extremes like hurricanes and floods occur every year, (re)insurers must remain diligent about how such risks are changing with respect to their unique portfolios. Looking at the trend in U.S. insured losses from 1980–2018, the data clearly shows losses are increasing every year, with climate-related losses being the primary drivers of loss, especially in the last four decades (even allowing for the fact that the completeness of the loss data over the years has improved). Measuring Climate Change With many non-life insurers and reinsurers feeling bombarded by the aggregate losses hitting their portfolios each year, insurance and reinsurance companies have started looking more closely at the impact that climate change is having on their books of business, as the costs associated with weather-related disasters increase. The ability to quantify the impact of climate change risk has improved considerably, both at a macro level and through attribution research, which considers the impact of climate change on the likelihood of individual events. The application of this research will help (re)insurers reserve appropriately and gain more insight as they build diversified books of business. Take Hurricane Harvey as an example. Two independent attribution studies agree that the anthropogenic warming of Earth’s atmosphere made a substantial difference to the storm’s record-breaking rainfall, which inundated Houston, Texas, in August 2017, leading to unprecedented flooding. In a warmer climate, such storms may hold more water volume and move more slowly, both of which lead to heavier rainfall accumulations over land. Attribution studies can also be used to predict the impact of climate change on the return-period of such an event, explains Pete Dailey, vice president of model development at RMS. “You can look at a catastrophic event, like Hurricane Harvey, and estimate its likelihood of recurring from either a hazard or loss point of view. For example, we might estimate that an event like Harvey would recur on average say once every 250 years, but in today’s climate, given the influence of climate change on tropical precipitation and slower moving storms, its likelihood has increased to say a 1-in-100-year event,” he explains. We can observe an incremental rise in sea level annually — it’s something that is happening right in front of our eyes Pete Dailey RMS “This would mean the annual probability of a storm like Harvey recurring has increased more than twofold from 0.4 percent to 1 percent, which to an insurer can have a dramatic effect on their risk management strategy.” Climate change studies can help carriers understand its impact on the frequency and severity of various perils and throw light on correlations between perils and/or regions, explains Dailey. “For a global (re)insurance company with a book of business spanning diverse perils and regions, they want to get a handle on the overall effect of climate change, but they must also pay close attention to the potential impact on correlated events. “For instance, consider the well-known correlation between the hurricane season in the North Atlantic and North Pacific,” he continues. “Active Atlantic seasons are associated with quieter Pacific seasons and vice versa. So, as climate change affects an individual peril, is it also having an impact on activity levels for another peril? Maybe in the same direction or in the opposite direction?” Understanding these “teleconnections” is just as important to an insurer as the more direct relationship of climate to hurricane activity in general, thinks Dailey. “Even though it’s hard to attribute the impact of climate change to a particular location, if we look at the impact on a large book of business, that’s actually easier to do in a scientifically credible way,” he adds. “We can quantify that and put uncertainty around that quantification, thus allowing our clients to develop a robust and objective view of those factors as a part of a holistic risk management approach.” Of course, the influence of climate change is easier to understand and measure for some perils than others. “For example, we can observe an incremental rise in sea level annually — it’s something that is happening right in front of our eyes,” says Dailey. “So, sea-level rise is very tangible in that we can observe the change year over year. And we can also quantify how the rise of sea levels is accelerating over time and then combine that with our hurricane model, measuring the impact of sea-level rise on the risk of coastal storm surge, for instance.” Each peril has a unique risk signature with respect to climate change, explains Dailey. “When it comes to a peril like severe convective storms — tornadoes and hail storms for instance — they are so localized that it’s difficult to attribute climate change to the future likelihood of such an event. But for wildfire risk, there’s high correlation with climate change because the fuel for wildfires is dry vegetation, which in turn is highly influenced by the precipitation cycle.” Satellite data from 1993 through to the present shows there is an upward trend in the rate of sea-level rise, for instance, with the current rate of change averaging about 3.2 millimeters per year. Sea-level rise, combined with increasing exposures at risk near the coastline, means that storm surge losses are likely to increase as sea levels rise more quickly. “In 2010, we estimated the amount of exposure within 1 meter above the sea level, which was US$1 trillion, including power plants, ports, airports and so forth,” says Rahnama. “Ten years later, the exact same exposure was US$2 trillion. This dramatic exposure change reflects the fact that every centimeter of sea-level rise is subjected to a US$2 billion loss due to coastal flooding and storm surge as a result of even small hurricanes. “And it’s not only the climate that is changing,” he adds. “It’s the fact that so much building is taking place along the high-risk coastline. As a result of that, we have created a built-up environment that is actually exposed to much of the risk.” Rahnama highlighted that because of an increase in the frequency and severity of events, it is essential to implement prevention measures by promoting mitigation credits to minimize the risk. He says: “How can the market respond to the significant losses year after year. It is essential to think holistically to manage and transfer the risk to the insurance chain from primary to reinsurance, capital market, ILS, etc.,” he continues. “The art of risk management, lessons learned from past events and use of new technology, data and analytics will help to prepare for responding to unpredicted ‘black swan’ type of events and being able to survive and minimize the catastrophic losses.” Strategically, risk carriers need to understand the influence of climate change whether they are global reinsurers or local primary insurers, particularly as they seek to grow their business and plan for the future. Mergers and acquisitions and/or organic growth into new regions and perils will require an understanding of the risks they are taking on and how these perils might evolve in the future. There is potential for catastrophe models to be used on both sides of the balance sheet as the influence of climate change grows. Dailey points out that many insurance and reinsurance companies invest heavily in real estate assets. “You still need to account for the risk of climate change on the portfolio, whether you’re insuring properties or whether you actually own them, there’s no real difference.” In fact, asset managers are more inclined to a longer-term view of risk when real estate is part of a long-term investment strategy. Here, climate change is becoming a critical part of that strategy. “What we have found is that often the team that handles asset management within a (re)insurance company is an entirely different team to the one that handles catastrophe modeling,” he continues. “But the same modeling tools that we develop at RMS can be applied to both of these problems of managing risk at the enterprise level. “In some cases, a primary insurer may have a one-to-three-year plan, while a major reinsurer may have a five-to-10-year view because they’re looking at a longer risk horizon,” he adds. “Every time I go to speak to a client — whether it be about our U.S. Inland Flood HD Model or our North America Hurricane Models — the question of climate change inevitably comes up. So, it’s become apparent this is no longer an academic question, it’s actually playing into critical business decisions on a daily basis.” Preparing for a Low-carbon Economy Regulation also has an important role in pushing both (re)insurers and large corporates to map and report on the likely impact of climate change on their business, as well as explain what steps they have taken to become more resilient. In the U.K., the Prudential Regulation Authority (PRA) and Bank of England have set out their expectations regarding firms’ approaches to managing the financial risks from climate change. Meanwhile, a survey carried out by the PRA found that 70 percent of U.K. banks recognize the risk climate change poses to their business. Among their concerns are the immediate physical risks to their business models — such as the exposure to mortgages on properties at risk of flood and exposure to countries likely to be impacted by increasing weather extremes. Many have also started to assess how the transition to a low-carbon economy will impact their business models and, in many cases, their investment and growth strategy. “Financial policymakers will not drive the transition to a low-carbon economy, but we will expect our regulated firms to anticipate and manage the risks associated with that transition,” said Bank of England Governor Mark Carney, in a statement. The transition to a low-carbon economy is a reality that (re)insurance industry players will need to prepare for, with the impact already being felt in some markets. In Australia, for instance, there is pressure on financial institutions to withdraw their support from major coal projects. In the aftermath of the Townsville floods in February 2019 and widespread drought across Queensland, there have been renewed calls to boycott plans for Australia’s largest thermal coal mine. To date, 10 of the world’s largest (re)insurers have stated they will not provide property or construction cover for the US$15.5 billion Carmichael mine and rail project. And in its “Mining Risk Review 2018,” broker Willis Towers Watson warned that finding insurance for coal “is likely to become increasingly challenging — especially if North American insurers begin to follow the European lead.”
Assigning a Return Period to 2017
May 11, 2018Hurricanes Harvey, Irma and Maria (HIM) tore through the Caribbean and U.S. in 2017, resulting in insured losses over US$80 billion. Twelve years after Hurricanes Katrina, Rita and Wilma (KRW), EXPOSURE asks if the (re)insurance industry was better prepared for its next ‘terrible trio’ and what lessons can be learned In one sense, 2017 was a typical loss year for the insurance industry in that the majority of losses stemmed from the “peak zone” of U.S. hurricanes. However, not since the 2004-05 season had the U.S. witnessed so many landfalling hurricanes. It was the second most costly hurricane season on record for the (re)insurance industry, when losses in 2005 are adjusted for inflation. According to Aon Benfield, HIM caused total losses over US$220 billion and insured losses over US$80 billion — huge sums in the context of global catastrophe losses for the year of US$344 billion and insured losses of US$134 billion. Overall, weather-related catastrophe losses exceeded 0.4 percent of global GDP in 2017 (based on data from Aon Benfield, Munich Re and the World Bank), the second highest figure since 1990. In that period, only 2005 saw a higher relative catastrophe loss at around 0.5 percent of GDP. But, it seems, (re)insurers were much better prepared to absorb major losses this time around. Much has changed in the 12 years since Hurricane Katrina breached the levees in New Orleans. Catastrophe modeling as a profession has evolved into exposure management, models and underlying data have improved and there is a much greater appreciation of model uncertainty and assumptions, explains Alan Godfrey, head of exposure management at Asta. “Even post-2005 people would still see an event occurring, go to the models and pull out a single event ID … then tell all and sundry this is what we’re going to lose. And that’s an enormous misinterpretation of how the models are supposed to be used. In 2017, people demonstrated a much greater maturity and used the models to advise their own loss estimates, and not the other way around.” It also helped that the industry was extremely well-capitalized moving into 2017. After a decade of operating through a low interest rate and increasingly competitive environment, (re)insurers had taken a highly disciplined approach to capital management. Gone are the days where a major event sparked a series of run-offs. While some (re)insurers have reported higher losses than others, all have emerged intact. “In 2017 the industry has performed incredibly well from an operational point of view,” says Godfrey. “There have obviously been challenges from large losses and recovering capital, but those are almost outside of exposure management.” According to Aon Benfield, global reinsurance capacity grew by 80 percent between 1990 and 2017 (to US$605 billion), against global GDP growth of around 24 percent. The influx of capacity from the capital markets into U.S. property catastrophe reinsurance has also brought about change and innovation, offering new instruments such as catastrophe bonds for transferring extreme risks. Harvey broke all U.S. records for tropical cyclone-driven rainfall with observed cumulative rainfall of 51 inches Much of this growth in non-traditional capacity has been facilitated by better data and more sophisticated analytics, along with a healthy appetite for insurance risk from pension funds and other institutional investors. For insurance-linked securities (ILS), the 2017 North Atlantic hurricane season, Mexico’s earthquakes and California’s wildfires were their first big test. “Some thought that once we had a significant year that capital would leave the market,” says John Huff, president and chief executive of the Association of Bermuda Insurers and Reinsurance (ABIR). “And we didn’t see that. “In January 2018 we saw that capital being reloaded,” he continues. “There is abundant capital in all parts of the reinsurance market. Deploying that capital with a reasonable rate of return is, of course, the objective.” Huff thinks the industry performed extremely well in 2017 in spite of the severity of the losses and a few surprises. “I’ve even heard of reinsurers that were ready with claim payments on lower layers before the storm even hit. The modeling and ability to track the weather is getting more sophisticated. We saw some shifting of the storms — Irma was the best example — but reinsurers were tracking that in real time in order to be able to respond.” The Buffalo Bayou River floods a park in Houston after the arrival of Hurricane Harvey How Harvey Inundated Houston One lesson the industry has learned over three decades of modeling is that models are approximations of reality. Each event has its own unique characteristics, some of which fall outside of what is anticipated by the models. The widespread inland flooding that occurred after Hurricane Harvey made landfall on the Texas coastline is an important illustration of this, explains Huff. Even so, he adds, it continued a theme, with flood losses being a major driver of U.S. catastrophe claims for several years now. “What we’re seeing is flood events becoming the No. 1 natural disaster in the U.S. for people who never thought they were at risk of flood.” Harvey broke all U.S. records for tropical cyclone-driven rainfall with observed cumulative rainfall of 51 inches (129 centimeters). The extreme rainfall generated by Harvey and the unprecedented inland flooding across southeastern Texas and parts of southern Louisiana was unusual. However, nobody was overly surprised by the fact that losses from Harvey were largely driven by water versus wind. Prior events with significant storm surge-induced flooding, including Hurricane Katrina and 2012’s Superstorm Sandy, had helped to prepare (re)insurers, exposure managers and modelers for this eventuality. “The events themselves were very large but they were well within uncertainty ranges and not disproportionate to expectations,” says Godfrey. “Harvey is a new data point — and we don’t have that many — so the scientists will look at it and know that any new data point will lead to tweaks,” he continues. “If anything, it will make people spend a bit more time on their calibration for the non-modeled elements of hurricane losses, and some may conclude that big changes are needed to their own adjustments.” But, he adds: “Nobody is surprised by the fact that flooding post-hurricane causes loss. We know that now. It’s more a case of tweaking and calibrating, which we will be doing for the rest of our lives.” Flood Modeling Hurricane Harvey also underscored the importance of the investment in sophisticated, probabilistic flood models. RMS ran its U.S. Inland Flood HD Model in real time to estimate expected flood losses. “When Hurricane Harvey happened, we had already simulated losses of that magnitude in our flood model, even before the event occurred,” says Dr. Pete Dailey, vice president of product management and responsible for U.S. flood modeling at RMS. “The value of the model is to be able to anticipate extreme tail events well before they occur, so that insurance companies can be prepared in advance for the kind of risk they’re taking on and what potential claims volume they may have after a major event,” he adds. Does this mean that a US$100 billion-plus loss year like 2017 is now a 1-in-6-year event? Harvey has already offered a wealth of new data that will be fed into the flood model. The emergency shutdown of the Houston metropolitan area prevented RMS meteorologists and engineers from accessing the scene in the immediate aftermath, explains Dailey. However, once on the ground they gathered as much information as they could, observing and recording what had actually happened to affected properties. “We go to individual properties to assess the damage visually, record the latitude and longitude of the property, the street address, the construction, occupancy and the number of stories,” he says. “We will also make an estimate of the age of the property. Those basic parameters allow us to go back and take a look at what the model would have predicted in terms of damage and loss, as compared to what we observed.” The fact that insured losses emanating from the flooding were only a fraction of the total economic losses is an inevitable discussion point. The majority of claims paid were for commercial properties, with residential properties falling under the remit of the National Flood Insurance Program (NFIP). Many residential homes were uninsured, however, explains ABIR’s Huff. “The NFIP covers just the smallest amount of people — there are only five million policies — and yet you see a substantial event like Harvey which is largely uninsured because (re)insurance companies only cover commercial flood in the U.S.,” he says. “After Harvey you’ll see a realization that the private market is very well-equipped to get back into the private flood business, and there’s a national dialogue going on now.” Is 2017 the New Normal? One question being asked in the aftermath of the 2017 hurricane season is: What is the return period for a loss year like 2017? RMS estimates that, in terms of U.S. and Caribbean industry insured wind, storm surge and flood losses, the 2017 hurricane season corresponds to a return period between 15 and 30 years. However, losses on the scale of 2017 occur more frequently when considering global perils. Adjusted for inflation, it is seven years since the industry paid out a similar level of catastrophe claims — US$110 billion on the Tohoku earthquake and tsunami, Thai floods and New Zealand earthquake in 2011. Six years prior to that, KRW cost the industry in excess of US$75 billion (well over US$100 billion in today’s money). So, does this mean that a US$100 billion-plus (or equivalent in inflation-adjusted terms) loss year like 2017 is now a one-in-six-year event? As wealth and insurance penetration grows in developing parts of the world, will we begin to see more loss years like 2011, where catastrophe claims are not necessarily driven by the U.S. or Japan peak zones? “Increased insurance penetration does mean that on the whole losses will increase, but hopefully this is proportional to the premiums and capital that we are getting in,” says Asta’s Godfray. “The important thing is understanding correlations and how diversification actually works and making sure that is applied within business models. “In the past, people were able to get away with focusing on the world in a relatively binary fashion,” he continues. “The more people move toward diversified books of business, which is excellent for efficient use of capital, the more important it becomes to understand the correlations between different regions.” “You could imagine in the future, a (re)insurer making a mistake with a very sophisticated set of catastrophe and actuarial models,” he adds. “They may perfectly take into account all of the non-modeled elements but get the correlations between them all wrong, ending up with another year like 2011 where the losses across the globe are evenly split, affecting them far more than their models had predicted.” As macro trends including population growth, increasing wealth, climate change and urbanization influence likely losses from natural catastrophes, could this mean a shorter return period for years like last year, where industry losses exceeded US$134 billion? “When we look at the average value of properties along the U.S. coastline — the Gulf Coast and East Coast — there’s a noticeable trend of increasing value at risk,” says Dailey. “That is because people are building in places that are at risk of wind damage from hurricanes and coastal flooding. And these properties are of a higher value because they are more complex, have a larger square footage and have more stories. Which all leads to a higher total insured value. “The second trend that we see would be from climate change whereby the storms that produce damage along the coastline may be increasing in frequency and intensity,” he continues. “That’s a more difficult question to get a handle on but there’s a building consensus that while the frequency of hurricane landfalls may not necessarily be increasing, those that do make landfall are increasing in intensity.” Lloyd’s chief executive Inga Beale has stated her concerns about the impact of climate change, following the market’s £4.5 billion catastrophe claims bill for 2017. “That’s a significant number, more than double 2016; we’re seeing the impact of climate change to a certain extent, particularly on these weather losses, with the rising sea level that impacts and increases the amount of loss,” she said in an interview with Bloomberg. While a warming climate is expected to have significant implications for the level of losses arising from storms and other severe weather events, it is not yet clear exactly how this will manifest, according to Tom Sabbatelli, senior product manager at RMS. “We know the waters have risen several centimeters in the last couple of decades and we can use catastrophe models to quantify what sort of impact that has on coastal flooding, but it’s also unclear what that necessarily means for tropical cyclone strength. “The oceans may be warming, but there’s still an ongoing debate about how that translates into cyclone intensity, and that’s been going on for a long time,” he continues. “The reason for that is we just don’t know until we have the benefit of hindsight. We haven’t had a number of major hurricanes in the last few years, so does that mean that the current climate is quiet in the Atlantic? Is 2017 an anomaly or are we going back to more regular severe activity? It’s not until you’re ten or 20 years down the line and you look back that you know for sure.”
In the Eye of the Storm
May 10, 2018Advances in data capture are helping to give (re)insurers an unparalleled insight into weather-related activity Weather-related data is now available on a much more localized level than ever before. Rapidly expanding weather station networks are capturing terabytes of data across multiple weather-related variables on an almost real-time basis, creating a “ground-truth” clarity multiple times sharper than that available only a few years ago. In fact, so hyperlocalized has this data become that it is now possible to capture weather information “down to a city street corner in some cases,” according to Earth Networks’ chief meteorologist Mark Hoekzema. “The greater the resolution of the data, the more accurate the damage verification” Mark Hoekzema earth networks This ground-level data is vital to the insurance industry given the potential for significant variations in sustained damage levels from one side of the street to the other during weather-related events, he adds. “Baseball-sized hail can fall on one side of the street while just a block over there might be only pea-sized hail and no damage. Tornados and lightning can decimate a neighborhood and leave a house untouched on the same street. The greater the resolution of the data, the more accurate the damage verification.” High-Resolution Perils This granularity of data is needed to fuel the high-resolution modeling capabilities that have become available over the last five to ten years. “With the continued increase in computational power,” Hoekzema explains, “the ability to run models at very high resolutions has become commonplace. Very high-resolution inputs are needed for these models to get the most out of the computations.” In July 2017, RMS teamed up with Earth Networks, capitalizing on its vast network of stations across North America and the Caribbean and reams of both current and historical data to feed into RMS HWind tropical cyclone wind field data products. “Through our linkup with Earth Networks, RMS has access to data from over 6,000 proprietary weather stations across the Americas and Caribbean, particularly across the U.S.,” explains Jeff Waters, senior product manager of model product management at RMS. “That means we can ingest data on multiple meteorological variables in almost real time: wind speed, wind direction and sea level pressure. “By integrating this ground-level data from Earth Networks into the HWind framework, we can generate a much more comprehensive, objective and accurate view of a tropical cyclone’s wind field as it progresses and evolves throughout the Atlantic Basin.” Another key advantage of the specific data the firm provides is that many of the stations are situated in highly built-up areas. “This helps us get a much more accurate depiction of wind speeds and hazards in areas where there are significant amounts of exposure,” Waters points out. According to Hoekzema, this data helps RMS gain a much more defined picture of how tropical cyclone events are evolving. “Earth Networks has thousands of unique observation points that are available to RMS for their proprietary analysis. The network provides unique locations along the U.S. coasts and across the Caribbean. These locations are live observation points, so data can be ingested at high temporal resolutions.” Across the Network Earth Networks operates the world’s largest weather network, with more than 12,000 neighborhood-level sensors installed at locations such as schools, businesses and government buildings. “Our stations are positioned on sturdy structures and able to withstand the worst weather a hurricane can deliver,” explains Hoekzema. Being positioned at such sites also means that the stations benefit from more reliable power sources and can capitalize on high-speed Internet connectivity to ensure the flow of data is maintained during extreme events. In September 2017, an Earth Networks weather station located at the Naples Airport in Florida was the source for one of the highest-recorded wind gusts from Hurricane Irma, registering 131 miles per hour. “The station operated through the entire storm,” he adds. “Through our linkup with Earth Networks … we can ingest data on multiple meteorological variables in almost real time” Jeff waters RMS This network of stations collates a colossal amount of data, with Earth Networks processing some 25 terabytes of data relating to over 25 weather variables on a daily basis, with information refreshed every few minutes. “The weather stations record many data elements,” he says, “including temperature, wind speed, wind gust, wind direction, humidity, dew point and many others. Because the stations are sending data in real time, Earth Networks stations also send very reliable rate information — or how the values are changing in real time. Real-time rate information provides valuable data on how a storm is developing and moving and what extreme changes could be happening on the ground.” Looking Further Ahead For RMS, such pinpoint data is not only helping ensure a continuous data feed during major tropical cyclone events but will also contribute to efforts to enhance the quality of insights delivered prior to landfall. “We’re currently working on the forecasting component of our HWind product suite,” says Waters. “Harnessing this hyperlocal data alongside weather forecast models will help us gain a more accurate picture of possible track and intensity scenarios leading up to landfall, and allow users to quantify the potential impacts to their book of business should some of these scenarios pan out.” RMS is also looking at the possibility of capitalizing on Earth Networks’ data for other perils, including flooding and wildfire, with the company set to release its North America Wildfire HD Models in the fall. For Earth Networks, the firm is capitalizing on new technologies to expand its data reach. “Weather data is being captured by autonomous vehicles such as self-driving cars and drones,” explains Hoekzema. “More and more sensors are going to be sampling areas of the globe and levels of the atmosphere that have never been measured,” he concludes. “As a broader variety of data is made available, AI-based models will be used to drive a broader array of decisions within weather-influenced industries.”
