Professor Ilan Noy holds a unique ”Chair in the Economics of Disasters” at the Victoria University of Wellington, New Zealand. He has proposed in a couple of research papers that instead of counting disaster deaths and economic costs, we should report the “expected life-years” lost, not only for human casualties but also for the life-years of work that will be required to repair all the damage to buildings and infrastructure.
The idea is based on the World Health Organization’s Disability Adjusted Life Years (DALYs) lost through disease and injury (WHO 2013). The motivation is to escape from the distortion introduced by measuring the impact of global disasters in dollars, as loss from the richest countries will always dominate this metric. Noy’s proposal converts injuries into life-years lost, based on how long it takes for the injured to return to complete health, while also factoring the degree of permanent disability multiplied by its duration. This is topped up by a “welfare reduction weight” for all those exposed to a disaster. The final component of the index attempts to capture how many years of human endeavor is lost to recovering the buildings and assets destroyed in the disaster.
There is plenty to argue over in terms of how deaths, injury and damage should be combined. In particular, the assumption that additional work to rebuild a city, is the same as a shortened life, seems somewhat reductive.
Measuring Life-Years Lost
Although Noy’s idea was picked up in the 2015 UNISDR Global Assessment Report, the methodology has not so far gained a lot of traction. This is surprising as Noy’s idea to replace metrics on human fatalities with “life-years lost” already seems to be the implicit, if undeclared, policy in actions to protect human life in disasters, across some of the wealthiest countries.
We can test this where we have detailed data on the ages of all those killed in a particular disaster. By banding this data into five-year age-cohorts we can compare the share of the fatalities with the same share of the national census data. This “age banded fatality risk ratio” reveals the degree to which a particular age band is over or under-represented in the casualties. If there is no bias for that age band then the ratio will be 1.
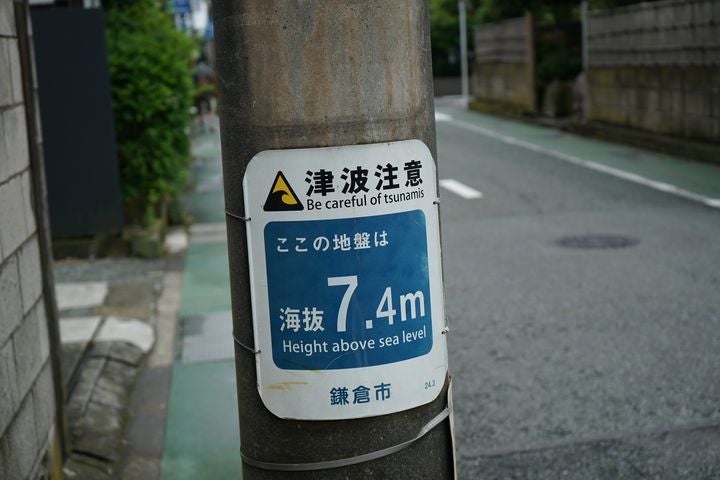
A tsunami warning sign in Kamakura, Japan. Image credit: Wikimedia
Detailed age-banded fatality data is only available for a small number of disasters since 1990. We have age-banded fatality data for the 2011 Japan earthquake and tsunami and from the Camp Fire that destroyed the town of Paradise, California, in November 2018. For casualties from Hurricane Katrina’s flooding in Louisiana, we have a breakdown into coarser age bands of between 10 to 20 years. But what do we find?
Seniors Disproportionately Neglected During Disasters
The age banded risk ratios for the “over 75s” in the fire at Paradise are remarkably similar to those in the flooding from Katrina. For this age group, banded fatality risk ratios were 8x in Paradise and 7.8x in Katrina (i.e. the over-75s were eight times more likely to die than the average across all age bands). These “over 75s” risk ratios were much higher than those calculated from the 2011 Japan earthquake and tsunami: which were only one third of the U.S. disasters at 2.67x.
There are some extraordinary variations in the risk ratios. In flooded New Orleans the fatality risk ratio for the “over 75s” was around eighty (80) times higher than for the “under 18s”. Given that the relative life expectancy ratio between the two groups is only around 10:1, this implies an extraordinary lack of concern for the welfare of the most elderly, even beyond what would be calculated where investments in protection followed Noy’s principle of measuring “life-years lost”. In Japan, the risk ratios of fatalities of the “over 75s” were only eight times higher than in the “under 18s”: an order of magnitude lower than in Louisiana and close to what would be calculated based on relative life expectancy considerations.
While the relativity between “over 75s” and “under 18s” is most stark, we also find a fairly consistent age progression in the ratios, revealing there is a more general relationship between life expectancy and relative risk. The ratio creeps over 1 (i.e. higher than average) above age 55 in Japan, 60 in Paradise, but closer to 50 in New Orleans.
More in Harm’s Way, Less Chance to Escape
There are two underlying factors combined in this data. The first concerns the degree to which older people, through disability or reduced income, are living in harm’s way: in flood zones, in basements, in fragile and combustible mobile homes. Second, there are all the challenges they faced in receiving a warning and rapidly acting on it to escape. Older residents may not have had any means of transport, may have been disabled, may have had pets.
There was a warning available in all three of these disasters: whether the twenty minutes between feeling the earthquake and the arrival of the tsunami, or the day’s warning about the need to evacuate New Orleans. Without the wherewithal to check that people had the means or mobility to leave, older people were much more likely to remain in their houses. Isolation meant no-one came to check they needed a ride.
Clearly, by employing population data at the county or town level (if it was available), we could get deeper into separating how much of this risk was determined by where older people live. The combined risk ratio developed here reflects a societal perspective around where people live and how they respond to warnings, which in combination determines their overall risk.
Age of Survival from Earthquakes
The flooding from Katrina, the 2011 tsunami and the Paradise fire all allowed some potential for heeding a warning and escaping to safety. In which case one would not expect to find a comparable age-related risk for earthquakes. And yet in the night-time 1999 Chi-Chi Taiwan earthquake, in which 2,415 died, mortality among people over 80 years old was an order of magnitude higher than that of people in their twenties[1].
In the night-time 1995 Kobe earthquake, more than 50 percent of those killed were over 60, even though they constituted only 18 percent of the population. It seems that for reasons of mobility, pensioners lived on the ground floor in traditional buildings that suffered soft story collapse.[2] We can conclude that younger people live in safer buildings, unless it was because more of them were able to escape into the street before their building collapsed?
To understand how the survival of the fittest works in an extreme disaster there is the sinking of the car ferry MS Estonia. The fully-loaded roll-on, roll-off ferry sank in the early hours of September 28, 1994, with 989 passengers and crew onboard, in the middle of the Baltic en route from Tallinn, Estonia to Stockholm. Of the 137 survivors, two-thirds were men aged between 20 and 50 years. Only seven aged over 55 survived, with no survivors among children under the age of twelve.
These age banded risk ratios in disasters reveal something profound around the value of life for older people. At least by these measures Japan takes better care of older people than the U.S. Clearly, given all those factors around income, disability and the ability to respond to warnings, it should be up to agencies to put in place measures to reverse these trends.
Without such interventions it seems what happens is exactly the opposite. Instead, there are age-related risk amplifiers, such as locating key facilities for older people in hazardous locations. Three hospitals in Iwate prefecture Japan were completely destroyed by the 2011 tsunami; in one old people’s home, 47 were killed in the tsunami and 11 survivors later died through lack of heating. In another home six miles from the Fukushima Daichi reactors, staff abandoned 128 residents. And in the fires at Paradise, around one-third of the seniors who died lived on their own in mobile (manufactured) homes.
These statistics are shocking. We live in societies that demonstrate, at best, that life is already valued based on expected life years left and at worst that life for seniors is really not valued at all.
[1] Liang, N-J., Y-T. Shih, F-Y. Shih, H-M. Wu, H-J. Wang, S-F. Shi, M-Y Liu and B.B. Wang 2001. Disaster epidemiology and medical response in the Chi-Chi earthquake in Taiwan. Annals of Emergency Medicine 38(5): 549-555
[2] Tanida, N. 1996. What happened to elderly people in the great Hanshin earthquake. British Medical Journal 313: 1133-1135
Robert Muir-Wood works to enhance approaches to natural catastrophe modeling, identify models for new areas of risk, and explore expanded applications for catastrophe modeling. Robert has more than 25 years of experience developing probabilistic catastrophe models. He was lead author for the 2007 IPCC Fourth Assessment Report and 2011 IPCC Special Report on Extremes, and is Chair of the OECD panel on the Financial Consequences of Large Scale Catastrophes.
He is the author of seven books, most recently: ‘The Cure for Catastrophe: How we can Stop Manufacturing Natural Disasters’. He has also written numerous research papers and articles in scientific and industry publications as well as frequent blogs. He holds a degree in natural sciences and a PhD both from Cambridge University and is a Visiting Professor at the Institute for Risk and Disaster Reduction at University College London.


