Over the last 24 hours, the structure and forecast track of Hurricane Florence has evolved significantly as the storm begins to impact the Carolinas, but the material wind, storm surge and flood threat it poses to the Southeastern and Mid-Atlantic U.S. remains.
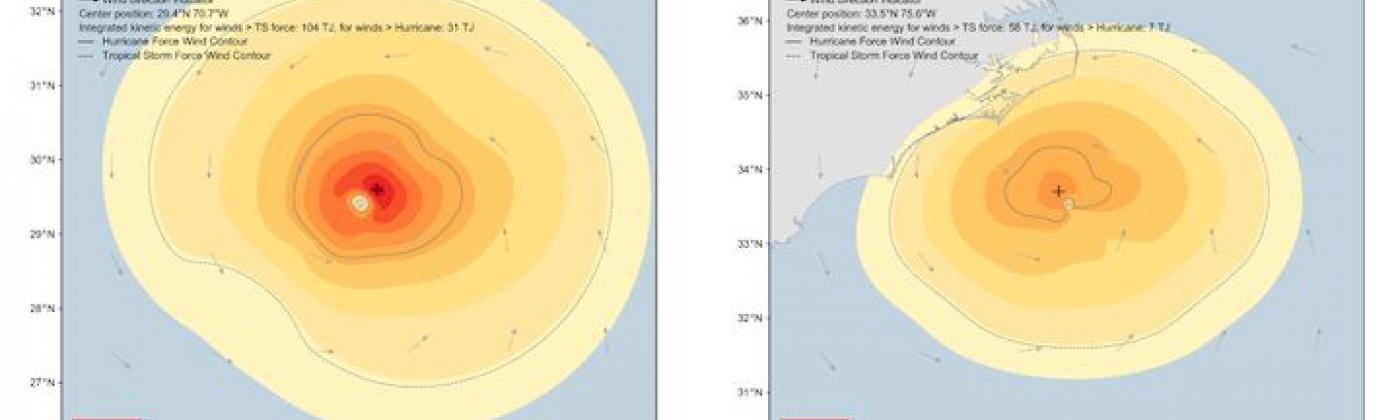
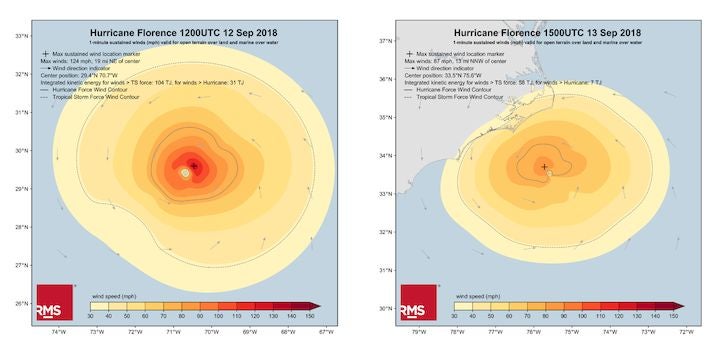
As of 1200 UTC yesterday (September 12), Florence’s wind field was large and powerful as the storm inched closer to the U.S. coast through favorable environmental conditions. According to RMS HWind analyses, which utilize more than 30 public and private observational data sources to generate objective, ground-truth-based tropical cyclone wind field analytics, maximum 1-minute sustained winds were estimated to be 124 miles per hour (199 kilometers per hour) (Figure 1 below), placing the storm squarely in the Category 3 range on the Saffir Simpson Wind Scale.
In addition, the Integrated Kinetic Energy (IKE), an indicator of tropical cyclone strength and damage potential, was estimated to be 104 Terajoules (TJ), putting it on par with historical events like Frances (2004), Gustav (2008), and Isabel (2003).
Figure 1: RMS HWind snapshots of Hurricane Florence (2018). The image on the left shows the snapshot valid at 1200 UTC on September 12, while the image in the right shows the snapshot valid at 1500 UTC on September 13
Since then, Florence has encountered strong wind shear causing it to become somewhat disorganized and weaken considerably as it continues its trek towards the coast. In particular, the convective environment south of the eye has weakened, including the eyewall itself which now wraps around less than half of the storm, while the location of maximum winds has shifted from northeast of the eye to northwest. As of 1500 UTC today (September 13), maximum 1-minute sustained winds have reduced to 87 miles per hour (140 kilometers per hour), while IKE has dropped nearly 50 percent to 58 TJ (Figure 1 above).
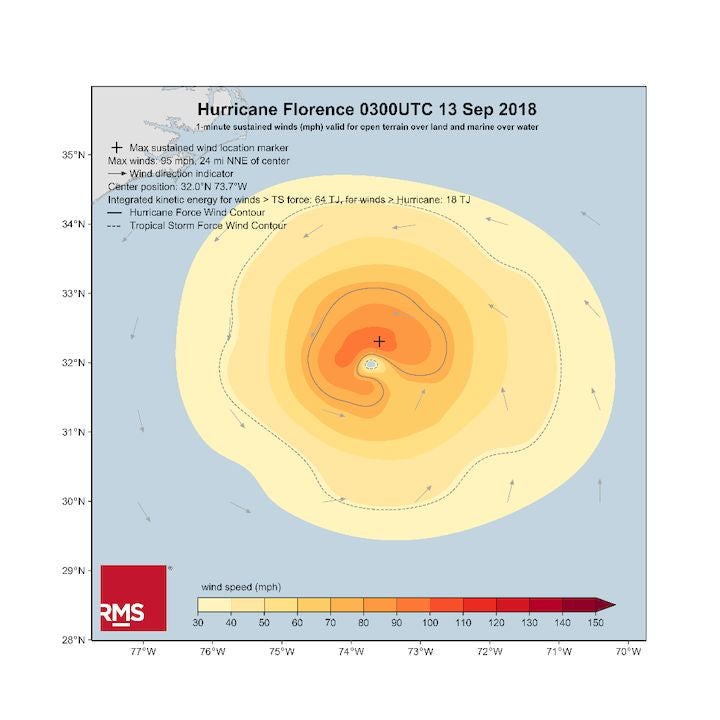
RMS HWind analytics captured this change overnight (Figure 2 below), ahead of it being more formally communicated by the National Hurricane Center earlier this morning.
Figure 2: RMS HWind snapshot of Hurricane Florence (2018) valid at 0300 UTC on September 13. Note the weakened wind speeds in the southern half of the eyewall.
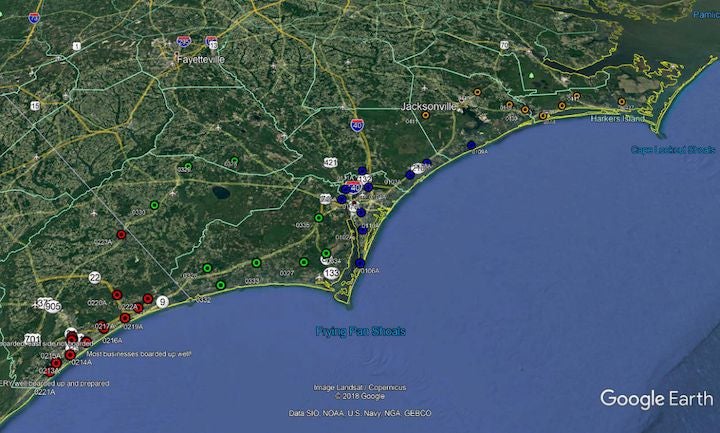
The continuous feeds of land, sea, and satellite-based observational data sources, including the StickNet program via Texas Tech University, which placed more than 40 mobile weather stations along the Carolina coastline (Figure 3 below), has helped the HWind team monitor the evolution of key wind field characteristics in near-real time. This data has been instrumental in informing the HWind Real-Time Analysis snapshot and footprint data. It will also be used by RMS Event Response teams to develop the post-landfall ensemble footprints.
Figure 3: Locations of Texas Tech University StickNet mobile weather stations along the Carolina coastline for Hurricane Florence (2018).
Make no mistake though. Despite the weakening in Florence’s wind field and maximum sustained winds over the last 24 hours, the storm will still pose a material wind, storm surge, and inland flooding threat throughout the Southeastern U.S. as it approaches and ultimately makes landfall.
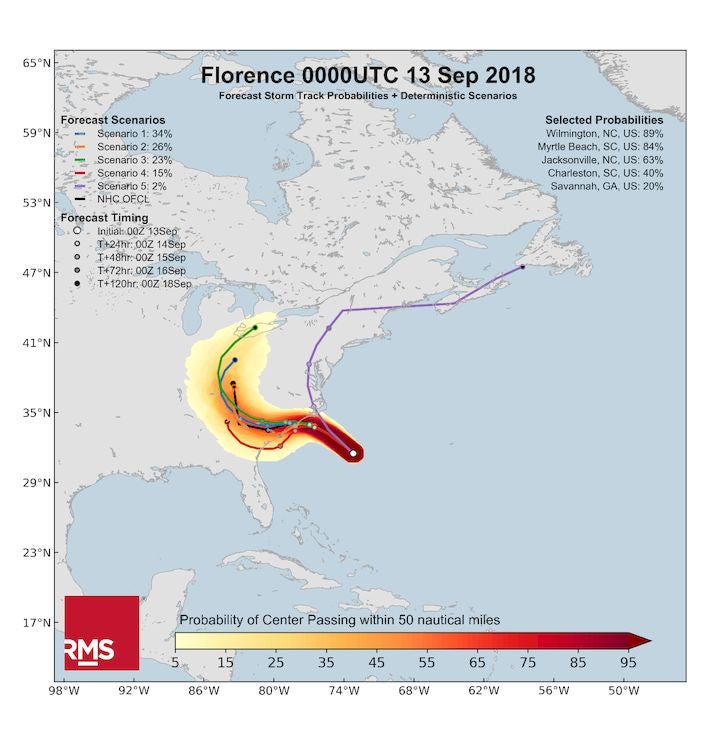
Looking ahead and what’s to come, there has been a strong convergence in track forecasts from the various domestic and international weather models. There is good consensus that Florence will continue to track northwestward and then westward, ultimately slowing down prior to making landfall somewhere near the North Carolina/South Carolina border on Friday (Figure 4 below). Based on the 1200 UTC RMS HWind track forecasting product, cities most likely to be impacted by Florence include Wilmington, North Carolina, and Myrtle Beach, South Carolina.
Figure 4: RMS HWind forecast track probabilities based on the 0000 UTC September 13 weather forecasting model data.
Outstanding uncertainties include the exact timing of landfall, landfall location, and where exactly Florence will stall. Each of these details will directly impact the location and magnitude of severity of wind and water-driven hazards, including storm surge and rainfall-induced flooding.
RMS Event Response and HWind teams will continue to monitor the specifics of Florence, providing updates and insights as new information becomes known.
Share:
You May Also Like
September 27, 2023
Moody’s RMS North Atlantic Hurricane Models: Five Reasons Why Version 23 is the Right Model to Navigate a Challenging Market
Staff Product Manager, Model Product Management, Moody's RMS
Jeff Waters joined Moody's RMS in 2011 and is based in Bethlehem, PA. As part of the Product Management team, he is responsible for product management of the Moody's RMS North Atlantic Hurricane Models.
Jeff provides technical expertise and support regarding catastrophe model solutions and their applications throughout the (re)insurance industry. He also generates product requirements for future updates and releases, and helps develop the overall product strategy, messaging, thought leadership, and collateral to ensure its commercial and technical success.
Waters’ background is meteorology and atmospheric science with a focus in tropical meteorology and climatology. Jeff holds a B.S. in Geography/Meteorology from Ohio University (’09), and a M.S. in Meteorology from Penn State University (’11). He is a member of the American Meteorological Society, the International Society of Catastrophe Managers, and the U.S. Reinsurance Under 40s Group, Inc