Kevin Van Leer, senior product manager – Model Product Management, RMS
20:00 UTC Tuesday, October 17
Nearly ten days have passed since the first four wildfires spread rapidly in Northern California. As of Monday, October 16, over 10,000 firefighters battled 14 fires, principally in the wine-growing valleys north of San Francisco. Fires in Napa, Solano, Sonoma, Mendocino, Lake, Yuba, Butte, Fresno, Calveras, Orange and Nevada counties have burned about 213,000 acres (86,000 hectares), destroying about 5,700 structures and forcing the evacuation of over 100,000 people, according to CAL FIRE and local officials. Aerial photographs show whole neighborhoods in northern Santa Rosa destroyed, and a neighborhood of about 70 houses has been destroyed in east Santa Rosa. Reports on Monday, October 16 state that there are 41 recorded fatalities, and hundreds of people are missing.
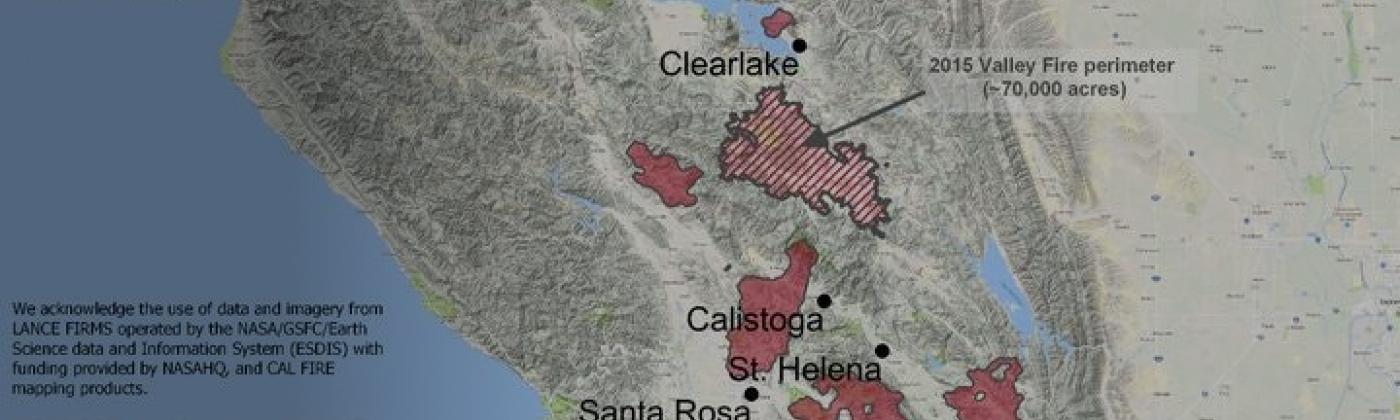
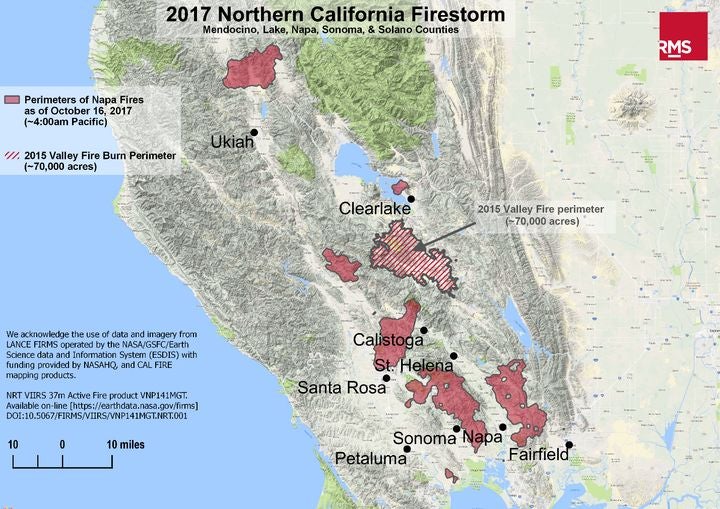
Figure 1: RMS fire perimeters derived using satellite imagery and local information. The 2015 Valley Fire Perimeter is shown for comparison.
RMS generates estimates of burn perimeters using satellite imagery, such as from the Visible Infrared Imaging Radiometer Suite (VIIRS) operated by the U.S. Department of Agriculture. This near real-time imagery detects burning fires using spectral temperature comparisons against the surroundings.
Using this in-house high-resolution exposure information and the satellite derived perimeters for the fires impacting Napa, Sonoma, Solano, Lake, and Mendocino counties, RMS analysis calculates that the perimeters include approximately 17,000 structures and US$14.8 billion in total exposure. The table below provides a breakdown of the impacted exposure. It is important to note that not all structures within the perimeters will be damaged. The 5,041 structures reportedly destroyed in these fires as of today Tuesday, October 17, is in line with RMS historical event research into the fraction of structures within a perimeter that are either damaged or destroyed.
Based on the perimeters for these fires representative of the information available at the time of this post on Tuesday, October 17, RMS estimates an economic loss range between US$3 billion and US$6 billion. This range is not inclusive of fires outside of these counties, which have impacted an additional 600+ structures combined.
Because of the high penetration rate of wildfire coverage in standard residential and non-residential policies, this range also represents an estimate of insured losses. The range includes loss due to property damage, contents and business interruption caused by the burn component of the fires to residential, commercial, and industrial lines of business. It does not include automobile or agricultural crop losses, smoke damage, or any factor for post-loss amplification. Because of the impacts to the wine industry throughout the region, RMS notes the significant uncertainty regarding the long-term business interruption for this event, which could result in a higher total loss.
It is important to note that these events are still ongoing and the perimeters of the active fires may change significantly before final containment. Therefore, this exposure and loss estimate are considered preliminary and are representative of the current situation. RMS will continue to provide updates on this event through RMS Owl.
Share:
You May Also Like
January 22, 2018
Southern California: Thomas Fire Loss Estimate and Mudslide Commentary
California Wildfires: Exposure Impacted by the Thomas Fire
As the Thomas Fire continues to climb the list of the top twenty largest California wildfires for both acres burned and structures destroyed, many in the insurance industry are asking how this fire, in addition to the other burned areas across Southern California, will impact their portfolio. A critical element in understanding the industry impact, but also the significance for an individual book, is the insured value of the burned structures. The Thomas Fire, which at 60 percent containment at the time of publication is already the second largest fire in California history with a reported burn area of 272,000 acres (110,074 hectares), has affected several different communities with wide ranges of average insured value.
Figure 1: Top 20 Largest California Wildfires. Source: CAL FIREWhile damage assessments are still ongoing and counts of damaged or destroyed structures are actively being reported, we can use RMS high resolution exposure data and the latest burn footprint available from Geospatial Multi-Agency Coordination (GeoMAC) to gain a perspective on the total amount and average value of exposure across different areas within the perimeter.
Figure 2: Map of the Thomas Fire Perimeter. Source: GeoMAC as of 0100 UTC on December 18, 2017.As of December 18, portions of ten different ZIP codes are located within the Thomas Fire perimeter, spanning across Santa Barbara and Ventura counties. While the fire started north of Santa Paula around sunset on December 4, it has now spread approximately 50 miles (80 kilometers), primarily to the west, to the hills north of Montecito and Santa Barbara. So far, during two weeks of spread the fire has impacted the communities of Santa Paula, Ojai, Ventura, Oak View, Wheeler Springs, Carpinteria, Montecito, and several others. Each of these communities vary in average residential exposure value, making “average” estimates across the entire perimeter more difficult.
Table 1 below compares the residential exposure for the high value 93108 ZIP postal code that spans the Montecito area against the exposure outside of that ZIP code. All values correspond only to exposure located within the Thomas Fire perimeter, according to the RMS high resolution exposure database. The average residential structure exposure value for 93108 is on average three and a half times higher than structures located outside of that ZIP code. Structures in 93108 accounts for only three and a half percent of the number of structures within the fire perimeter, but 12 percent of the total exposure value.
Table 1: Residential Exposure Values in the Thomas Fire Perimeter.As noted in prior blogs about the Wine Country wildfires, it is important to note that only a fraction of the structures within the perimeter will be damaged or destroyed in this event. The reported numbers so far from CAL FIRE are 1,024 structures destroyed and 250 damaged. Comparing this against the total number of structures within the perimeters, the ratio is approximately 37 percent, which is far lower than the 75 to 80 percent seen in the Wine Country wildfires in October this year, but higher than the other historical Southern California events that have been analyzed (Cedar in 2003 and Witch in 2007).
Figure 3: Percentage of damaged or destroyed structures within historical fire footprints.Also, a comparison of the percentage of destroyed structures versus the total number in the perimeter between the Thomas Fire (1,024 destroyed versus 1,274 total or 80 percent) and the Wine Country Tubbs Fire (6,957 destroyed versus 7,443 total or 93 percent), raises important questions for understanding the key differences between the events. This may indicate a stronger presence of fire suppression, lower impacts of embers, more distributed exposure, differences in surface fuel characteristics (e.g. chaparral versus forest) or a combination of these and other factors in the Thomas Fire. A further review of these event-specific factors, including the weather conditions, will provide more clarity around key drivers of these differences.
By extracting information about the differences between these two events, RMS will continue to build insight into the development of the RMS® U.S. Wildfire HD model, part of the RMS North America Wildfire HD Models suite, due for release in 2018. RMS is still monitoring the ongoing events affecting Southern California and will continue to provide updates through RMS Owl.…
As a senior product manager in the Model Product Management group at RMS, Kevin is responsible for RMS climate-peril products for the Americas, including wildfire and custom vulnerability analytics. Kevin has been actively involved in model releases for both severe convective storm and hurricane models over the last four years at RMS. Kevin holds a master’s degree in atmospheric science from the University of Illinois at Urbana-Champaign, where he authored a thesis on tornado-genesis and severe convective storms, and a bachelor’s degree in atmospheric science from Purdue University. He also holds the Certified Catastrophe Risk Analyst (CCRA) designation from RMS. Kevin is a member of the American Meteorological Society (AMS), a mentor for the AMS Board of Private Sector Meteorologists, and a voting member of the ASCE Standards Committee on Wind Speed Estimation in Tornadoes.