Emily Paterson, director – Model Product Management, RMS
Irma has now dissipated to the relief of many, not least those who experienced the storm’s wrath. The actuality of Irma was not nearly as bad as feared, as discussed in my colleague Tom Sabbatelli’s blog yesterday. Irma’s final path spared the major population centers of Miami and Tampa from the storm’s most damaging winds and storm surge.
Prior to and immediately after landfall, before we could see the final path and the actual impact of Irma, the best that anyone can do is look at the range of possible losses — as the final actual loss can only be known after an event is fully over and the details become clear.
To help our clients understand the potential magnitude of Irma’s insured loss during the storm’s approach, RMS provided guidance around what the distribution of potential wind losses looked like. But although we can have a good level of confidence in potential wind scenarios ahead of time, it is only part of the equation. As the hurricane approaches, we can provide guidance on the risk and identify areas that could be affected by storm surge and flooding, but the distribution of potential losses from these perils is uncertain as these losses are highly sensitive to the nuances of the storm’s final track and wind field structure.
Remember that the Saffir-Simpson scale no longer advises on the expected levels of storm surge following Hurricanes Katrina and Ike — storms that disproved the conventional understanding of the links between a hurricane’s intensity and its storm surge potential.
Now that Irma has gone, observations and imagery have started to come in that reveal the storm’s true impact. We are now able to shift our focus from “what could happen” to “what did happen”, from postulating potential wind loss distributions to delving into the hazard — including storm surge and flood — and damage observations to inform our final reconstructions of the event. Ultimately our understanding of the totality of losses from Irma will account for all loss drivers, including those which were too uncertain to estimate ahead of time. Storm surge, flood and other complicating factors, such as the evacuations, business interruption, and the prolonged and extensive power outages, among others, will all play a part in the final outcome.
While Irma has only dissipated very recently, what is already very clear is that Irma is a very complicated and complex event. How the interplay between wind, storm surge and flood plays out in terms of losses, and adding on top the impact of the complicating factors listed above, will ultimately dictate what the final losses will be.
Wind and surge observations from anemometers and gauges go a long way in helping us to better understand the hazard experienced on the ground, and are crucial as we look to reconstruct the hazard from Irma – our first step to understanding the full loss.
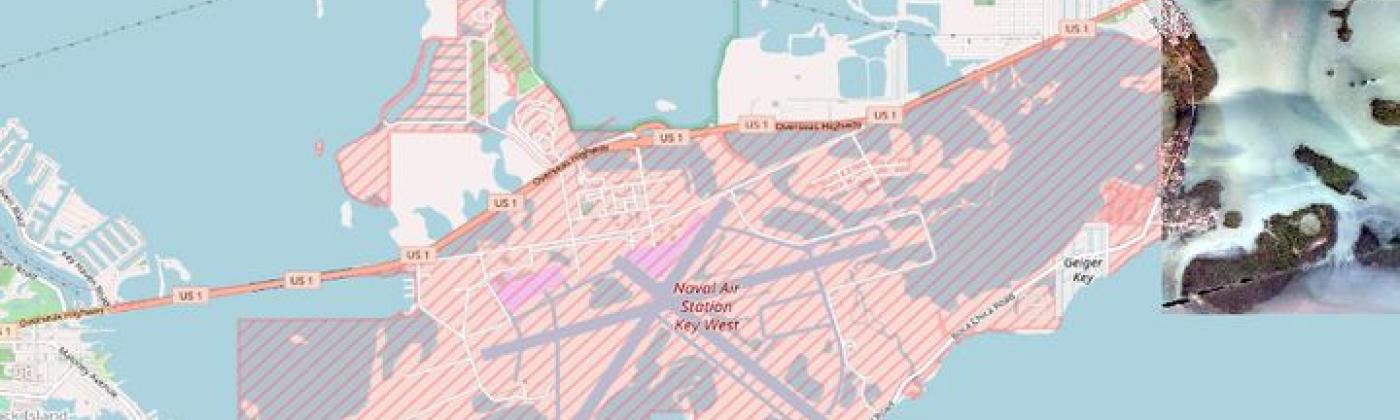
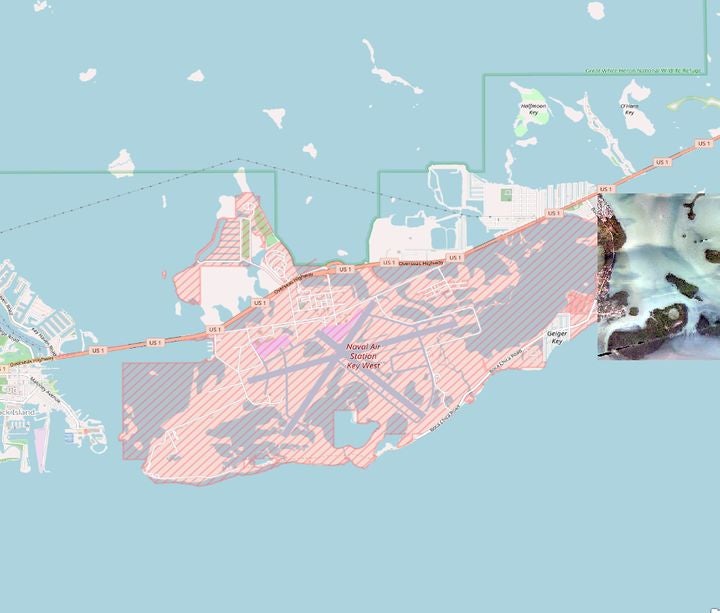
Satellite and drone imagery helps us go one step further and gives us a “birds eye view” of the damage experienced, helping to provide a fuller picture of both the type and level of damage, as well as a good indication of the extent. As we inspect the imagery we are looking for things that will help us refine our understanding of losses from this event — how far inland can we see surge damage? Is there roof damage from winds over a large area? We can use these observations to help refine and validate our understanding of loss. Another advantage of leveraging imagery is that it helps inform where we should focus our field reconnaissance efforts.
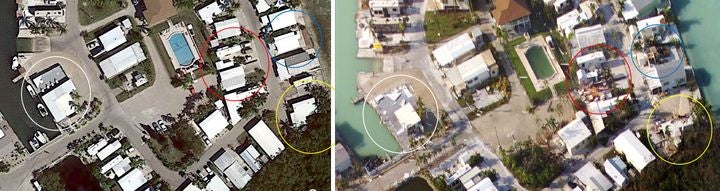
Figure 1. Map showing Key West Naval Base with photo image of residential area in the top right corner. Source: OpenStreetMapFigure 2: Residential area near Key West Naval Base, pre-event image from Google Earth, post-event aerial image acquired by NOAA on September 11, 2017
Our “boots on the ground” field reconnaissance approach really helps us refine our understanding with more detailed information. Not only does it help validate hazard observations with damage observations, but conversations with home and business owners, as well as those working on the recovery efforts, gives us insight into the prolonged effects impacting the affected communities, such as lengthy closures of businesses and insight into the types of internal and contents damage experienced by homeowners. Our field reconnaissance plans are already underway and as those field observations come in, they will be fed into our process as well. The more information we have about the damage on the ground, the better our understanding of the full totality of losses from an event will be.
Hurricane Matthew has tracked most of the way up the Florida coastline as a Category 3 major hurricane. Matthew tracked further offshore than previously forecast, placing the worst of the storm’s winds and storm surge offshore of Florida. While there have been hurricane force winds onshore and some damage from Matthew along portions of Florida’s east coast, thankfully the levels of damage in Florida that we are seeing are lower and less widespread than we expected just 24 hours ago.
As Matthew continues to track along the coastline, our focus shifts north towards Georgia and South Carolina, with a potential landfall near Charleston, South Carolina as a Category 2 hurricane. Even if landfall does not occur, there is significant flood risk in the southeast U.S., including high storm surge risk from Jacksonville northward to Charleston, SC. As a large, slow moving storm, Matthew has been absorbing a lot of tropical moisture and building up a lot of rising water over its lifecycle. This increases the potential for heavy rainfall and significant build-up of water along the southeast coastline, which features greater storm surge potential than eastern Florida due to local bathymetry. The magnitude and extent of storm surge-driven coastal flooding, exacerbated by the occurrence of astronomical high tide cycles, is expected to rival that of Hurricane Hugo (1989).
Bands of heavy rain are extending as much as 500 miles north-northeast of Matthew into Georgia and the Carolinas, suggesting that the storm could cause excessive rainfall and precipitation-induced flooding over the next few days. Rainfall estimates in excess of one foot (30 cm) are expected along the coast of South and North Carolina, two areas where soils are already heavily saturated and river levels are high based on significant rainfall over the last few weeks. According to the National Weather Service in Charleston, South Carolina, coastal and inland flooding impacts could be comparable or worse than the October 2015 flood event.
A shift in Matthew’s movement could have a large influence on the impacts both along the coast and further inland.
Over the past several days, Matthew’s forecast has changed significantly.
To assist our clients in understanding the full range of potential outcomes from Matthew, we continue to select stochastic events from our North Atlantic Hurricane model to represent the range of potential scenarios as the situation evolves. These have been provided to our clients on a daily basis, along with information regarding the modeled losses of these scenarios from our Industry Loss Curves. As the forecasts have evolved, so have the events we selected to represent the range of scenarios. As would be expected with a shift in forecast away from the Florida coast over the past 24 hours, today’s event selection saw a significant reduction in losses.
As a measure of the change in just 24 hours, the average industry loss of the 15 selected events yesterday was $20bn, with losses from the individual scenarios ranging from $7bn to $54bn. Today, the average loss of the 10 selected events was just $6bn, with losses from the individual scenarios ranging from less than $1bn to $19bn. This illustrates that the range of potential outcomes has shifted significantly, but it still remains wide – and continues to evolve.
But these are just modeled scenarios, chosen based on track parameters that are already out of date.
Just as the average loss from the range of scenarios doesn’t mean much, individual scenario losses shouldn’t be viewed as loss estimates for Matthew: they are chosen to help our clients make sense of what’s happening. Tomorrow these will change yet again as the official forecasts are updated and our understanding of the storm evolves.
Efforts towards determining RMS’ official loss estimate for a hurricane begin once the storm has fully passed.
This is when our modelers can begin producing reconstructions of the hurricane’s windfield and storm surge extent. In significant hurricane events, such as Matthew, RMS modelers and experts are also deployed to survey damage on the ground. Matthew’s ultimate behavior, including a possible recurvature towards The Bahamas and Florida next week, could potentially delay these efforts.
In the meantime, as Matthew is still evolving, so is our response.
The RMS Event Response team will continue to provide daily event reports with updates to the stochastic event selections daily through the weekend. The RMS Knowledge Center will also be on hand through the weekend should any questions arise.
Let’s see what tomorrow brings.
This post was co-authored by Emily Paterson, Tom Sabbatelli, Ben Brookes, and Paul Wilson.…
Emily Paterson is a senior manager in Model Product Management at RMS, where she leads the RMS Event Response Service, which responds to real-time catastrophe events around the world, providing products and tools for clients to assess the impact of an event. Since joining the event response team at the end of 2010, Emily has coordinated the RMS response to many significant events, including the Tohoku Earthquake and Tsunami in 2011 and Hurricane Sandy in 2012. Emily joined RMS in 2007, working in the Asia Pacific and Europe teams on model product management prior to joining the event response team. Emily holds a B.Sc. in Statistics from the University of Western Ontario and a M.Sc. in Disaster Management and Sustainable Development from Northumbria University.