Gearing Up for Irma: Using RMS Modeling to Generate Potential Loss Estimates
Tom Sabbatelli-GoodyerSeptember 06, 2017
23:30 UTC Wednesday, September 6
Tom Sabbatelli, hurricane risk expert, RMS
Hot on the heels of Hurricane Harvey, Irma looks like it could be the second major landfall in the U.S. this season, as it currently moves towards the Caribbean as a category 5 hurricane, with sustained winds around 185 miles per hour (297 kilometers per hour).
As always, the RMS Event Response starts early in the life of tropical storms, to provide the latest commentary, following up with RMS HWind footprints as data becomes available and providing initial sets of stochastic event selections around 48 hours before landfall. RMS Event Response practices have been designed to best serve our clients and the industry as a whole, and speculation of industry losses whilst such uncertainty remains can be counterproductive. Clients can see full information on the RMS Event Response processes by reading the following document available on RMS Owl.
A major benefit of the RMS approach to transparent model design and access to event data allows clients to interrogate many components of the underlying models, which can in turn be used to approximate losses under different scenarios. In this blog, I will explain how RMS clients can generate and understand scenario losses, linked to potential outcomes from Hurricane Irma.
Landfall Gate Event Approximations
As part of the RMS® North Atlantic Hurricane Models, RMS provides information about the landfall parameters for each of its stochastic events in a spreadsheet called the North Atlantic Hurricane Models: Landfalling and Bypassing Events Spreadsheet, available to download on RMS Owl. [Note that the North Atlantic Hurricane Models include a table called RMS_EVENTINFO that has similar information as the spreadsheet, but does not have as many storm attributes, and therefore should not be used for this type of analysis.]
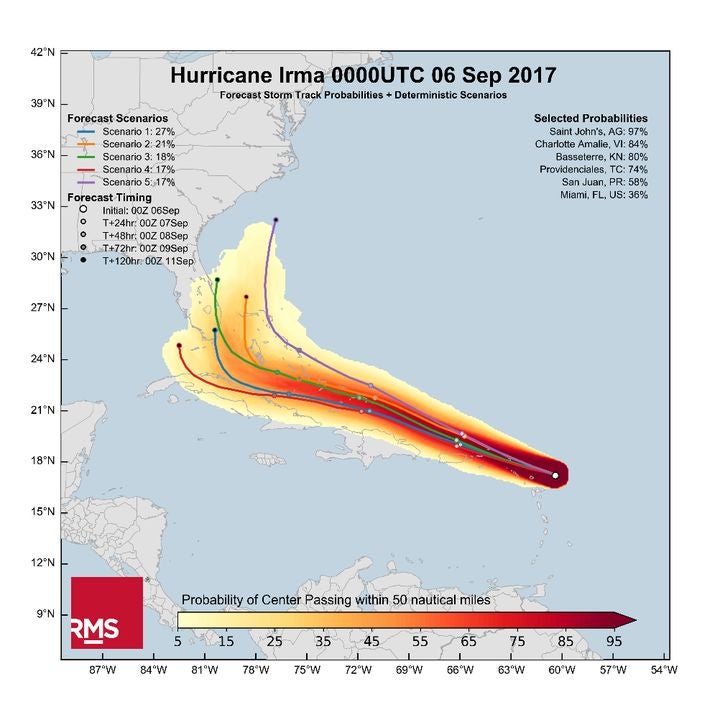
To help focus our modeling efforts we will be using the information in Figure 1 which displays the forecast tracks from a prototype product to be offered via our RMS HWind event service. This forecast product aggregates a number of different global ensemble prediction models as of 00:00 UTC on Tuesday, September 6. At the time of writing, two of the five prediction models are pointing to a landfall in or around the Miami region, so we will focus our scenario analysis on this area.
Figure 1: FORECAST tracks as of Sept 6, 2017 showing possible paths from global ensemble models. Color represents probability related to track path, not wind swath
The Landfalling and Bypassing event spreadsheet contains a large amount of information about the location and attributes of each stochastic event. Using this information and the information from the prediction models in Figure 1, we can begin to build a picture of possible representative events if Irma was to make landfall in a specific region.
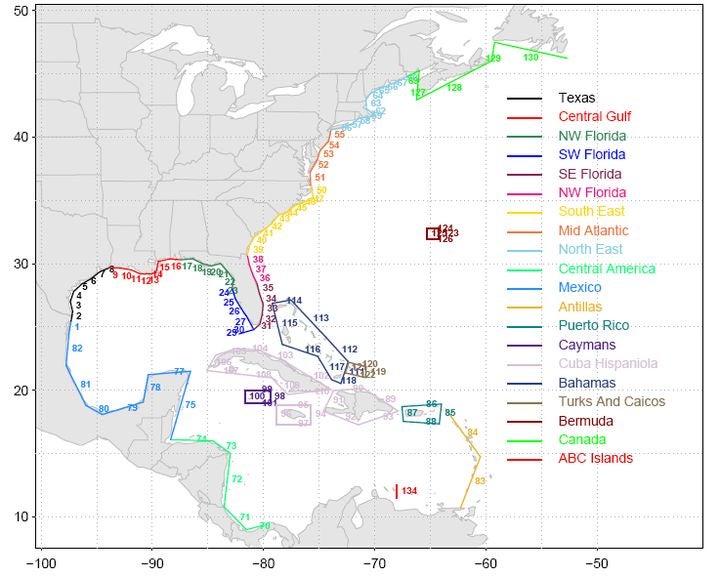
With Miami as our focus region, the first question is which landfall gate are we interested in. From the “Gates” tab in the spreadsheet, and displayed in Figure 2 below, we can see that there are a couple of potential gates, for simplicity we will select gate number 32. It is important to note that you can select as many, or as few gates as you wish when performing these types of analyses, and the loss scenarios associated will vary significantly depending on the concentrations of exposure impacted by the various selected events.
Figure 2: Landfall gates
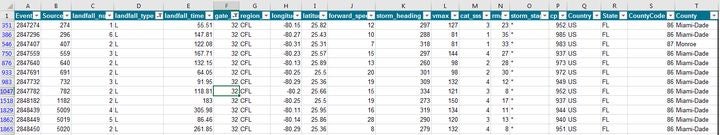
After selecting the gate of interest, we now can identify which events make landfall within this gate and begin to focus on their attributes. Figure 3 below shows a snapshot of the information stored in the landfall and bypassing spreadsheet once we have filtered for storms making direct landfall in gate 32. It is possible to filter these events further by a number of other parameters, including landfall category and Vmax. For this example, we will focus on only those events with a category of 3 or greater, leaving a set of 1239 stochastic events.
Figure 3: Event IDs selected based on landfall gate
Once you have identified a subset of stochastic events you can then collect the loss information for these events, whether using RiskLink®, RiskBrowser®, Risk Modeler or Miu. Loss numbers, and the uncertainty around these, can be used in statistical analyses to calculate the range of modeled losses given a landfall in our specified gate with a category 3 or above.
Irma will obviously change and evolve, but using RMS open and transparent modeling allows users to explore one of many possible scenarios that could unfold over the coming days.
Share:
You May Also Like
March 31, 2021
RMS 2020 Catastrophe Review: The Year of the COVID-19 Pandemic
Tom is a Director - Event Response at RMS, and leads the Event Response services operation. He joined RMS in 2009 and spent several years in the Client Support Services organization, primarily providing specialist peril model support. Tom joined RMS upon completion of his bachelor's and master's degrees in meteorology from Pennsylvania State University, where he studied the statistical influence of climate state variables on tropical cyclone frequency. He is a member of the American Meteorological Society (AMS).