What If The Oroville Dam Had Collapsed Completely?
Holly WidenMarch 03, 2017
RMS modeling reveals the wider risk of U.S. flooding, and a significant protection gap
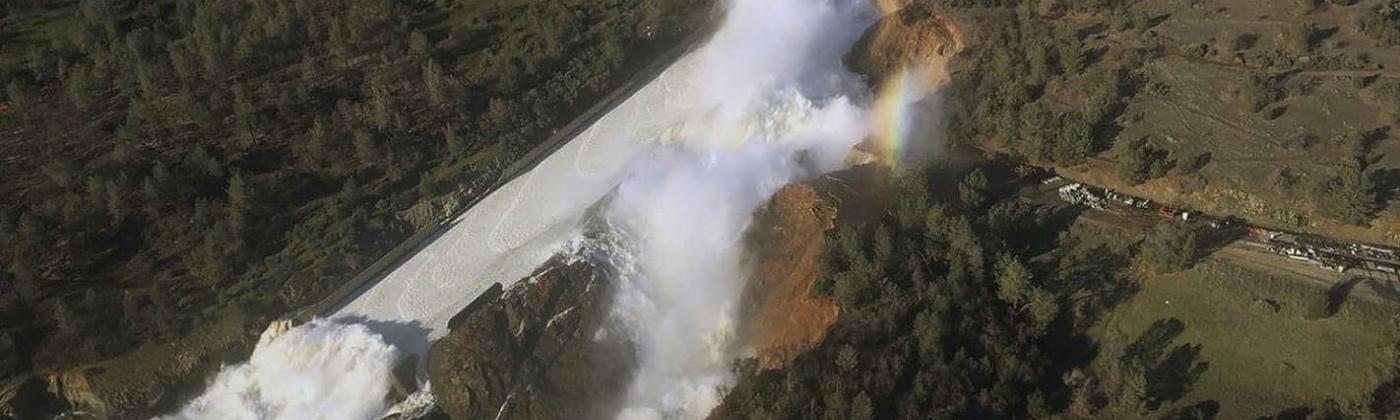
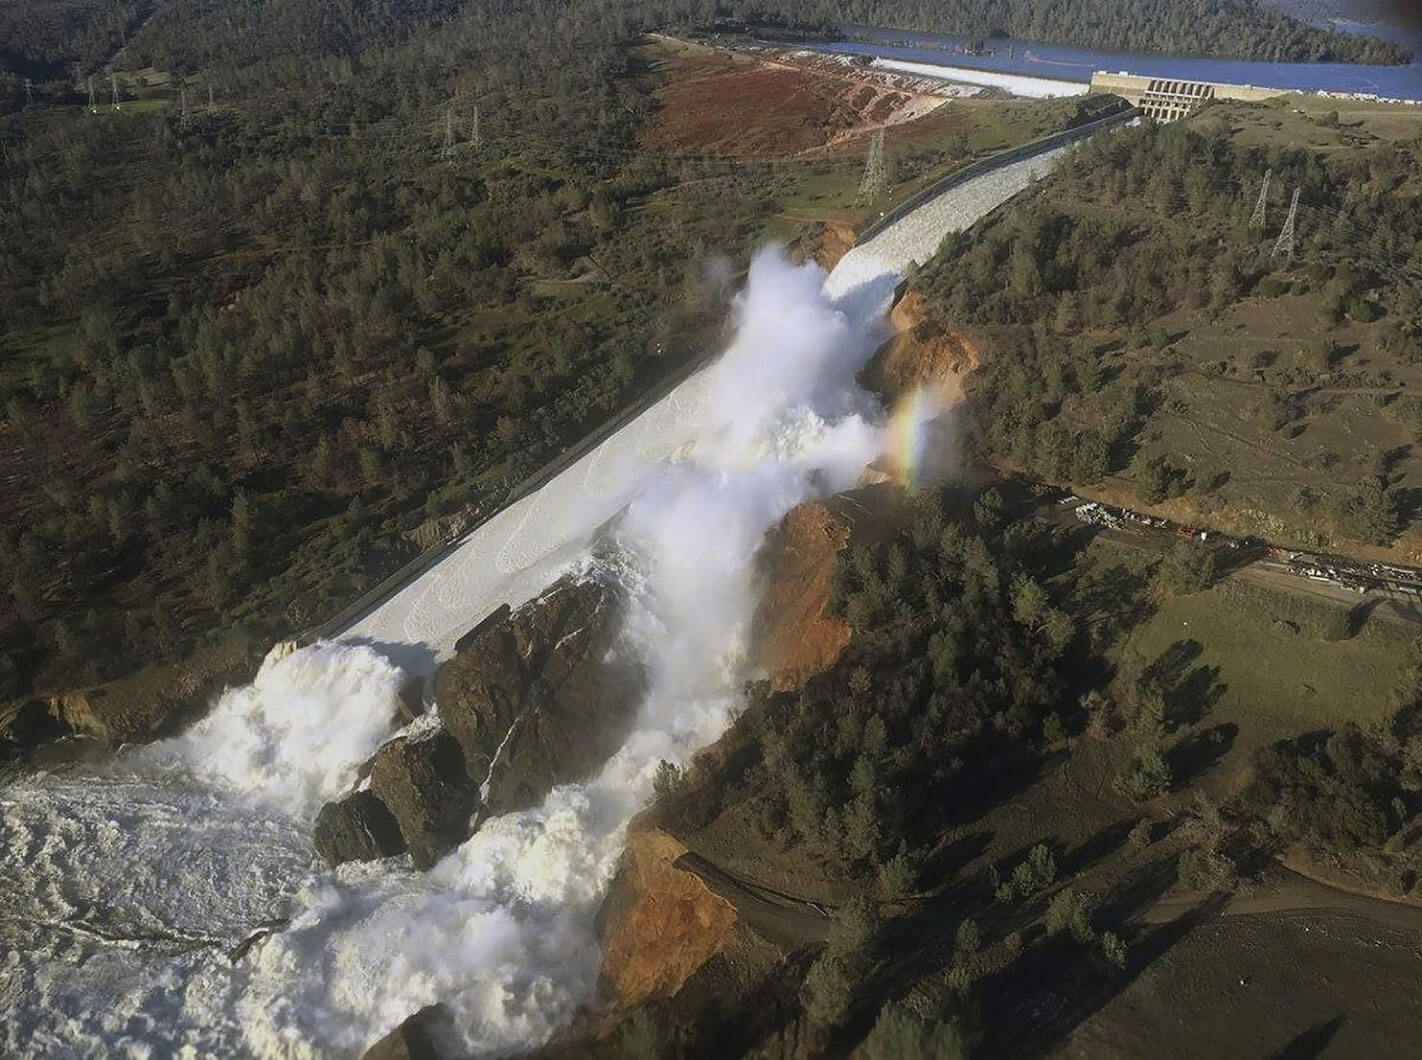
A combination of heavy rainfall and melting snow had filled Lake Oroville in northern California near to its capacity. Dam operators released water through the main spillway to control the reservoir level, but a 300-foot hole unexpectedly emerged, and the surrounding soil was eroded by the water gushing out. Spillway outflows were reduced to stop the erosion.
Oroville Dam after heavy rainfall in mid-February (Source: California Dept of Water Resource)
But this made the problem with rising reservoir levels worse, as the water then began to flow over the emergency spillway. On February 12, 2017, at least 188,000 residents were told to evacuate, while trucks and helicopters dumped over 1000 tons of material per hour on the weakened structure to prevent a more significant breach. As water levels in the reservoir subsided, the risk reduced.
With no massive discharge or flooding, insurance losses are expected to be limited to coverage for business interruption, loss of use, or additional living expenses (ALE) incurred by the evacuees.
It could have been far worse if the dam had completely failed – this was a worrying near-miss.
Dam failure, though rare, is not a negligible risk. In fact, a similar near-miss situation occurred during the 1971 San Fernando earthquake where the lower Van Norman Dam was a near-breach and forced the evacuation of 80,000 people. Our modeling teams decided to model a counter-factual version of February’s Oroville Dam breach, in which either (i) the dam continues to disintegrate in a controlled manner or, (ii) in the worst-case scenario, it collapses.
Our flood modelers, Ye Tian and Sonja Jankowfsky, simulated these ‘what if’ scenarios over a 72-hour cycle, using reservoir water level data from the California Data Exchange Center’s Department of Water Resources, and their own estimation of the lake’s bathymetry (contours of the lake bed) and capacity.
The worst-case scenario is modeled assuming the height of the dam wall becomes ‘zero’ instantaneously – for example, as might happen if there was an explosion due to sabotage. For the controlled breach scenario, the dam wall is gradually lowered at two meters per hour to simulate what could have happened had the erosion of the dam continued.
In our modeling, the amount of discharged water would be expected to overwhelm local flood control measures over 100 miles downstream, as was evidenced by the widespread flooding in the simulations. We estimate that under either scenario, about $21.8 billion of building value would be at risk, which, for the communities near Oroville, would be a huge problem because much of it is uninsured.
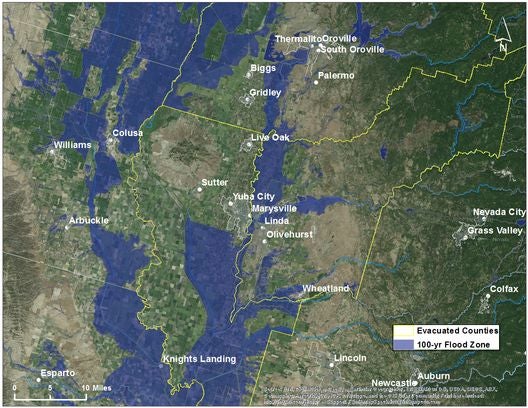
Insurance coverage is one of the most effective ways of ensuring a region re-bounds quickly after disaster, but in the Oroville region flood insurance penetration is fairly low. Most property owners rely on the National Flood Insurance Program (NFIP), which is most commonly sold to homes in the 100-year flood plain along the Feather River.
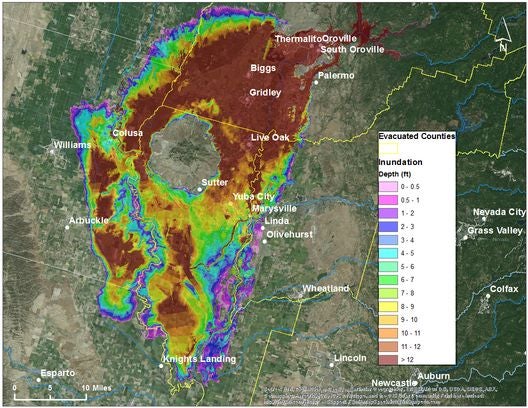
FEMA 100-year flood zonesPotential inundation depths simulated for a complete and instantaneous collapse of the Oroville Dam
This flood plain is shown as blue areas in this map. Compare that to the map below.
This map (right) shows modeling from the RMS ‘what if’ scenario of the Oroville Dam breach. The 100-year flood plain (map above) covers significantly less area than that which would be inundated if the dam breached (map right).
So, why does this matter? Residents living outside the 100-year flood zone are not required to purchase flood insurance, and therefore most do not. These areas include the towns of Biggs, Gridley, Live Oak, Oroville, South Oroville, Thermalito, and Yuba City. And yet as RMS modeling shows, many of those communities would have experienced major flooding if the dam had breached completely.
The Protection Gap
It is obvious that NFIP flood zone maps do not include dam failure scenarios, and yet these failures typically inundate a much wider area beyond the naturally occurring flood plain, because the volume of water and speed of release overwhelms natural and man-made defenses.
FEMA cannot quickly nor easily change the flood maps to incorporate this type of risk explicitly. At RMS, we are developing tools to quantify these kinds of extended risks to allow the private flood insurance market to step in and fill the current gaps in coverage.
Thankfully, our ‘what if’ scenario didn’t become a reality. But it highlights the risk of aging infrastructure which may not be able to withstand extreme weather events. Nationwide, the National Inventory of Dams indicates that of the 90,580 situated across the U.S., over 30% exhibit significant to high hazard potential due to structural deterioration.
[Note: clients can obtain modeling files for the Oroville Dam analysis from RMS account managers. This blog has been edited to provide further detail on the initial dam failure.]
It was off to London’s Savoy Hotel for members of the RMS London team last Thursday, for the Eleventh Trading Risk Awards. And apart from the great hospitality, and the flowing conversation from colleagues and industry peers alike, RMS was also recognized by the award judges, receiving the “Initiative of the Year” award for the RMS U.S. Inland Flood HD model.
Without sounding like an Oscar acceptance speech, on behalf of the team that worked on the model, I would like to thank the judging panel made up of representatives from the media and the industry for selecting our entry. Released last October, the flood model is designed to help the private insurance market seize the opportunities presented by this peril, and to also ultimately help accelerate flood insurance take up in the U.S.
Ben Brookes, managing director – capital and resilience solutions, RMS, (pictured center) receives the “Initiative of the Year” award at the Trading Risk Awards 2019In a country where hurricanes, tornados and wildfires can dominate the headlines, it is flood that is the most frequent and widespread peril in the U.S. Events range from small, localized flooding to widespread inundation impacting multiple river catchments and basins. The state-backed National Insurance Flood Program (NFIP) – recently extended until the end of September by Congress, dominates the flood insurance market, providing 95 percent of residential flood policies.
Even after significant flood events, such as from Hurricane Harvey in 2017, and Florence in 2018, NFIP policy numbers have recently plateaued; the New York Times reports that policies in force are below those a decade ago. In Midwest states, NFIP policies are down by a third since 2011, which has left many uninsured against this year’s ongoing flooding across the region. Flood is underinsured throughout much of the country, where only a third of homes in floodplains have insurance. And of the tens of trillions of dollars exposed to flood, still only a fraction is covered by the private market.
With FEMA looking to boost the number of households with flood insurance in the U.S from around five million now to eight million in 2022, what can be done to start to increase flood insurance penetration and to close this growing protection gap? How can private insurers enter the market with confidence and build a flood insurance business which will be profitable and sustainable in the long-term?
It is our belief that the insurance industry is currently inadequately served in terms of the accuracy and breadth of data available to achieve this task. As well as accessing accurate flood hazard data, this also extends to data on flood defenses, the first-floor height of a building or the presence of a basement – all key factors in assessing flood risk. There is also a need to use tools that can discern the high-gradient nature of flood extent and severity – and to accurately quantify probabilistic loss to exposures at risk.
We believe that the RMS U.S. Inland Flood HD Model does offer a comprehensive and well-validated view of flood risk throughout the contiguous U.S., which can help (re)insurers gain the necessary insights into the range of potential commercial opportunities associated with the private flood market. It captures the risk associated with all aspects of precipitation-induced flooding, including those resulting from tropical cyclone and non-tropical cyclone rainfall, while also accounting for factors that impact rainfall runoff (e.g., groundwater response, surface evapotranspiration, and snowmelt).
To capture flooding caused by tropical cyclones, the model is explicitly coupled to the same event set as the market-leading RMS North Atlantic Hurricane Model. Understanding flood risk and how it is correlated with wind exposure, is required for management of an overall book, risk tolerance and accumulations. And thus, it is particularly important to use a consistent view of risk across those aspects and across perils. By linking these models, it has enhanced the development of a truly complete and consistent view of the U.S. flood risk landscape – providing knowledge of how flood is spatially and temporally correlated across all its major sources, including storm surge and the wind peril.
Probabilistic modeling is essential, and the proprietary modeling methodology simulates over one million individual events, collectively representing 50,000 years of continuous precipitation, runoff, river discharge, and inundation within and across affected regions. These robust simulations provide a complete characterization of low- and high-severity flood events that could damage property, minimizing uncertainty to inform confident capital allocation, solvency assessments, and pricing based on model output. The model includes simulations of physically plausible flood events capable of causing losses far greater than have been observed historically, allowing (re)insurers to prepare for the potential financial impacts of the next flood catastrophe.
Using Innovative Modeling to Fill Critical Data Gaps
Flood hazard, vulnerability, and loss are extremely sensitive to building elevation and the presence of basements, which vary geographically across the U.S. When this data is not captured by the user, the model leverages proprietary inventory databases developed from extensive research to infer each building’s first floor height and basement likelihood. The explicit modeling of these two flood-specific characteristics, in addition to other general characteristics (e.g., construction class, occupancy, year built, etc.), helps reduce uncertainty in technical pricing with high-precision, per-location risk assessment.
Effective flood defenses also make a crucial difference when assessing flood risk. A major task of the RMS flood modeling team was to take disparate public levee data, which only accounts for a maximum of 20 percent of the nation’s flood defenses, together with the use of a proprietary stochastic modeling technique that accounts for the likely presence and standard of protection of defenses along the entire modeled river network.
This gives the option to see defended and undefended views of risk – to establish how the risk is reduced by a flood defense, and also allows users to customize these views, by adding their own defense information or adjusting the model’s default view. Allowing the market to quantify the sensitivities and impacts of various flood mitigation efforts and failure scenarios helps facilitate appropriate flood risk selection, pricing, and portfolio growth decisions throughout the U.S.
Gaining confidence and understanding around U.S. flood risk is a sound first step for the insurance industry to move forward and offer innovative coverages to meet the diverse needs of the market. And as the judging panel recognized, the U.S. Inland Flood Model represents real innovation to help achieve this.…
Dr. Holly Widen is a Product Manager in the Model Product Management team, focusing on the U.S. Flood suite of products. She joined RMS in 2016 upon completion of her Doctorate in Geography from Florida State University, where she studied tornado risk and vulnerability using applied spatial statistics. She has co-authored over ten peer-reviewed journal articles and is a member of the American Meteorological Society and the American Association of Geographers.